. 2022 Oct 6;79(11):542.
doi: 10.1007/s00018-022-04555-0.

Phagocytosing differentiated cell-fragments is a novel mechanism for controlling somatic stem cell differentiation within a short time frame

Affiliations

Phagocytosing differentiated cell-fragments is a novel mechanism for controlling somatic stem cell differentiation within a short time frame

Shohei Wakao et al. Cell Mol Life Sci. .

Abstract

Stem cells undergo cytokine-driven differentiation, but this process often takes longer than several weeks to complete. A novel mechanism for somatic stem cell differentiation via phagocytosing 'model cells' (apoptotic differentiated cells) was found to require only a short time frame. Pluripotent-like Muse cells, multipotent mesenchymal stem cells (MSCs), and neural stem cells (NSCs) phagocytosed apoptotic differentiated cells via different phagocytic receptor subsets than macrophages. The phagocytosed-differentiated cell-derived contents (e.g., transcription factors) were quickly released into the cytoplasm, translocated into the nucleus, and bound to promoter regions of the stem cell genomes. Within 24 ~ 36 h, the cells expressed lineage-specific markers corresponding to the phagocytosed-differentiated cells, both in vitro and in vivo. At 1 week, the gene expression profiles were similar to those of the authentic differentiated cells and expressed functional markers. Differentiation was limited to the inherent potential of each cell line: triploblastic-, adipogenic-/chondrogenic-, and neural-lineages in Muse cells, MSCs, and NSCs, respectively. Disruption of phagocytosis, either by phagocytic receptor inhibition via small interfering RNA or annexin V treatment, impeded differentiation in vitro and in vivo. Together, our findings uncovered a simple mechanism by which differentiation-directing factors are directly transferred to somatic stem cells by phagocytosing apoptotic differentiated cells to trigger their rapid differentiation into the target cell lineage.

Keywords: Apoptotic cells; Differentiation; Muse cells; Phagosomal release; Single-cell RNA sequencing; Somatic stem cells.


Conflict of interest statement

S. Wakao, Y. Kushida, Y. Kuroda, and M. Dezawa are affiliated with Tohoku University Graduate School of Medicine and are parties to a co-development agreement with Life Science Institute, Inc. (LSII; Tokyo, Japan). S. Wakao and M. Dezawa have a patent for Muse cells, and the isolation method thereof is licensed to LSII.

Figures
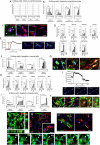
Fig. 1
Fig. 1
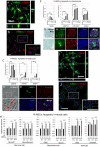
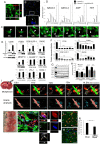
Lineage-specific differentiation and phagocytic activity in h-Muse cells. (A, B, D, F, H, J) (A) qPCR of human-cardiac markers in naïve-Muse cells (n-Muse) and h-Muse cells after co-culture with intact m-cardiomyocytes from D3 to D21 (mean ± SEM). qPCR of human-cardiac (B, D), -neural (F, H), and -hepatic (J) markers in naïve h-Muse cells (n-Muse) and h-Muse cells after incubating with apoptotic fragments derived from m-cardiomyocyte, r-neural cells, and r-hepatic cells from D3 to D21 (mean ± SEM). In D and H, D7 (P + T) indicates h-Muse cells incubated with apoptotic-cell fragments for 3 days and then co-cultured with a damaged tissue slice for 7 days (mean ± SEM). Confirmed species-specific primers were used in qPCR. Apoptotic cell fragments were used as a negative control (Nega). For the positive control, human fetal heart total RNA (A, B), h-adult heart (D), and h-fetus whole total RNA (F, H, J) were used (Posi). *p < 0.05, **p < 0.01, ***p < 0.001. C, G, K Immunocytochemistry in h-Muse cells after incubating with apoptotic fragments. C Non-labeled h-Muse cells were incubated with apoptotic GFP-m-cardiomyocyte fragments. Arrows: GFP-positive fragments/particles in the cytoplasm. Inset arrowheads: striated-like pattern of troponin-I in h-Muse cells. G, K h-Muse cells were transduced with GFP-lentivirus for identification. Apoptotic fragments were from non-labeled cells. Low magnification images of (G) are shown in Fig. S2B. E, I Intracellular calcium dynamics in green fluorescent protein (GFP)-based Ca calmodulin probe (GCaMP)-h-Muse cells after biochemical depolarization with 70 mM (E) and 50 mM (I) KCl, respectively (added at 20 s) (see Movies 1). The change in the fluorescence intensity over time was demonstrated. LN Laser confocal microscopy of GFP-h-Muse cells incubated with mCherry-m-Hepa1 DDCs. L Live imaging at 20 h (see Movie 2) shows Z-series 3D construction. M Analysis of (L) by Bitplane Imaris software revealed phagocytosed fragments in h-Muse cells. Inset: magnification of the box area. M Transition of large mCherry-fragments to smaller particles after phagocytosis (see Movie 2). N GFP-h-Muse cells in the post-infarct rat heart tissue at D5 contained LAMP-1( +) phagosomes (red, arrowheads). Bars: C, G, K = 25 μm; E, I, MO = 50 μm; L = 100 μm
Fig. 2
Fig. 2
Phagocytic activity and lineage-specific differentiation of h-MSCs and r-NSCs. A, B Laser confocal microscopy of GFP-h-MSCs incubated with mCherry-m-Hepa1 DDC (A) at 20 h was used for Z-series 3D reconstruction. B Analysis of (A) by Bitplane Imaris software revealed phagocytosed fragments in h-MSCs. Inset is the high magnification of the box area. C, F qPCR of h-adipocyte (C) and -chondrocyte (F) markers in naïve h-Muse cells (n-Muse) and h-MSCs after incubating with m-adipocyte- (C) and m-chondrocyte-DDCs (F) from D3 to D21 (mean ± SEM). Confirmed species-specific primers were used in qPCR. Apoptotic cell fragments were used as a negative control (Nega). For the positive control, total RNA obtained from adipocytes and chondrocytes induced from human MSCs were used (Posi). D, E, G, H Histological assessment. D, E h-MSCs incubated with m-adipocyte DDCs contained lipid droplets in the cytoplasm stained by Oil Red at D21 (D). FABP4 was confirmed to be expressed in h-nuclei-positive h-MSCs at D21 (E). G, H h-MSCs incubated with m-chondrocyte DDCs and cultured in suspension exhibited positivity for Alcian blue at D21 (G). ACAN was confirmed to be expressed in h-nuclei-positive h-MSCs at D21 (H). I Laser confocal microscopy of GFP-r-NSCs incubated with mCherry-m-Hepa1 DDC (A) at 20 h. J Analysis of (I) by Bitplane Imaris software. K qPCR (mean ± SEM) of rat-neural markers in r-NSCs with [DDC( +)] or without [DDCs (−)] incubation with h-neural cell DDCs from D3 to D14. Positivity of each marker in adult rat brain total RNA and negativity in h-neural cells were confirmed in each primer. Bars: A = 100 μm, B, EJ = 50 μm. *p < 0.05, **p < 0.01, ***p < 0.001
Fig. 3
Fig. 3
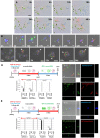
Lineage-specific differentiation of h-Muse cells and h-MSCs after phagocytosis in vitro. A GATA-4p-mCherry-h-Muse cells expressed mCherry and changed their morphology after uptake of apoptotic GFP-m-cardiomyocyte DDCs (see Movie 3). B, C Laser confocal microscopy live images of the same experiment as (A) in h-Muse cells (B) (see Movie 4). C SOX9p-mCherry-h-MSCs were incubated with m-chondrocyte DDCs (see Movie 5). D, E Cardiac- and neural-marker expression at D6, and laser confocal images at 40 h of (D) GATA-4p-mCherry/NEUROD1p-CFP-co-introduced h-Muse cells incubated with non-labeled-m-cardiomyocyte DDCs for 3 days, washed, and then incubated with GFP-rat-neural DDCs for another 3 days, and then, E the incubation order was reversed with non-labeled-rat-neural DDCs, followed by GFP-m-cardiomyocyte DDCs (mean ± SEM). qPCR; D6: GATA-4p-mCherry/NEUROD1p-CFP-co-introduced h-Muse cells at day 6, Positive control; human fetal-heart (for NKX2.5 and GATA-4) and -brain (for FOXP2 and PAX6) total RNA, Negative control: apoptotic cell fragments. Bars AE = 25 μm. ***p < 0.001
Fig. 4
Fig. 4
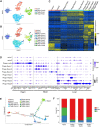
Single-cell RNA sequencing of h-Muse cells after incubating with mouse/rat-apoptotic fragments. A, B t-SNE visualization of naïve h-Muse cells (Naïve) and h-Muse cells after incubating with m-cardiomyocyte DDCs (Phago-cardio), r-neural cell DDCs (Phago-Neuro), and r-hepatic cell DDCs (Phago-Hepa). C, D Hierarchy heatmap (C) and dot plot of the lineage-specific marker genes (D) in each of the 10 clusters. In D, the minimum value of its accessibility is subtracted for each gene, and the result is divided by the maximum value of its accessibility. The dot size indicates the percent of cells in each cluster in which the gene of interest is accessible. The standardized accessibility level is indicated by the color intensity. E Monocle trajectory plots show 5 states. F The rate of G1, G2M, and S phases in Naïve-, Phago-cardio-, Phago-neuro-, and Phago-hepa-Muse cells
Fig. 5
Fig. 5
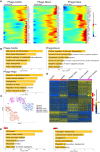
Single-cell RNA sequencing of h-Muse cells and comparison with authentic differentiated cells. A Pseudotemporal depiction of heatmap showing the expression level of lineage-specific genes (referenced to The Human Protein Atlas and BioGPS databases) during the trajectory. B GO term of DEGs between Naïve-Muse cells and each Phago-Muse group. CE t-SNE visualization (C) and hierarchy heatmap (D) of 2 Naïve h-Muse cell clusters (Naïve-1, -2), Phago-cardio-Muse (Phago-cardio), and adult human cardiomyocyte cell line (Authen-Cardio-1, -2). E GO term for red line A (signals detected in Naïve-2 and Authen-Cardio-2) and b (Phago-cardio-Muse and Authen-cardio-clusters 1 and 2) in (D) is shown
Fig. 6
Fig. 6
Effect of phagocytosis suppression on h-Muse cell differentiation in vitro and in vivo. AC GFP-h-Muse cells incubated with annexin V-treated apoptotic mCherry-m-Hepa1 DDCs. A at 20 h with Z-series 3D construction (see Movie 6). B Analysis of (A) by Bitplane Imaris software. The inset shows high magnification of the box. Arrowhead: phagocytosed signal. C mCherry-phagosome in GFP-h-Muse cells was released back to the extracellular space (see Movie 6). D qPCR (mean ± SEM) of h-cardiac markers in naïve h-Muse cells (n-Muse) and h-Muse cells after incubation with m-cardiomyocyte DDCs pretreated with annexin V or with annexin V + anti-annexin V neutralizing antibody. DDCs were used as a negative control (Nega), and human fetal heart total RNA as a positive control (Posi). E Western blot (mean ± SEM) of each phagocytosis receptor in h-Muse cells in the naïve state and D2 after incubation with m-cardiomyocyte DDCs. Beta-actin (ACTB) is common to all the blots. The signal in the naïve h-Muse cells is set as 1. F, G Western blot (mean ± SEM) demonstrated reduction in phagocytosis receptor expression in 4-siRNA-h-Muse cells until D15. H h-cardiac marker expression (mean ± SEM) in 4-siRNA-h-Muse cells after incubation with m-cardiomyocyte DDCs. IM Neuronal differentiation of h-Muse cells after phagocytosis in vivo. C57BL/6-Tg (CAG-EGFP) mouse focal stroke model 10 ~ 14.5 h after topical injection of mCherry-h-Muse cells transfected with NEUROD1-promoter-CFP. I TTC staining of the mouse focal brain ischemia model. Multiphoton laser scanning microscopy images and Bitplane Imaris software analysis of the infarct area (see Movie 7). *: vessels, white arrows: NEUROD1-CFP-positive mCherry-h-Muse cells, white arrowheads: NEUROD1-CFP-negative mCherry-h-Muse cells. J TTC staining of cerebral ischemia at 2 days after stroke. K Left: Large image of mCherry-h-Muse cells in the post-infarct mouse brain tissue at D1 contained GFP(+)-host-derived fragments (arrowheads) and LAMP-1(+) phagosomes (arrows). Right: Enlarged image of the white square. L, M NeuN (+) in GFP + cells in naïve-GFP-h-Muse cell injected- (L) and GFP-4-siRNA-h-Muse cell injected- (M) brain at D7. M The ratio of NEUN + in naïve-GFP-h-Muse cells and GFP-4-siRNA-h-Muse cells at D7 (mean ± SEM). Bars: A = 100 μm, B, C, I, L, M = 50 μm. K left = 50 μm, K right = 5 μm. *p < 0.05, **p < 0.01, ***p < 0.001
Fig. 7
Fig. 7
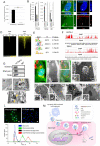
Detection of DDC-derived DNA, mRNA, and transcription factors in h-Muse cells after phagocytosis. A Mouse genome and B mouse mRNA, Foxa2, Hnf4, and a-fetoprotein (Afp), in h-Muse cells incubated with m-Hepa1 DDCs either with or without annexin V-pretreatment (1 day). m-Hepa1-6 cells (Hepa1-6) as positive control. Graphs: mean ± SEM. C Phagocytosed signal derived from GATA-4-m-HL-1 DDCs located in the nucleus of GFP-h-Muse cells at 36 h. Bar = 25 μm. DG H-Muse cells were incubated with GATA-4-m-HL-1 DDCs. DF ChIP seq for HA tag-GATA-4 in h-Muse cells after incubation with HA tag-GATA-4-m-HL-1 DDCs. D Heatmap analysis of ChIP-seq signals ± 5 kb around the nearest TSS. E Transcription factor recognition motifs most significantly enriched in HA tag-GATA4 peaks. F Enrichment of sequencing tags was identified upstream of GATA-4 and Tbx5 in the ChIP samples (red) compared with input (black). G GATA-4-mCherry fusion protein in the h-Muse nuclear fraction of 8 h after incubating with apoptotic GATA-4-m-HL-1 DDC fragments was co-immunoprecipitated with anti-mCherry antibody or control IgG. mCherry, RNA Polymerase II and transcription factor II B were detected. HJ Immunoelectron microscopy for anti-mCherry in h-Muse cells incubated with apoptotic mCherry-m-Hepa1-6 DDC fragments for 1 day. Arrowheads indicate mCherry labeled by nanogold. H Is negative control. I Shows a mCherry(+) (arrowheads) phagosome separated by a narrow space in the h-Muse cell cytoplasm. J Arrowheads suggest the fusion of outer and inner cell membranes of phagosomes to release mCherry-positive contents into the cytoplasm of h-Muse cells. K TEM (K-2, K-4 ~ K8) merged with laser confocal microscopic image (K-1, K-3) in GFP-h-Muse cells incubated with apoptotic mCherry-m-Hepa1-6 DDC fragments for 12 ~ 24 h. H-Muse cells showed a phagosome containing DDCs. Double cell membrane of the phagosome was observed in K-4 (inset). L Green fluorescence indicates lysosomal activity of mouse peritoneal macrophages and h-Muse cells. Lysosomal activity is also shown by cell sorting. M Putative mechanism of how phagocytosis regulates commitment of stem cells (for example, Muse cells) to the phagocytosed cell lineage. DDC-derived transcription factors, proteins, DNA, and mRNA are released into the cytoplasm. Apoptotic cell-derived transcription factors might translocate to the nucleus and function directly in the stem cell. Bars: H = 700 nm, I, J = 200 nm, K1-3 = 10 μm, K4-8 = 2 μm. *p < 0.05, **p < 0.01, ***p < 0.001

Similar articles

Cited by

References

    1. Sun Z, Costell M, Fassler R. Integrin activation by talin, kindlin and mechanical forces. Nat Cell Biol. 2019;21:25–31. doi: 10.1038/s41556-018-0234-9. - DOI - PubMed
    1. Caplan AI. Mesenchymal stem cells. J Orthop Res. 1991;9:641–650. doi: 10.1002/jor.1100090504. - DOI - PubMed
    1. Prockop DJ. Marrow stromal cells as stem cells for nonhematopoietic tissues. Science. 1997;276:71–74. doi: 10.1126/science.276.5309.71. - DOI - PubMed
    1. Urban N, Blomfield IM, Guillemot F. Quiescence of adult mammalian neural stem cells: a highly regulated rest. Neuron. 2019;104:834–848. doi: 10.1016/j.neuron.2019.09.026. - DOI - PubMed
    1. Gimeno ML, Fuertes F, BarcalaTabarrozzi AE, Attorressi AI, Cucchiani R, Corrales L, Oliveira TC, Sogayar MC, Labriola L, Dewey RA, Perone MJ. Pluripotent nontumorigenic adipose tissue-derived muse cells have immunomodulatory capacity mediated by transforming growth factor-β1. Stem Cells Transl Med. 2017;6:161–173. doi: 10.5966/sctm.2016-0014. - DOI - PMC - PubMed