

CReSIL: accurate identification of extrachromosomal circular DNA from long-read sequences
- PMID: 36198068
- PMCID: PMC10144670
- DOI: 10.1093/bib/bbac422
CReSIL: accurate identification of extrachromosomal circular DNA from long-read sequences
Erratum in
-
Correction to: CReSIL: accurate identification of extrachromosomal circular DNA from long-read sequences.Brief Bioinform. 2023 Sep 22;24(6):bbad402. doi: 10.1093/bib/bbad402. Brief Bioinform. 2023. PMID: 37864297 Free PMC article. No abstract available.
Abstract
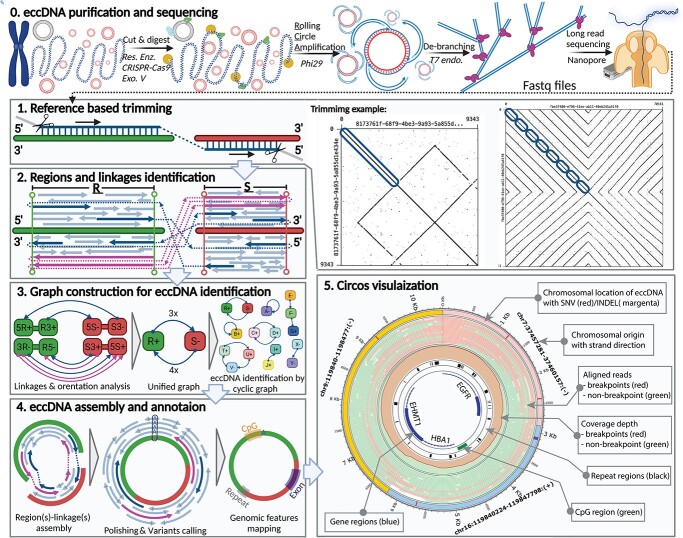
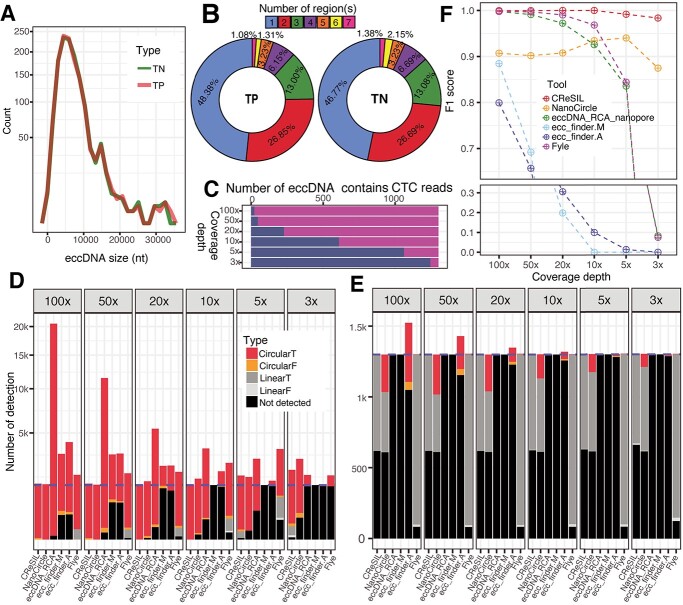
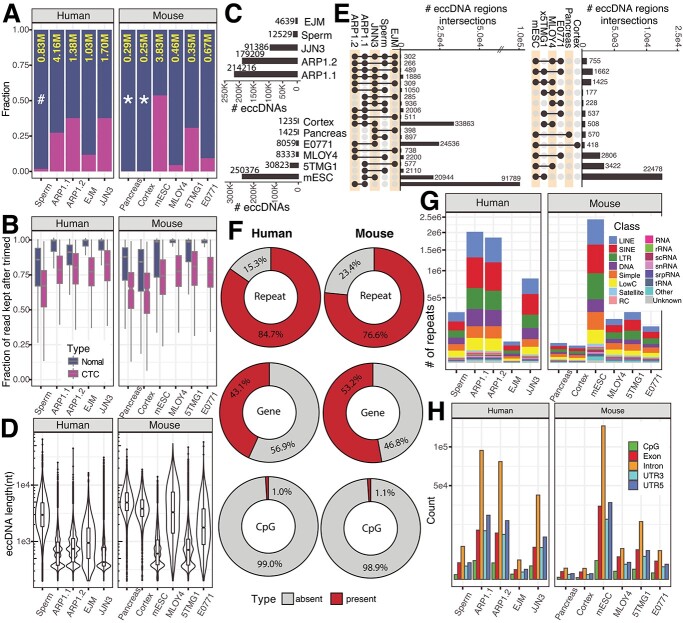
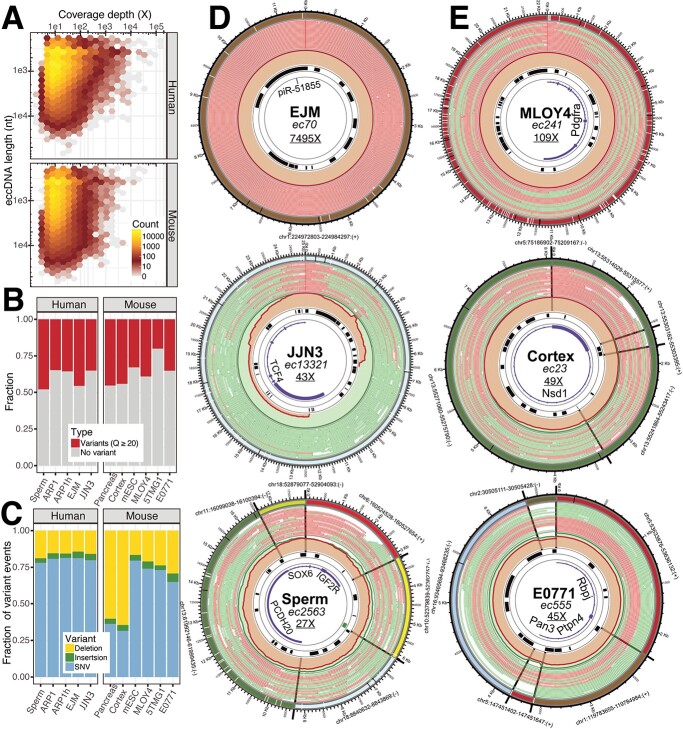
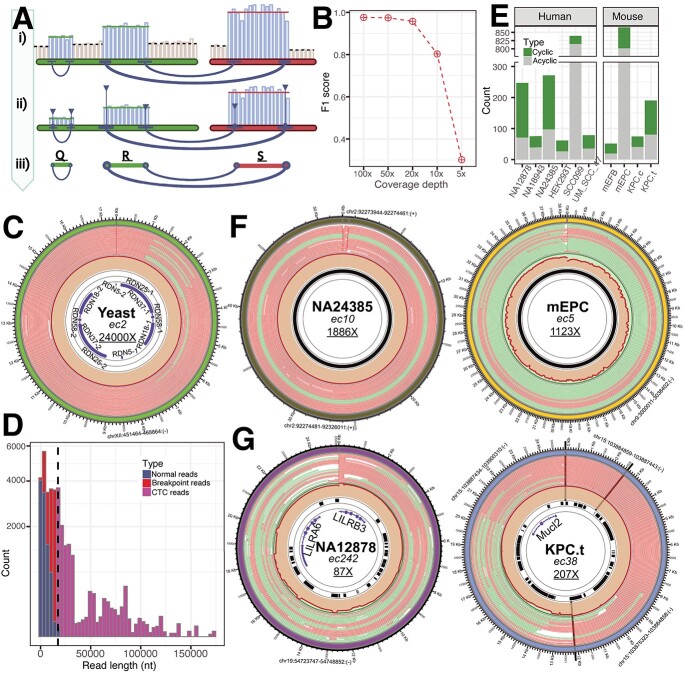
Extrachromosomal circular DNA (eccDNA) of chromosomal origin is found in many eukaryotic species and cell types, including cancer, where eccDNAs with oncogenes drive tumorigenesis. Most studies of eccDNA employ short-read sequencing for their identification. However, short-read sequencing cannot resolve the complexity of genomic repeats, which can lead to missing eccDNA products. Long-read sequencing technologies provide an alternative to constructing complete eccDNA maps. We present a software suite, Construction-based Rolling-circle-amplification for eccDNA Sequence Identification and Location (CReSIL), to identify and characterize eccDNA from long-read sequences. CReSIL's performance in identifying eccDNA, with a minimum F1 score of 0.98, is superior to the other bioinformatic tools based on simulated data. CReSIL provides many useful features for genomic annotation, which can be used to infer eccDNA function and Circos visualization for eccDNA architecture investigation. We demonstrated CReSIL's capability in several long-read sequencing datasets, including datasets enriched for eccDNA and whole genome datasets from cells containing large eccDNA products. In conclusion, the CReSIL suite software is a versatile tool for investigating complex and simple eccDNA in eukaryotic cells.
Keywords: CRESIL; bioinformatic tool; eccDNA; long-read sequence.
© The Author(s) 2022. Published by Oxford University Press. All rights reserved. For Permissions, please email: journals.permissions@oup.com.
Conflict of interest statement
None of the authors have any competing interests.
Figures
Similar articles
-
eccDNA-pipe: an integrated pipeline for identification, analysis and visualization of extrachromosomal circular DNA from high-throughput sequencing data.Brief Bioinform. 2024 Jan 22;25(2):bbae034. doi: 10.1093/bib/bbae034. Brief Bioinform. 2024. PMID: 38349061 Free PMC article.
-
Comparative analysis of methodologies for detecting extrachromosomal circular DNA.Nat Commun. 2024 Oct 25;15(1):9208. doi: 10.1038/s41467-024-53496-8. Nat Commun. 2024. PMID: 39448595 Free PMC article.
-
ECCsplorer: a pipeline to detect extrachromosomal circular DNA (eccDNA) from next-generation sequencing data.BMC Bioinformatics. 2022 Jan 14;23(1):40. doi: 10.1186/s12859-021-04545-2. BMC Bioinformatics. 2022. PMID: 35030991 Free PMC article.
-
Purification, full-length sequencing and genomic origin mapping of eccDNA.Nat Protoc. 2023 Mar;18(3):683-699. doi: 10.1038/s41596-022-00783-7. Epub 2022 Dec 14. Nat Protoc. 2023. PMID: 36517607 Review.
-
Extrachromosomal circular DNA in eukaryotes: possible involvement in the plasticity of tandem repeats.Cytogenet Genome Res. 2009;124(3-4):327-38. doi: 10.1159/000218136. Epub 2009 Jun 25. Cytogenet Genome Res. 2009. PMID: 19556784 Review.
Cited by
-
Decoding the genomic enigma: Approaches to studying extrachromosomal circular DNA.Heliyon. 2024 Aug 20;10(17):e36659. doi: 10.1016/j.heliyon.2024.e36659. eCollection 2024 Sep 15. Heliyon. 2024. PMID: 39263178 Free PMC article. Review.
-
eccDNA-pipe: an integrated pipeline for identification, analysis and visualization of extrachromosomal circular DNA from high-throughput sequencing data.Brief Bioinform. 2024 Jan 22;25(2):bbae034. doi: 10.1093/bib/bbae034. Brief Bioinform. 2024. PMID: 38349061 Free PMC article.
-
Categorizing Extrachromosomal Circular DNA as Biomarkers in Serum of Cancer.Biomolecules. 2024 Apr 17;14(4):488. doi: 10.3390/biom14040488. Biomolecules. 2024. PMID: 38672504 Free PMC article. Review.
-
Comparative analysis of methodologies for detecting extrachromosomal circular DNA.Nat Commun. 2024 Oct 25;15(1):9208. doi: 10.1038/s41467-024-53496-8. Nat Commun. 2024. PMID: 39448595 Free PMC article.
-
A distinct circular DNA profile intersects with proteome changes in the genotoxic stress-related hSOD1G93A model of ALS.Cell Biosci. 2023 Sep 13;13(1):170. doi: 10.1186/s13578-023-01116-1. Cell Biosci. 2023. PMID: 37705092 Free PMC article.
References
-
- Peng H, Mirouze M, Bucher E. Extrachromosomal circular DNA: a neglected nucleic acid molecule in plants. Curr Opin Plant Biol 2022;69:102263. - PubMed
-
- Kanda T, Otter M, Wahl GM. Mitotic segregation of viral and cellular acentric extrachromosomal molecules by chromosome tethering. J Cell Sci 2001;114:49–58. - PubMed
