

Quantifying ethnic segregation in cities through random walks
- PMID: 36192428
- PMCID: PMC9530170
- DOI: 10.1038/s41467-022-33344-3
Quantifying ethnic segregation in cities through random walks
Abstract
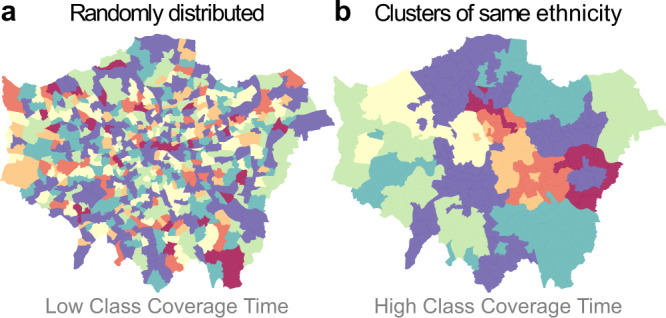
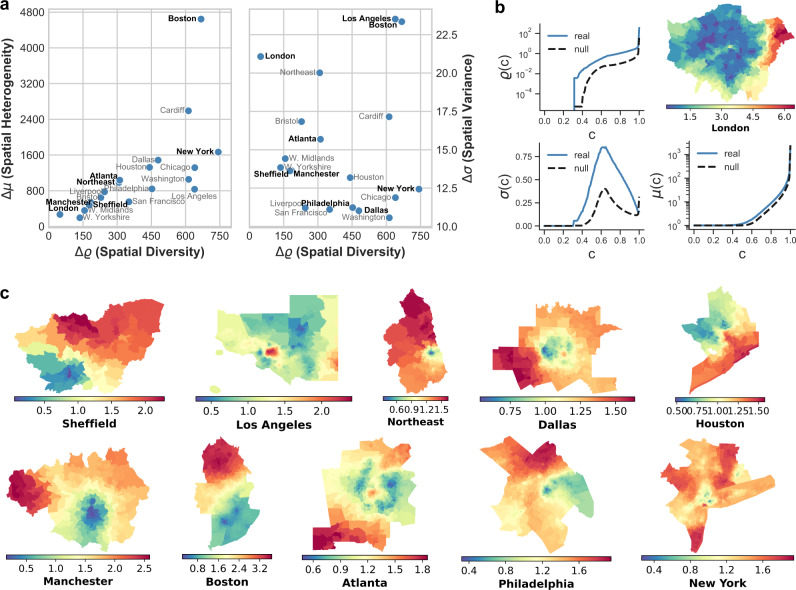
Socioeconomic segregation has an important role in the emergence of large-scale inequalities in urban areas. Most of the available measures of spatial segregation depend on the scale and size of the system under study, or neglect large-scale spatial correlations, or rely on ad-hoc parameters, making it hard to compare different systems on equal grounds. We propose here a family of non-parametric measures for spatial distributions, based on the statistics of the trajectories of random walks on graphs associated to a spatial system. These quantities provide a consistent estimation of segregation in synthetic spatial patterns, and we use them to analyse the ethnic segregation of metropolitan areas in the US and the UK. We show that the spatial diversity of ethnic distributions, as measured through diffusion on graphs, allow us to compare the ethnic segregation of urban areas having different size, shape, or peculiar microscopic characteristics, and exhibits a strong association with socio-economic deprivation.
© 2022. The Author(s).
Conflict of interest statement
The authors declare no competing interests.
Figures
Similar articles
-
Mortgage possessions, spatial inequality, and obesity in large US metropolitan areas.Public Health. 2020 Apr;181:86-93. doi: 10.1016/j.puhe.2019.11.021. Epub 2020 Jan 21. Public Health. 2020. PMID: 31978778
-
Socioeconomic Segregation in Large Cities in France and the United States.Demography. 2016 Aug;53(4):1051-84. doi: 10.1007/s13524-016-0491-9. Demography. 2016. PMID: 27393232
-
Race/Ethnicity, Socioeconomic Status, Residential Segregation, and Spatial Variation in Noise Exposure in the Contiguous United States.Environ Health Perspect. 2017 Jul 25;125(7):077017. doi: 10.1289/EHP898. Environ Health Perspect. 2017. PMID: 28749369 Free PMC article.
-
Socio-economic inequalities in mortality due to injuries in small areas of ten cities in Spain (MEDEA Project).Accid Anal Prev. 2011 Sep;43(5):1802-10. doi: 10.1016/j.aap.2011.04.013. Epub 2011 May 19. Accid Anal Prev. 2011. PMID: 21658508
-
The racial/ethnic distribution of heat risk-related land cover in relation to residential segregation.Environ Health Perspect. 2013 Jul;121(7):811-7. doi: 10.1289/ehp.1205919. Epub 2013 May 14. Environ Health Perspect. 2013. PMID: 23694846 Free PMC article.
Cited by
-
First passage time analysis of spatial mutation patterns reveals sub-clonal evolutionary dynamics in colorectal cancer.PLoS Comput Biol. 2023 Mar 13;19(3):e1010952. doi: 10.1371/journal.pcbi.1010952. eCollection 2023 Mar. PLoS Comput Biol. 2023. PMID: 36913406 Free PMC article.
-
Aging effects in Schelling segregation model.Sci Rep. 2022 Nov 12;12(1):19376. doi: 10.1038/s41598-022-23224-7. Sci Rep. 2022. PMID: 36371496 Free PMC article.
-
Urban segregation on multilayered transport networks: a random walk approach.Sci Rep. 2024 Apr 10;14(1):8370. doi: 10.1038/s41598-024-58932-9. Sci Rep. 2024. PMID: 38600261 Free PMC article.
References
-
- Gelfand, A. E., Diggle, P., Guttorp, P. & Fuentes, M.Handbook of spatial statistics (CRC Press, 2010).
-
- Barthelemy, M.The Structure and Dynamics of Cities: Urban Data Analysis and Theoretical Modeling (Cambridge University Press, Cambridge, 2016).
-
- Batty, M.The New Science of Cities (MIT Press, Cambridge, Massachusetts, 2013).
Publication types
MeSH terms
LinkOut - more resources
Full Text Sources
