Blood levels of T-Cell Receptor Excision Circles (TRECs) provide an index of exposure to traumatic stress in mice and humans
- PMID: 36192377
- PMCID: PMC9530209
- DOI: 10.1038/s41398-022-02159-7
Blood levels of T-Cell Receptor Excision Circles (TRECs) provide an index of exposure to traumatic stress in mice and humans
Abstract
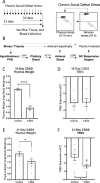
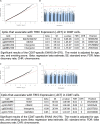
Exposure to stress triggers biological changes throughout the body. Accumulating evidence indicates that alterations in immune system function are associated with the development of stress-associated illnesses such as major depressive disorder and post-traumatic stress disorder, increasing interest in identifying immune markers that provide insight into mental health. Recombination events during T-cell receptor rearrangement and T-cell maturation in the thymus produce circular DNA fragments called T-cell receptor excision circles (TRECs) that can be utilized as indicators of thymic function and numbers of newly emigrating T-cells. Given data suggesting that stress affects thymus function, we examined whether blood levels of TRECs might serve as a quantitative peripheral index of cumulative stress exposure and its physiological correlates. We hypothesized that chronic stress exposure would compromise thymus function and produce corresponding decreases in levels of TRECs. In male mice, exposure to chronic social defeat stress (CSDS) produced thymic involution, adrenal hypertrophy, and decreased levels of TRECs in blood. Extending these studies to humans revealed robust inverse correlations between levels of circulating TRECs and childhood emotional and physical abuse. Cell-type specific analyses also revealed associations between TREC levels and blood cell composition, as well as cell-type specific methylation changes in CD4T + and CD8T + cells. Additionally, TREC levels correlated with epigenetic age acceleration, a common biomarker of stress exposure. Our findings demonstrate alignment between findings in mice and humans and suggest that blood-borne TRECs are a translationally-relevant biomarker that correlates with, and provides insight into, the cumulative physiological and immune-related impacts of stress exposure in mammals.
© 2022. The Author(s).
Conflict of interest statement
The authors declare no competing interests.
Figures


Similar articles
-
Cellular calibrators to quantitate T-cell receptor excision circles (TRECs) in clinical samples.Mol Genet Metab. 2012 Nov;107(3):586-91. doi: 10.1016/j.ymgme.2012.09.018. Epub 2012 Sep 21. Mol Genet Metab. 2012. PMID: 23062576 Free PMC article.
-
Simultaneous quantification of T-cell receptor excision circles (TRECs) and K-deleting recombination excision circles (KRECs) by real-time PCR.J Vis Exp. 2014 Dec 6;(94):52184. doi: 10.3791/52184. J Vis Exp. 2014. PMID: 25549107 Free PMC article.
-
Trends in TREC values according to age and gender in Chinese children and their clinical applications.Eur J Pediatr. 2022 Feb;181(2):529-538. doi: 10.1007/s00431-021-04223-8. Epub 2021 Aug 17. Eur J Pediatr. 2022. PMID: 34405301
-
T cell receptor excision circles as markers for recent thymic emigrants: basic aspects, technical approach, and guidelines for interpretation.J Mol Med (Berl). 2001 Nov;79(11):631-40. doi: 10.1007/s001090100271. J Mol Med (Berl). 2001. PMID: 11715066 Review.
-
Estimating thymic function through quantification of T-cell receptor excision circles.Methods Mol Biol. 2007;380:197-213. doi: 10.1007/978-1-59745-395-0_12. Methods Mol Biol. 2007. PMID: 17876095 Review.
Cited by
-
Early life stress in male mice blunts responsiveness in a translationally-relevant reward task.Neuropsychopharmacology. 2023 Nov;48(12):1752-1759. doi: 10.1038/s41386-023-01610-7. Epub 2023 May 31. Neuropsychopharmacology. 2023. PMID: 37258714 Free PMC article.
-
Immunophenotypes in psychosis: is it a premature inflamm-aging disorder?Mol Psychiatry. 2024 Sep;29(9):2834-2848. doi: 10.1038/s41380-024-02539-z. Epub 2024 Mar 26. Mol Psychiatry. 2024. PMID: 38532012 Free PMC article. Review.
-
Premature thymic functional senescence is a hallmark of childhood acute lymphoblastic leukemia survivorship.Blood Cancer J. 2024 Jun 13;14(1):96. doi: 10.1038/s41408-024-01071-1. Blood Cancer J. 2024. PMID: 38871704 Free PMC article.
-
Importance of TREC and KREC as molecular markers for immunological evaluation of down syndrome children.Sci Rep. 2023 Sep 18;13(1):15445. doi: 10.1038/s41598-023-42370-0. Sci Rep. 2023. PMID: 37723211 Free PMC article.
References
-
- Blom B, Verschuren MCM, Heemskerk MHM, Bakker AQ, van Gastel-Mol EJ, Wolvers-Tettero ILM, et al. TCR gene rearrangements and expression of the pre-T cell receptor complex during human T-cell differentiation. Blood J Am Soc Hematol. 1999;93:3033–43. - PubMed
Publication types
MeSH terms
Substances
Grants and funding
LinkOut - more resources
Full Text Sources

