. 2022 Sep 13:(187):10.3791/64363.
doi: 10.3791/64363.

Super-Resolution Microscopy of the Synaptonemal Complex within the Caenorhabditis elegans Germline

Affiliations

Super-Resolution Microscopy of the Synaptonemal Complex within the Caenorhabditis elegans Germline

Ivana Čavka et al. J Vis Exp. .

Abstract

During meiosis, homologous chromosomes must recognize and adhere to one another to allow for their correct segregation. One of the key events that secures the interaction of homologous chromosomes is the assembly of the synaptonemal complex (SC) in meiotic prophase I. Even though there is little sequence homology between protein components within the SC among different species, the general structure of the SC has been highly conserved during evolution. In electron micrographs, the SC appears as a tripartite, ladder-like structure composed of lateral elements or axes, transverse filaments, and a central element. However, precisely identifying the localization of individual components within the complex by electron microscopy to determine the molecular structure of the SC remains challenging. By contrast, fluorescence microscopy allows for the identification of individual protein components within the complex. However, since the SC is only ~100 nm wide, its substructure cannot be resolved by diffraction-limited conventional fluorescence microscopy. Thus, determining the molecular architecture of the SC requires super-resolution light microscopy techniques such as structured illumination microscopy (SIM), stimulated-emission depletion (STED) microscopy, or single-molecule localization microscopy (SMLM). To maintain the structure and interactions of individual components within the SC, it is important to observe the complex in an environment that is close to its native environment in the germ cells. Therefore, we demonstrate an immunohistochemistry and imaging protocol that enables the study of the substructure of the SC in intact, extruded Caenorhabditis elegans germline tissue with SMLM and STED microscopy. Directly fixing the tissue to the coverslip reduces the movement of the samples during imaging and minimizes aberrations in the sample to achieve the high resolution necessary to visualize the substructure of the SC in its biological context.


Conflict of interest statement

Disclosures

Authors declare no conflicts of interest.

Figures

Figure 1
Figure 1. Schematic of the organization of the synaptonemal complex in Caenorhabditis elegans.
The cartoon shows a simplified structure of the SC in C. elegans bridging two homologous chromosomes (gray). The structure is shown in frontal, lateral, and cross-sectional views. Chromosome axes are displayed as red bars while transverse filaments are shown in cyan. Transverse filament proteins (SYP-1, 5, 6 in C. elegans) are oriented in a head-to-head manner (cyan ball-stick graphics) in the central region to bridge the distance between the two axes. The expected distances between axes and the C-termini of transverse filaments are indicated. Abbreviation: SC = synaptonemal complex. Please click here to view a largerversion of this figure.
Figure 2
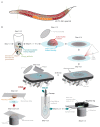
Figure 2. Illustration of the sample preparation used in the study.
(A) Young C. elegans adults are dissected at their head or tail (green, dashed lines) and processed as described in the protocol. (B) Individual steps of the method are indicated with graphics that are connected with gray arrows. Abbreviations: STED = stimulated-emission depletion; SMLM = single-molecule localization microscopy; PBS = phosphate-buffered saline. Please click here to view a larger version of this figure.
Figure 3
Figure 3. Location of the tissue section that can be observed by single molecule localization microscopy.
MIP of a spinning disk confocal image of a whole mount C. elegans gonad. The tissue was stained for HTP-3 and the C-terminus of SYP-5 (SYP-5::HA), and the combined signal is shown in gray. Individual confocal images were stitched using the Grid/Collection stitching Fiji plugin to create an image of the whole gonad. The inset shows an xy view of the bottommost z-plane containing the SCs. The localization of this plane is shown in orthogonal views of the tissue section indicated by a rectangle in the MIP image of the gonad (yellow lines). Scale bars = 10 μm. Abbreviations: MIP = maximum intensity projection; SCs = synaptonemal complexes. Please click here to view a larger version of this figure.
Figure 4
Figure 4. Single-molecule localization microscopy of HTP-3 and the C-termini of the SYP-5.
(A,B) Left: SMLM images showing pachytene nuclei stained for HTP-3 (red) and the C-terminus of SYP-5 (SYP-5::HA, cyan) (scale bar = 1 μm). Center: Zoomed-in images of regions of interest that are indicated in A and B with corresponding cross-sectional views displayed below each image (i, ii; scale bar = 100 nm). The stretches of the SC within zoomed-in images are rotated to orient the chromosome axes parallel to the y-axis. Right: Graphical representation of the localization of the proteins of interest within the SC portraying the orientation of the SC in the zoomed-in regions displayed in the center of the figure. Abbreviations: SMLM = single-molecule localization microscopy; SC = synaptonemal complex. Raw data to reconstruct SMLM images are available through the BioStudies database (Accession ID: S-BIAD504). Please click here to view alarger version of this figure.
Figure 5
Figure 5. The Fourier ring correlation resolution of single-molecule localization microscopy images depends on the distance of the imaged z-plane from the plane of the coverslip.
Colored lines show FRC curves of images acquired at different distances (as depicted by the color bar) from the coverslip. The 1/7 threshold used to determine the FRC resolution is indicated by a black horizontal line. Insets show the dependence of the FRC resolution on the piezo distance from the coverslip. Plotting was performed by a custom-written R script (version 4.1.2, Supplementary File 1) in which original curves were smoothed with functions from the "ggplot2" package. Abbreviations: FRC = Fourier ring correlation; SMLM = single-molecule localization microscopy; SC = synaptonemal complex. Data for FRC curves and SMLM data are available through the BioStudies database (Accession ID: S-BIAD504). Please click here to view a larger version of this figure.
Figure 6
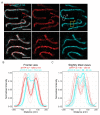
Figure 6. Stimulated emission depletion microscopy enhanced by fluorescence lifetime-based information (TauSTED) resolves two localization bands for both HTP-3 and the C-terminus of SYP-5.
(A) Two representative TauSTED images show pachytene nuclei stained for HTP-3 (red) and the C-terminus of SYP-5 (SYP-5::HA, cyan) with higher (top) and lower (bottom) structural definition (scale bar = 1 μm). The rectangles mark regions with the resolved C-termini of SYP-5 in frontal (white) and a slightly tilted view (yellow) of the SC. (B,C) Distribution of the HTP-3 (red) and the C-terminus of SYP-5 (cyan) signal resolved by TauSTED. Line profiles of regions of interest that contain the SC in frontal (B) or slightly tilted (C) views are shown as full lines with intensity normalized to the maximum value. Line profiles were generated using Fiji ImageJ. Dashed lines in B show the averaged data for each protein. The thick cyan line in C corresponds to the line profile with the shortest resolved distance between the C-termini of SYP-5. To determine the distances between the antibodies targeting specific proteins, the line profiles (n = 9 (B), n = 7 (C)) were fitted with double gaussians using a custom-written R script (version 4.1.2, Supplementary File 1). Mean distance ± standard deviation (B) and the range with minimum value highlighted in bold (C) are indicated on top of each graph, respectively. Abbreviations: STED = stimulated emission depletion microscopy; SC = synaptonemal complex. Displayed images and data points of plotted line profiles are available through the BioStudies database (Accession ID: S-BIAD504). Please click here to view a larger version of this figure.

Similar articles

Cited by

References

    1. Zickler D, Kleckner N. Meiotic chromosomes: integrating structure and function. Annual Review of Genetics. 1999;33:603–754. - PubMed
    1. Ur SN, Corbett KD. Architecture and dynamics of meiotic chromosomes. Annual Review of Genetics. 2021;55:497–526. - PubMed
    1. Fawcett DW. The fine structure ot chromosomes in the meiotic prophase of vertebrate spermatocytes. The Journal of Biophysical and Biochemical Cytology. 1956;2(4):403–406. - PMC - PubMed
    1. Moses MJ. Chromosomal structures in crayfish spermatocytes. The Journal of Biophysical and Biochemical Cytology. 1956;2(2):215–218. - PMC - PubMed
    1. Hillers KJ, Jantsch V, Martinez-Perez E, Yanowitz JL. Meiosis. WormBook. 2017:433–434. - PMC - PubMed

Publication types

LinkOut - more resources