IFI44 is an immune evasion biomarker for SARS-CoV-2 and Staphylococcus aureus infection in patients with RA
- PMID: 36189314
- PMCID: PMC9520788
- DOI: 10.3389/fimmu.2022.1013322
IFI44 is an immune evasion biomarker for SARS-CoV-2 and Staphylococcus aureus infection in patients with RA
Abstract
Background: Severe acute respiratory syndrome coronavirus 2 (SARS-CoV-2) caused a global pandemic of severe coronavirus disease 2019 (COVID-19). Staphylococcus aureus is one of the most common pathogenic bacteria in humans, rheumatoid arthritis (RA) is among the most prevalent autoimmune conditions. RA is a significant risk factor for SARS-CoV-2 and S. aureus infections, although the mechanism of RA and SARS-CoV-2 infection in conjunction with S. aureus infection has not been elucidated. The purpose of this study is to investigate the biomarkers and disease targets between RA and SARS-CoV-2 and S. aureus infections using bioinformatics analysis, to search for the molecular mechanisms of SARS-CoV-2 and S. aureus immune escape and potential drug targets in the RA population, and to provide new directions for further analysis and targeted development of clinical treatments.
Methods: The RA dataset (GSE93272) and the S. aureus bacteremia (SAB) dataset (GSE33341) were used to obtain differentially expressed gene sets, respectively, and the common differentially expressed genes (DEGs) were determined through the intersection. Functional enrichment analysis utilizing GO, KEGG, and ClueGO methods. The PPI network was created utilizing the STRING database, and the top 10 hub genes were identified and further examined for functional enrichment using Metascape and GeneMANIA. The top 10 hub genes were intersected with the SARS-CoV-2 gene pool to identify five hub genes shared by RA, COVID-19, and SAB, and functional enrichment analysis was conducted using Metascape and GeneMANIA. Using the NetworkAnalyst platform, TF-hub gene and miRNA-hub gene networks were built for these five hub genes. The hub gene was verified utilizing GSE17755, GSE55235, and GSE13670, and its effectiveness was assessed utilizing ROC curves. CIBERSORT was applied to examine immune cell infiltration and the link between the hub gene and immune cells.
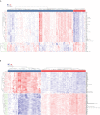
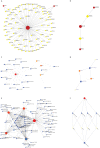
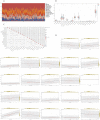
Results: A total of 199 DEGs were extracted from the GSE93272 and GSE33341 datasets. KEGG analysis of enrichment pathways were NLR signaling pathway, cell membrane DNA sensing pathway, oxidative phosphorylation, and viral infection. Positive/negative regulation of the immune system, regulation of the interferon-I (IFN-I; IFN-α/β) pathway, and associated pathways of the immunological response to viruses were enriched in GO and ClueGO analyses. PPI network and Cytoscape platform identified the top 10 hub genes: RSAD2, IFIT3, GBP1, RTP4, IFI44, OAS1, IFI44L, ISG15, HERC5, and IFIT5. The pathways are mainly enriched in response to viral and bacterial infection, IFN signaling, and 1,25-dihydroxy vitamin D3. IFI44, OAS1, IFI44L, ISG15, and HERC5 are the five hub genes shared by RA, COVID-19, and SAB. The pathways are primarily enriched for response to viral and bacterial infections. The TF-hub gene network and miRNA-hub gene network identified YY1 as a key TF and hsa-mir-1-3p and hsa-mir-146a-5p as two important miRNAs related to IFI44. IFI44 was identified as a hub gene by validating GSE17755, GSE55235, and GSE13670. Immune cell infiltration analysis showed a strong positive correlation between activated dendritic cells and IFI44 expression.
Conclusions: IFI144 was discovered as a shared biomarker and disease target for RA, COVID-19, and SAB by this study. IFI44 negatively regulates the IFN signaling pathway to promote viral replication and bacterial proliferation and is an important molecular target for SARS-CoV-2 and S. aureus immune escape in RA. Dendritic cells play an important role in this process. 1,25-Dihydroxy vitamin D3 may be an important therapeutic agent in treating RA with SARS-CoV-2 and S. aureus infections.
Keywords: 1,25-dihydroxy vitamin D3; COVID-19; IFI44; Rheumatoid arthritis; SARS-CoV-2; Staphylococcus aureus; dendritic cells.
Copyright © 2022 Zheng, Wang, Lin, Lv and Wang.
Conflict of interest statement
The authors declare that the research was conducted in the absence of any commercial or financial relationships that could be construed as a potential conflict of interest.
Figures


Similar articles
-
Discovering common pathogenetic processes between COVID-19 and tuberculosis by bioinformatics and system biology approach.Front Cell Infect Microbiol. 2023 Dec 15;13:1280223. doi: 10.3389/fcimb.2023.1280223. eCollection 2023. Front Cell Infect Microbiol. 2023. PMID: 38162574 Free PMC article.
-
SARS-CoV-2 induces "cytokine storm" hyperinflammatory responses in RA patients through pyroptosis.Front Immunol. 2022 Dec 1;13:1058884. doi: 10.3389/fimmu.2022.1058884. eCollection 2022. Front Immunol. 2022. PMID: 36532040 Free PMC article.
-
Bioinformatics and system biology approach to identify the influences among COVID-19, influenza, and HIV on the regulation of gene expression.Front Immunol. 2024 Mar 27;15:1369311. doi: 10.3389/fimmu.2024.1369311. eCollection 2024. Front Immunol. 2024. PMID: 38601162 Free PMC article.
-
Circulating microRNAs as emerging regulators of COVID-19.Theranostics. 2023 Jan 1;13(1):125-147. doi: 10.7150/thno.78164. eCollection 2023. Theranostics. 2023. PMID: 36593971 Free PMC article. Review.
-
The role of microRNAs in solving COVID-19 puzzle from infection to therapeutics: A mini-review.Virus Res. 2022 Jan 15;308:198631. doi: 10.1016/j.virusres.2021.198631. Epub 2021 Nov 14. Virus Res. 2022. PMID: 34788642 Free PMC article. Review.
Cited by
-
Discovering common pathogenetic processes between COVID-19 and tuberculosis by bioinformatics and system biology approach.Front Cell Infect Microbiol. 2023 Dec 15;13:1280223. doi: 10.3389/fcimb.2023.1280223. eCollection 2023. Front Cell Infect Microbiol. 2023. PMID: 38162574 Free PMC article.
-
Crucial Roles of RSAD2/viperin in Immunomodulation, Mitochondrial Metabolism and Autoimmune Diseases.Inflammation. 2024 Jun 23. doi: 10.1007/s10753-024-02076-5. Online ahead of print. Inflammation. 2024. PMID: 38909344 Review.
-
Effects of GHR Deficiency and Juvenile Hypoglycemia on Immune Cells of a Porcine Model for Laron Syndrome.Biomolecules. 2023 Mar 26;13(4):597. doi: 10.3390/biom13040597. Biomolecules. 2023. PMID: 37189345 Free PMC article.
-
Comparison of antiviral responses in two bat species reveals conserved and divergent innate immune pathways.iScience. 2023 Jul 20;26(8):107435. doi: 10.1016/j.isci.2023.107435. eCollection 2023 Aug 18. iScience. 2023. PMID: 37575178 Free PMC article.
-
Discovery of Potential Drug Targeting Key Genes in Alzheimer's Disease: Insights from Transcriptome Analysis and Molecular Docking.J Mol Neurosci. 2024 May 27;74(2):56. doi: 10.1007/s12031-024-02208-4. J Mol Neurosci. 2024. PMID: 38802701
References
MeSH terms
Substances
LinkOut - more resources
Full Text Sources
Medical
Molecular Biology Databases
Miscellaneous

