Hsa_hsa_circ_0081069 promotes the progression of colorectal cancer through sponging miR-665 and regulating E2F3 expression
- PMID: 36181281
- PMCID: PMC9701882
- DOI: 10.1002/jcla.24710
Hsa_hsa_circ_0081069 promotes the progression of colorectal cancer through sponging miR-665 and regulating E2F3 expression
Abstract
Background: Circular RNAs (circRNAs) have been implicated in the initiation and development of various cancers. This study explored the potential contribution of hsa_hsa_circ_0081069 in the progression of colorectal cancer (CRC).
Methods: The gene expression was analyzed by qRT-PCR. Functional roles of hsa_circ_0081069 were examined by shRNA-mediated silencing using CCK-8 proliferation assay, Transwell migration and invasion assay, tube formation assay. The tumorigenesis and metastasis of CRC cells were assess in a xenograft mouse model.
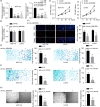
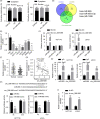
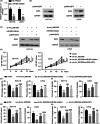
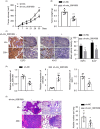
Results: Hsa_circ_0081069 was significantly upregulated in CRC tissues and cells. Hsa_circ_0081069 knockdown suppressed the proliferation, migration and invasion in CRC cells, as well as the angiogenesis. Silencing hsa_circ_0081069 also impaired the tumorigenesis of CRC cells in a xenograft mouse model. Furthermore, miR-665 was identified as an interacting partner of hsa_circ_0081069, which was negatively regulated by hsa_circ_0081069. miR-665 targeted the mRNA of E2F3 to suppress its expression. We further demonsatred that miR-665/E2F3 axis mediated the functional role of hsa_circ_0081069 in regulating the malignant phenotype of CRC cells.
Conclusions: Collectively, our study suggests that hsa_circ_0081069 could serve as a prognostic marker in progression of CRC. Targeting hsa_circ_0081069 and miR-665/E2F3 axis could serve as potential therapeutic strategies for CRC treatment.
Keywords: E2F3; Hsa_circ_0081069; MiR-665; colorectal cancer; progression.
© 2022 The Authors. Journal of Clinical Laboratory Analysis published by Wiley Periodicals LLC.
Conflict of interest statement
The authors declare that they have no conflict of interest.
Figures


Similar articles
-
Hsa_circ_0008934 promotes the proliferation and migration of osteosarcoma cells by targeting miR-145-5p to enhance E2F3 expression.Int J Biochem Cell Biol. 2020 Oct;127:105826. doi: 10.1016/j.biocel.2020.105826. Epub 2020 Aug 18. Int J Biochem Cell Biol. 2020. PMID: 32822848
-
Circular RNA hsa_circ_0008039 promotes breast cancer cell proliferation and migration by regulating miR-432-5p/E2F3 axis.Biochem Biophys Res Commun. 2018 Jul 20;502(3):358-363. doi: 10.1016/j.bbrc.2018.05.166. Epub 2018 May 31. Biochem Biophys Res Commun. 2018. PMID: 29807010
-
Hsa_circ_0071589 promotes carcinogenesis via the miR-600/EZH2 axis in colorectal cancer.Biomed Pharmacother. 2018 Jun;102:1188-1194. doi: 10.1016/j.biopha.2018.03.085. Epub 2018 Apr 10. Biomed Pharmacother. 2018. PMID: 29710537
-
Hsa_circ_0000231 knockdown inhibits the glycolysis and progression of colorectal cancer cells by regulating miR-502-5p/MYO6 axis.World J Surg Oncol. 2020 Sep 29;18(1):255. doi: 10.1186/s12957-020-02033-0. World J Surg Oncol. 2020. PMID: 32993655 Free PMC article.
-
Hsa_circ_0005100 regulates tumorigenicity of colorectal carcinoma via miR-145-5p/MACC1 axis.J Clin Lab Anal. 2022 Aug;36(8):e24533. doi: 10.1002/jcla.24533. Epub 2022 Jun 29. J Clin Lab Anal. 2022. PMID: 35766445 Free PMC article.
Cited by
-
Exosomal circSIPA1L3-mediated intercellular communication contributes to glucose metabolic reprogramming and progression of triple negative breast cancer.Mol Cancer. 2024 Jun 8;23(1):125. doi: 10.1186/s12943-024-02037-4. Mol Cancer. 2024. PMID: 38849860 Free PMC article.
-
Biological functions, mechanisms, and clinical significance of circular RNA in colorectal cancer.Front Oncol. 2023 Mar 6;13:1138481. doi: 10.3389/fonc.2023.1138481. eCollection 2023. Front Oncol. 2023. PMID: 36950552 Free PMC article. Review.
References
-
- Callens C, De Cauwer H, Viaene M, Vanneste D, Eyben A, Coeman D. Sarcoidosis‐like disease with pulmonary infestation, meningoencephalitis and transverse myelitis after sigmoid cancer treatment. Acta Gastroenterol Belg. 2021;84(4):672‐674. - PubMed
-
- Włodarczyk J, Płoska M, Płoski K, Fichna J. The role of short‐chain fatty acids in inflammatory bowel diseases and colorectal cancer. Postepy Biochem. 2021;67(3):223‐230. - PubMed
MeSH terms
Substances
LinkOut - more resources
Full Text Sources
Medical

