

Computational multiplex panel reduction to maximize information retention in breast cancer tissue microarrays
- PMID: 36178966
- PMCID: PMC9555662
- DOI: 10.1371/journal.pcbi.1010505
Computational multiplex panel reduction to maximize information retention in breast cancer tissue microarrays
Abstract
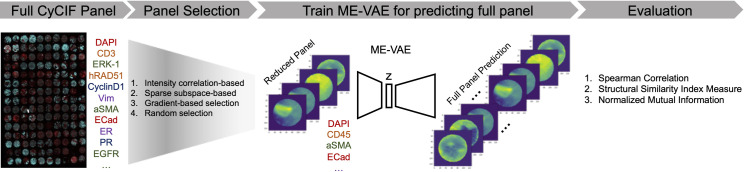
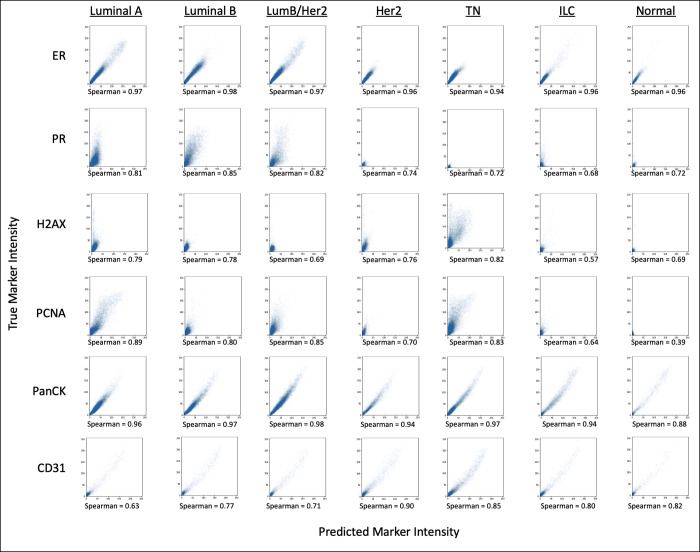
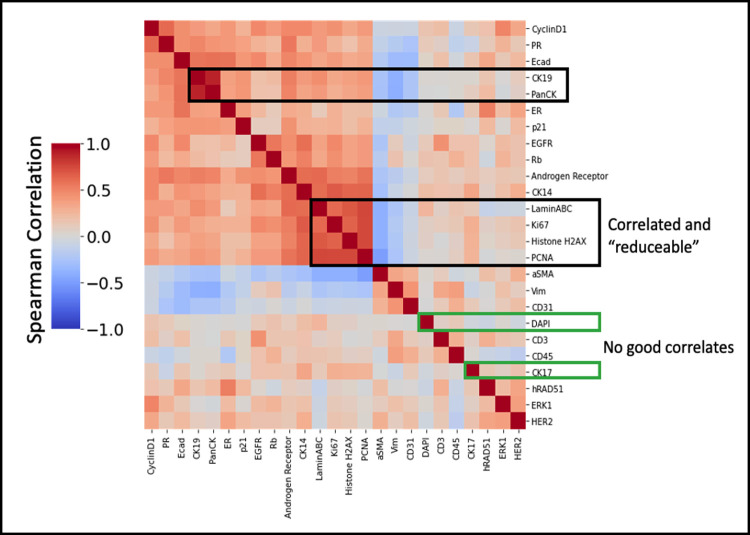
Recent state-of-the-art multiplex imaging techniques have expanded the depth of information that can be captured within a single tissue sample by allowing for panels with dozens of markers. Despite this increase in capacity, space on the panel is still limited due to technical artifacts, tissue loss, and long imaging acquisition time. As such, selecting which markers to include on a panel is important, since removing important markers will result in a loss of biologically relevant information, but identifying redundant markers will provide a room for other markers. To address this, we propose computational approaches to determine the amount of shared information between markers and select an optimally reduced panel that captures maximum amount of information with the fewest markers. Here we examine several panel selection approaches and evaluate them based on their ability to reconstruct the full panel images and information within breast cancer tissue microarray datasets using cyclic immunofluorescence as a proof of concept. We show that all methods perform adequately and can re-capture cell types using only 18 of 25 markers (72% of the original panel size). The correlation-based selection methods achieved the best single-cell marker mean intensity predictions with a Spearman correlation of 0.90 with the reduced panel. Using the proposed methods shown here, it is possible for researchers to design more efficient multiplex imaging panels that maximize the amount of information retained with the limited number of markers with respect to certain evaluation metrics and architecture biases.
Conflict of interest statement
I have read the journal’s policy and the authors of this manuscript have the following competing interests: L.T., J.R.L., Y.C and Y.H.C have no competing interests. J.W.G has licensed technologies to Abbott Diagnostics; has ownership positions in Convergent Genomics, Health Technology Innovations, Zorro Bio, and PDX Pharmaceuticals; serves as a paid consultant to New Leaf Ventures; has received research support from Thermo Fisher Scientific (formerly FEI), Zeiss, Miltenyi Biotech, Quantitative Imaging, Health Technology Innovations, and Micron Technologies.
Figures


Similar articles
-
Folic acid supplementation and malaria susceptibility and severity among people taking antifolate antimalarial drugs in endemic areas.Cochrane Database Syst Rev. 2022 Feb 1;2(2022):CD014217. doi: 10.1002/14651858.CD014217. Cochrane Database Syst Rev. 2022. PMID: 36321557 Free PMC article.
-
An integrative view on breast cancer signature panels.Expert Rev Mol Diagn. 2019 Aug;19(8):715-724. doi: 10.1080/14737159.2019.1642751. Epub 2019 Jul 18. Expert Rev Mol Diagn. 2019. PMID: 31295415 Review.
-
Characterizing the Tumor Immune Microenvironment with Tyramide-Based Multiplex Immunofluorescence.J Mammary Gland Biol Neoplasia. 2020 Dec;25(4):417-432. doi: 10.1007/s10911-021-09479-2. Epub 2021 Feb 15. J Mammary Gland Biol Neoplasia. 2020. PMID: 33590360 Free PMC article.
-
Systematic antibody generation and validation via tissue microarray technology leading to identification of a novel protein prognostic panel in breast cancer.BMC Cancer. 2013 Apr 2;13:175. doi: 10.1186/1471-2407-13-175. BMC Cancer. 2013. PMID: 23547718 Free PMC article.
-
Translational Metabolomics of Head Injury: Exploring Dysfunctional Cerebral Metabolism with Ex Vivo NMR Spectroscopy-Based Metabolite Quantification.In: Kobeissy FH, editor. Brain Neurotrauma: Molecular, Neuropsychological, and Rehabilitation Aspects. Boca Raton (FL): CRC Press/Taylor & Francis; 2015. Chapter 25. In: Kobeissy FH, editor. Brain Neurotrauma: Molecular, Neuropsychological, and Rehabilitation Aspects. Boca Raton (FL): CRC Press/Taylor & Francis; 2015. Chapter 25. PMID: 26269925 Free Books & Documents. Review.
Cited by
-
Expanding the coverage of spatial proteomics: a machine learning approach.Bioinformatics. 2024 Feb 1;40(2):btae062. doi: 10.1093/bioinformatics/btae062. Bioinformatics. 2024. PMID: 38310340 Free PMC article.
-
3D multiplexed tissue imaging reconstruction and optimized region of interest (ROI) selection through deep learning model of channels embedding.Front Bioinform. 2023 Oct 19;3:1275402. doi: 10.3389/fbinf.2023.1275402. eCollection 2023. Front Bioinform. 2023. PMID: 37928169 Free PMC article.
-
MIM-CyCIF: masked imaging modeling for enhancing cyclic immunofluorescence (CyCIF) with panel reduction and imputation.Commun Biol. 2024 Apr 3;7(1):409. doi: 10.1038/s42003-024-06110-y. Commun Biol. 2024. PMID: 38570598 Free PMC article.
-
Dual-modality imaging of immunofluorescence and imaging mass cytometry for whole-slide imaging and accurate segmentation.Cell Rep Methods. 2023 Oct 23;3(10):100595. doi: 10.1016/j.crmeth.2023.100595. Epub 2023 Sep 22. Cell Rep Methods. 2023. PMID: 37741277 Free PMC article.
-
Dual-modality imaging of immunofluorescence and imaging mass cytometry for whole slide imaging with accurate single-cell segmentation.bioRxiv [Preprint]. 2023 Feb 23:2023.02.23.529718. doi: 10.1101/2023.02.23.529718. bioRxiv. 2023. Update in: Cell Rep Methods. 2023 Oct 23;3(10):100595. doi: 10.1016/j.crmeth.2023.100595 PMID: 36865274 Free PMC article. Updated. Preprint.
References
Publication types
MeSH terms
Substances
Grants and funding
LinkOut - more resources
Full Text Sources
Medical
Research Materials
