. 2022 Oct 15;135(20):jcs250134.
doi: 10.1242/jcs.250134. Epub 2022 Oct 20.

Non-autonomous cell death induced by the Draper phagocytosis receptor requires signaling through the JNK and SRC pathways

Affiliations

Non-autonomous cell death induced by the Draper phagocytosis receptor requires signaling through the JNK and SRC pathways

Sandy B Serizier et al. J Cell Sci. .

Abstract

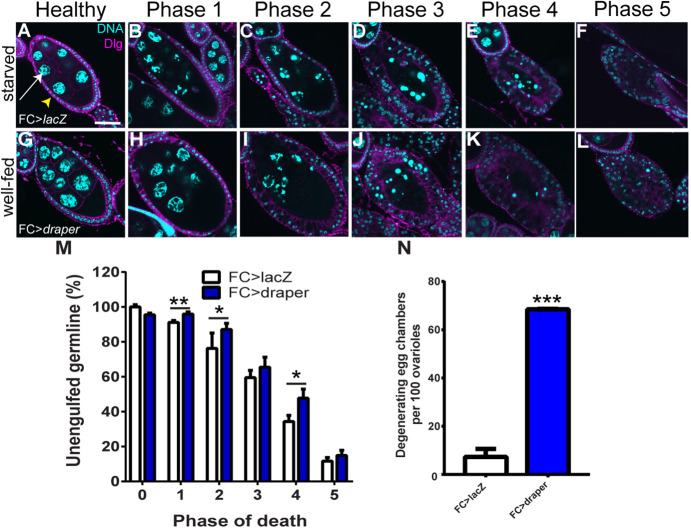
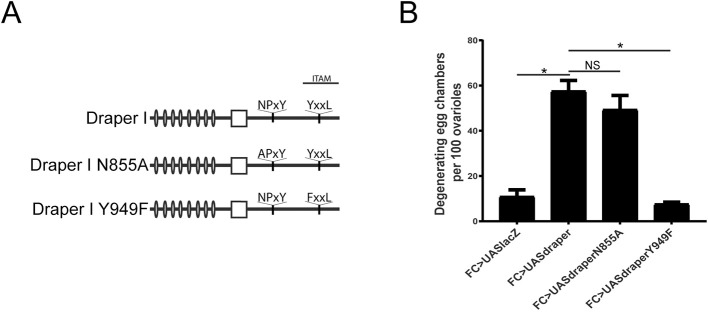
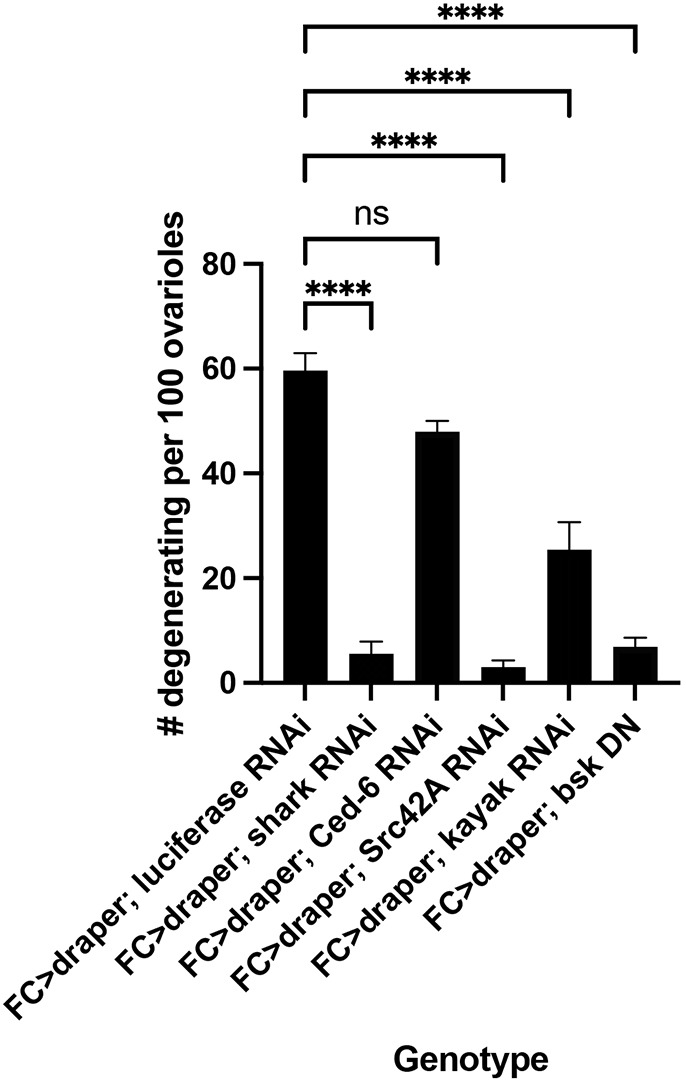
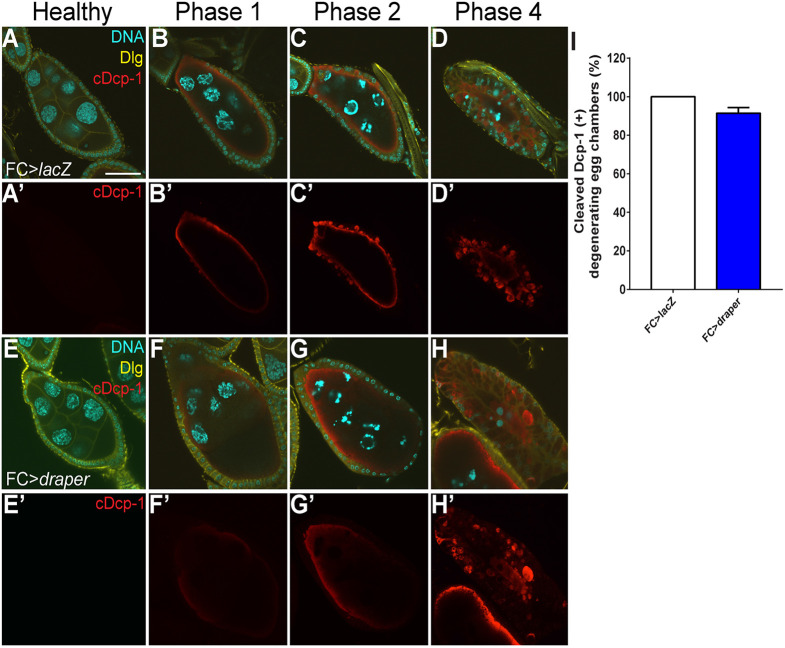
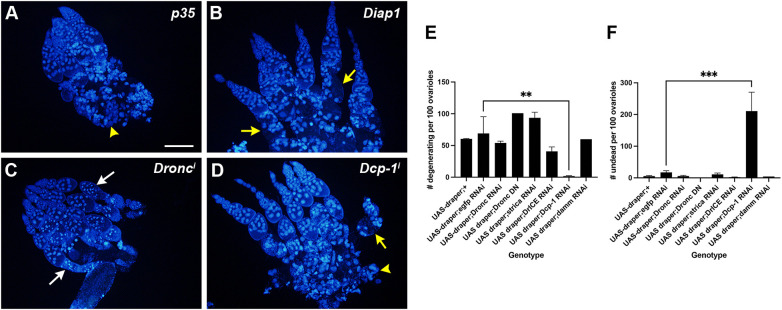
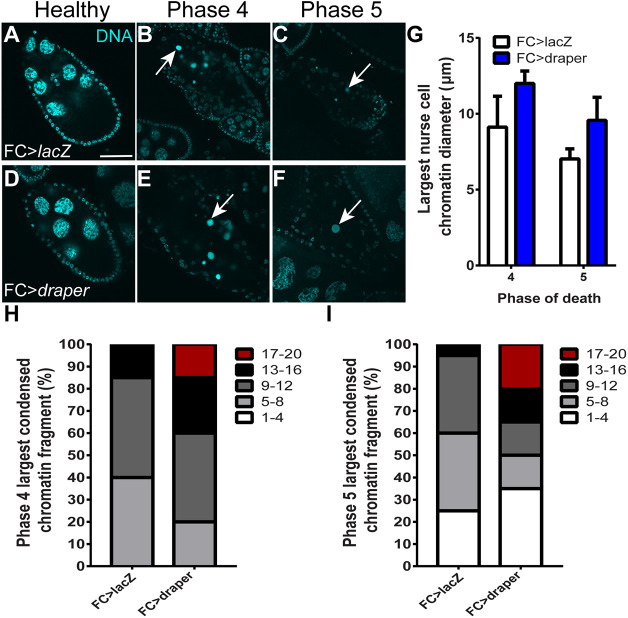
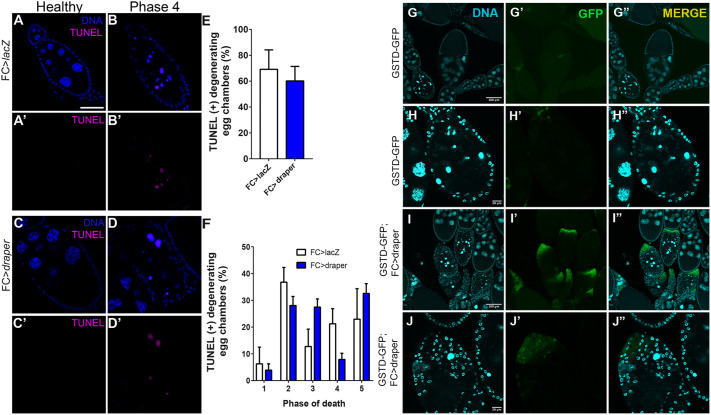
The last step of cell death is cell clearance, a process critical for tissue homeostasis. For efficient cell clearance to occur, phagocytes and dead cells need to reciprocally signal to each other. One important phenomenon that is under-investigated, however, is that phagocytes not only engulf corpses but contribute to cell death progression. The aims of this study were to determine how the phagocytic receptor Draper non-autonomously induces cell death, using the Drosophila ovary as a model system. We found that Draper, expressed in epithelial follicle cells, requires its intracellular signaling domain to kill the adjacent nurse cell population. Kinases Src42A, Shark and JNK (Bsk) were required for Draper-induced nurse cell death. Signs of nurse cell death occurred prior to apparent engulfment and required the caspase Dcp-1, indicating that it uses a similar apoptotic pathway to starvation-induced cell death. These findings indicate that active signaling by Draper is required to kill nurse cells via the caspase Dcp-1, providing novel insights into mechanisms of phagoptosis driven by non-professional phagocytes.

Keywords: Drosophila; Cell death; Draper; Ovary; Phagocyte; Phagoptosis.


Conflict of interest statement

Competing interests The authors declare no competing or financial interests.

Figures

Fig. 1.
Fig. 1.
Draper induces nurse cell death independently of starvation. (A,G) Healthy and (B–F,H–L) progressively dying egg chambers expressing UAS-lacZ or UAS-draper in follicle cells with GR1-GAL4 (indicated as FC>). The control lacZ group was starved to induce egg chamber degeneration. Egg chambers are labeled with DAPI (blue) to visualize DNA and anti-Discs large (Dlg, purple) to visualize membranes. As the germ cells (white arrow) die (visualized by condensed and/or fragmented nurse cell nuclei), surrounding follicle cells (yellow arrowhead) enlarge and engulf dying germline material. Phases of death based on Etchegaray et al., 2012. Scale bar: 50 μm. (M) Bar graph of mean±s.e.m. unengulfed germline in control lacZ starved (white bar) and well-fed draper-overexpressing (blue bar) follicle cells. Healthy control egg chambers were normalized to 100; 20 egg chambers were scored for each phase and genotype. (N) Quantification (mean±s.e.m.) of degenerating egg chambers from flies expressing draper or lacZ control in follicle cells with GR1-GAL4 in well-fed flies. At least 123 ovarioles were scored for each replicate. *P<0.05, **P<0.01, ***P<0.005 (unpaired two-tailed t-test).
Fig. 2.
Fig. 2.
Intracellular Draper signaling is required to kill nurse cells. (A) Diagram showing structure of the Draper I isoform and intracellular domain mutants. (B) Quantification (mean±s.e.m.) of degenerating egg chambers. Egg chambers were counted from well-fed flies of the indicated genotypes. At least 92 ovarioles were scored for each replicate. **P<0.01; ns, not significant (one-way ANOVA with Dunnet's post hoc test).
Fig. 3.
Fig. 3.
Draper activates Shark and JNK signaling to kill nurse cells. The number of degenerating egg chambers per 100 ovarioles as mean±s.e.m. for indicated RNAi or dominant-negative lines in a draper overexpression background with GR1-GAL4. At least 50 ovarioles were scored for each replicate. Src42A data are from two biological replicates. ****P<0.005 (one-way ANOVA with Dunnett's post hoc test).
Fig. 4.
Fig. 4.
Draper induces effector caspase Dcp-1 activation in the nurse cells. (A,E) Healthy and (B–H) degenerating stage 8–9 egg chambers expressing lacZ (control, A–D) or draper (E–H) in follicle cells with GR1-GAL4. Phases of death are according to Etchegaray et al., 2012. The lacZ control group was starved to induce egg chamber degeneration. Egg chambers are labeled with DAPI (blue) to visualize DNA, anti-Discs-large (Dlg, yellow) to visualize membranes, and cleaved Dcp-1 (cDcp-1, red) to visualize active Dcp-1. Cleaved effector caspase Dcp-1 is not detectable in healthy egg chambers but is present in dying egg chambers and persists until the end of engulfment. Scale bar: 50 μm. (I) Quantification (mean±s.e.m.) of degenerating egg chambers (as determined by chromatin changes) with active Dcp-1. 193 egg chambers were scored for the control group and 125 egg chambers were scored for draper.
Fig. 5.
Fig. 5.
Dcp-1 is required for Draper to kill nurse cells. (A–D) Ovarioles from the indicated genotypes stained with DAPI. All genotypes include one copy of UAS-Draper, GR1-GAL4 and nos-GAL4 along with the indicated construct. (A) UASp-p35, (B) UASp-Diap1, (C) VALIUM20 Dronc dsRNA, and (D) VALIUM20 Dcp-1 dsRNA. Undead egg chambers indicated with yellow arrows, normal degenerating egg chambers with white arrows, and loose nurse cell debris with yellow arrowheads. Scale bar: 200 μm. (E,F) Quantification (mean±s.e.m.) of ovarioles with degenerating or undead egg chambers. All genotypes include GR1-GAL4 and nos-GAL4. At least 52 ovarioles were scored for all replicates of indicated genotypes. Dronc-DN and Damm samples had one replicate each. **P<0.01, ***P<0.005 (one-way ANOVA with Dunnett's post hoc test). No lines except Dcp-1 showed statistically significant differences compared to the egfp dsRNA control.
Fig. 6.
Fig. 6.
draper overexpression egg chambers exhibit delayed chromatin breakdown. (A,D) Healthy and dying (B,E) phase 4, and (C,F) phase 5 egg chambers expressing lacZ or draper in follicle cells with GR1-GAL4. The lacZ control group was starved to induce egg chamber degeneration. Egg chambers are labeled with DAPI (blue) to visualize DNA. Arrows depict the largest condensed nurse cell chromatin fragment. Scale bar: 50 μm. (G) Quantification (mean±s.e.m.) of largest condensed chromatin fragment diameter in phase 4 and phase 5 lacZ and draper expressing follicle cells. There was no statistically significant difference between the averages as determined by unpaired two-tailed t-test. (H,I) Quantification of largest condensed chromatin fragments for phase 4 and 5 dying chambers (as 1–4, 5–8, 9–12, 13–16 or 17–20 µm in diameter); 20 egg chambers were scored for each phase of death.
Fig. 7.
Fig. 7.
Draper induces nurse cell DNA fragmentation and expression of GSTD–GFP. (A,C) Healthy and (B,D) phase 4 dying egg chambers expressing lacZ (control) or draper in follicle cells with GR1-GAL4. The control group was starved to induce egg chamber degeneration. Egg chambers are labeled with DAPI (blue) to visualize DNA and TUNEL (magenta) to visualize fragmented DNA. Upon death induction, nurse cell DNA fragments. (E) Quantification (mean±s.e.m.) of degenerating egg chambers that are positive for TUNEL. 86 dying egg chambers were scored for the control group and 169 for draper. (F) Quantification (mean±s.e.m.) of DNA fragmentation profile of healthy and dying egg chambers. For the control group, the number of degenerating egg chambers scored for phases 1–5 were n=12, 31, 15, 13, and 15, respectively. For draper, the number of degenerating egg chambers scored for phases 1–5 were n=10, 35, 34, 32, and 58, respectively. (G–J″) Egg chambers stained with DAPI expressing GSTD–GFP. (G–H″) Control egg chambers show GSTD–GFP expression in border cells (G′) but not in degenerating egg chambers (H′). (I–J″) Egg chambers expressing draper in follicle cells show activation in anterior follicle cells of degenerating egg chambers. Images in G-J are representative of five experiments/>30 flies per genotype. Scale bars: 50 μm (A); 100 µm (G,I); 20 µm (H,J).

Similar articles

Cited by

  • Cell death by phagocytosis.
    Brown GC. Brown GC. Nat Rev Immunol. 2024 Feb;24(2):91-102. doi: 10.1038/s41577-023-00921-6. Epub 2023 Aug 21. Nat Rev Immunol. 2024. PMID: 37604896 Review.
  • Activated Src kinase promotes cell cannibalism in Drosophila.
    Torres AY, Nano M, Campanale JP, Deak S, Montell DJ. Torres AY, et al. J Cell Biol. 2023 Nov 6;222(11):e202302076. doi: 10.1083/jcb.202302076. Epub 2023 Sep 25. J Cell Biol. 2023. PMID: 37747450 Free PMC article.

References

    1. Abdolmaleki, F., Farahani, N., Gheibi Hayat, S. M., Pirro, M., Bianconi, V., Barreto, G. E. and Sahebkar, A. (2018). The role of efferocytosis in autoimmune diseases. Front. Immunol. 9, 1645. 10.3389/fimmu.2018.01645 - DOI - PMC - PubMed
    1. Arandjelovic, S. and Ravichandran, K. S. (2015). Phagocytosis of apoptotic cells in homeostasis. Nat. Immunol. 16, 907-917. 10.1038/ni.3253 - DOI - PMC - PubMed
    1. Awasaki, T., Tatsumi, R., Takahashi, K., Arai, K., Nakanishi, Y., Ueda, R. and Ito, K. (2006). Essential role of the apoptotic cell engulfment genes draper and ced-6 in programmed axon pruning during Drosophila Metamorphosis. Neuron 50, 855-867. 10.1016/j.neuron.2006.04.027 - DOI - PubMed
    1. Baum, J. S., Arama, E., Steller, H. and McCall, K. (2007). The Drosophila caspases Strica and Dronc function redundantly in programmed cell death during oogenesis. Cell Death Differ. 14, 1508-1517. 10.1038/sj.cdd.4402155 - DOI - PubMed
    1. Brown, G. C. and Neher, J. J. (2012). Eaten alive! Cell death by primary phagocytosis: “Phagoptosis.” Trends Biochem. Sci. 37, 325-332. 10.1016/j.tibs.2012.05.002 - DOI - PubMed

Publication types