. 2022 Oct;28(10):2133-2144.
doi: 10.1038/s41591-022-02003-x. Epub 2022 Sep 29.

KIR-based inhibitory CARs overcome CAR-NK cell trogocytosis-mediated fratricide and tumor escape

Affiliations

KIR-based inhibitory CARs overcome CAR-NK cell trogocytosis-mediated fratricide and tumor escape

Ye Li et al. Nat Med. 2022 Oct.

Erratum in

Abstract

Trogocytosis is an active process that transfers surface material from targeted to effector cells. Using multiple in vivo tumor models and clinical data, we report that chimeric antigen receptor (CAR) activation in natural killer (NK) cells promoted transfer of the CAR cognate antigen from tumor to NK cells, resulting in (1) lower tumor antigen density, thus impairing the ability of CAR-NK cells to engage with their target, and (2) induced self-recognition and continuous CAR-mediated engagement, resulting in fratricide of trogocytic antigen-expressing NK cells (NKTROG+) and NK cell hyporesponsiveness. This phenomenon could be offset by a dual-CAR system incorporating both an activating CAR against the cognate tumor antigen and an NK self-recognizing inhibitory CAR that transferred a 'don't kill me' signal to NK cells upon engagement with their TROG+ siblings. This system prevented trogocytic antigen-mediated fratricide, while sparing activating CAR signaling against the tumor antigen, and resulted in enhanced CAR-NK cell activity.


Conflict of interest statement

Disclosure of Conflict of Interest

RB, EL, LNK, PPB, SA, DM, MD, REC, EJS, KR, and The University of Texas MD Anderson Cancer Center have an institutional financial conflict of interest with Takeda Pharmaceutical. SA, DM, RB, EL, LNK, EJS, KR, and The University of Texas MD Anderson Cancer Center have an institutional financial conflict of interest with Affimed GmbH. KR participates on the Scientific Advisory Board for GemoAb, AvengeBio, Virogin Biotech, GSK, Caribou Biosciences, Navan Technologies and Bayer. The remaining authors declare no competing financial interests.

Figures

Extended Data Fig. 1
Extended Data Fig. 1. CAR-mediated CD19 trogocytosis on NK cells in vitro.
(a) Gating strategy to distinguish NK cells and Raji cells in co-culture experiments. Expression of GFP/CD56/CAR was used to identify CAR-NK cells (GFPCD56+CAR+), Raji cells genetically modified to express GFP (CD19+GFP+CD56CAR), and CAR-NK/Raji doublets (CD19+GFP+CD56+CAR+). Expression of CD19 on CAR-NK cells after co-culture with Raji cells was compared to that of control CAR-NK cells cultured alone. Inset numbers indicate the percentage (%) of cells within the indicated gated regions. (b) Representative Amnis® images showing surface protein expression of CD56/CAR/CD19, and intracellular expression of F-actin/GFP in CAR-NK cells cultured alone, Raji cells cultured alone, or CAR-NK/Raji doublets (CAR-NK cell engaged with Raji cell). Cells were identified by DAPI nuclear stain; scale bar indicates 7 μm. Representative images show trogocytic CD19 (tCD19) expression on CAR-NK cells following engagement with Raji targets, as assessed by Amnis® imaging flow cytometry. Data are shown for singlet CAR-NK cells cultured alone (negative control), CAR-NK cells engaged with Raji cells (d: CAR-NK/Raji doublet), or singlet CAR-NK cells after 5 min co-culture with Raji cells. The geometric mean fluorescent intensity (gMFI) of CD19 was indicated for each condition (lower panels). Inserted image shows representative cells for each culture condition. (c) Amnis® imaging showing the % of tCD19 expression on singlet CD56+ CAR-NK cells cultured alone, CAR-NK cells engaged with Raji cells, or the tCD19+ fractions of singlet CAR-NK cells after 5 min co-culture with Raji cells (left); and % of co-localized tCD19 and CAR molecules on singlet NK cells (right; n=25 objects). (d) Flow cytometric analyses show expression of CD19/CD20/CD22 at the protein level (left) and the mRNA level (middle) in CAR-NK cells cultured alone, Raji cells cultured alone, and CAR-NK cells co-cultured with Raji cells for 5 mins (representative of 3 donors). Inset numbers indicate percentages of cells within the indicated gated regions. Bar graphs show the summary data for each marker (right). P values were determined by two-tailed Student’s t-test in panel c, or two-tailed Student’s paired t test in panel d. Data were shown by mean + s.e.m. Each circle represents an individual cell.
Extended Data Fig. 2
Extended Data Fig. 2. CAR19-mediated acquisition of tCD19 on NK cells from targeted Raji cells was associated with decreased anti-tumor cytotoxicity.
(a) UMAP analyses of CAR-NK cells collected after co-culture with RajiCD19+ cells. Phenotypic signatures of all collected CAR-NK cells were evaluated by mass cytometry, and data from 10,000 cells derived from 3 donors were merged to create a single UMAP map, where the analysis generated eight distinct color-coded clusters that represented the different subsets of NK cells. Marker expression for each NK cell subset was shown in UMAP plots. (b) Contour plots showing the UMAP cluster prevalence of CAR-NK cells alone, 30 min, 1 hr, 3 hrs, or 6 hrs after co-culture with Raji cells. The percentage of TROG+ CAR-NK cells (upper panel), and tCD19 expression are presented for each subset for the different conditions (lower panel). (c) Real-time images representing the co-culture of CAR19-NK cells (green) with RajiCD19-mCherry cells (red). Black arrows indicate events of cell apoptosis; yellow arrows indicate the immunologic synapse-like structure; white arrows indicate CAR19-NK cells with evidence of mCherry transfer; scale bar indicates 10 μm. (d) Flow cytometric analyses represent co-expression of CD19 and mCherry on singlet RajiCD19-mCherry cells cultured either alone (grey, representative for 3 samples) or CAR19-NK cells after co-culture with RajiCD19-mCherry cells for 5 mins only (green, representative for 5 donors); the following graph shows the correlation between mCherry (as determined as gMFI) and CD19 (as determined as the number of molecules per cell) for each singlet cell. (e) CD19 (as determined as the number of molecules per cell), and gMFI of mCherry expression on singlet RajiCD19-mCherry cells at different time points during co-culture with CAR19-NK cells (n=3 donors). P values were determined by two-tailed Pearson’s correlation coefficient in panel d, two-tailed one-way ANOVA in panel e. Data were assessed by flow cytometry in panels d and e, and shown by mean + s.e.m.
Extended Data Fig. 3
Extended Data Fig. 3. Self-engagement of TROG+ CAR-NK cells resulted in NK cell fratricide.
(a and b) Schematic illustrating the single-cell time-lapse imaging cytotoxicity assay. Time was recorded over 5 hours (T0 –T300min) from the start of co-culture, (a) where one single cell, or (b) two cells of non-TROG-antigen expressing fresh CAR-NK cells (control; grey) or CAR-NKTROG+ cells (green) were incubated in each nanowell. For the duration of the assay, the amount of time taken to detect Annexin V influx in the sorted CAR-NK cell was determined as the time taken to induce cell apoptosis. The following Kaplan-Meier curves show the percent (%) of apoptosis in CAR-NK cells during incubation. (c) Schematic representation of the experimental plan: TROG+ CAR19-NK cells were purified, and their phenotypic signature were evaluated before and 5 hrs post-culture by mass cytometry. Data from 10,000 cells from 3 donors per condition were merged to create a single UMAP map with eight distinct color-coded clusters that represented the different subsets of CAR-NK cells. Marker expression for each NK cell subset is shown. (d) UMAP plots showing the expression of TROG-antigen (tCD19; left) on CAR-NK cells before and after 5 hrs of culture with their sibling cells; the contour plots show the prevalence of each CAR-NK cell subset before and after 5 hrs of culture, with the percentage of each subset also indicated (right). P value was determined by Log-rank test in panels a,b.
Extended Data Fig. 4
Extended Data Fig. 4. Repeated challenge of CAR19-NK cells with autoNKCD19+ cells result in CAR-NK cell hyporesponsiveness.
(a) tSNE analysis of live hCD45+GFPCD56+CD3 CAR19-NK cells 4 days following a second round of antigen challenge with autoNKgCD19+gGFP+ cells; controls include CAR19-NK cells cultured alone or co-cultured with autoNKgGFP+ cells for 4 days (lacking CD19 expression). The phenotypic cell signature was evaluated by CyTOF and merged to create a single t-SNE map (10,000 cells from 3 pooled donors per condition). Expression of CAR19 (green) and tCD19 (orange) is determined against NT-NK cell controls. Insert numbers indicate the percentages (%) of CAR and tCD19 expression on CAR19-NK cells. (b) Kaplan-Meier plots showing the percentage (%) of apoptotic Raji cells following co-culture with CAR-NK cell isolated after the 1st round (2 days, left) or 3rd round (6 days, right) of re-challenge with autoNKgCD19+/GFP+ cells compared to fresh CAR-NK cells. Assays were performed in microwells with E:T ratio of 1:1; data were pooled from two donors. (c) Schematic representation of single-cell time-lapse imaging cytotoxicity assay, where a single CAR-NK cell was cultured with two Raji cells. Annexin V influx in Raji cells defined cell apoptosis. The bar plots show the percentage of CAR-NK cells isolated at different time points after re-challenge with autoNKgCD19+/GFP+ cells that succeeded in lysing one (light green) or two (dark green) Raji cells. Fresh CAR-NK cells (pre) were used as control (n= 4 donors for pre, 3 donors for 2nd, and 2 donors for 1st and 3rd challenge). (d-f) Incucyte analyses showing the percentage (%) of caspase 3/7 events in Raji cells co-cultured with CAR19-NK cells isolated after (d) the 1st round, (e) 2nd round, or (f) 3rd round of re-challenge with autoNKgCD19+/GFP+ cells. CAR-NK cells isolated after each round of re-challenge and cultured for 24 hrs in complete media supplemented with 100 U/mL IL-2 (referred to as ‘rested’ cells) were used as controls (representative of 3 donors). P values were determined by Log-rank test in panel b, two-tailed Student’s paired t test in panel c, or two-tailed two-way ANOVA in panels d,e,f, n.s.: not significant. Data were shown by mean + s.e.m.
Extended Data Fig. 5
Extended Data Fig. 5. CAR19-NK cell trogocytosis and reciprocal reduction in CD19 antigen expression on tumor cells in vivo.
(a) Schematic illustration of timeline using a mouse model engrafted with Raji cells. Mice received three dose levels of Luc/GFP-expressing CD19+ Raji cells (0.2×10⁵, 1×10⁵, or 5×10⁵), respectively, followed by a single infusion of CAR19-NK cells (1×10⁷) or NT-NK cells alone (1×10⁷) as control, (b) Graphs showing the intensity of bioluminescence imaging (BLI) over time; black: Raji cells only; blue: Raji cells with NT-NK cell infusion; green: Raji cells with CAR19-NK cell infusion. (b) tCD19 expression (indicated as TROG+/TROG ratio) on singlet hCD45+GFPCD56+CD3 on CAR-NK cell products gated on CAR19-expressing (green) vs. CAR-negative fractions (light blue) in peripheral blood samples collected at different time points after infusion (n=15 mice). (c) CD19 expression on Raji cells, shown as the count of molecules per cell (grey) in peripheral blood (left, n=15 mice), and organs [spleen, liver, bone marrow (BM), and blood] of mice at the end time point (right, n=24 mice) after CAR19-NK cell infusion. (d) CD19 expression on Raji cells, shown as the count of molecules per cell in organs harvested at the end time point after NT-NK cell infusion (n=10 mice). P values were determined by two-tailed Student’s t test for analyses, and two-tailed one-way ANOVA in panel d. Data were assessed by flow cytometry in samples with cell objects of interest >20 counts, and shown by mean + s.e.m, or medium (min/max) in boxplot. Each circle represents an individual mouse sample and outliers are indicated as dark dots.
Extended Data Fig. 6
Extended Data Fig. 6. In vivo trogocytosis was associated with limited persistence of CAR-NK cells.
(a-b) The proportion of CAR19-expressing vs. CAR-negative live NK cells (a) in the peripheral blood of mice at different time points after CAR-NK cell infusion (left, n=15 mice), and (b) in different organs at the end time point (right, n=24 mice). (c) tCD19 expression on NK cells in the CAR19-expressing vs. the CAR-negative NK cell fractions and their viability based on TROG-positivity (Q2: CAR19-NKTROG+, Q3: CAR-negative NKTROG+) in cells harvested from different organs collected at the end time point (representative of n=24 mice). Inset numbers indicate the percentages of cells within the indicated gated regions. (d) tCD19 expression (indicated as TROG+/TROG ratio) on singlet hCD45+GFPCD56+CD3 CAR19-NK vs. CAR-negative NK cells harvested from organs at the end time point after CAR-NK cell infusion (left, n=24 mice) and in mice treated with NT-NK cells alone (right: dark blue, n=10 mice). (e) Percentage (%) of viable NKTROG+ (tCD19+, left) and viable NKTROG− cells (middle) for CAR19-NK cells vs. CAR-negative NK cells harvested from organs at the end time point after infusion of CAR-NK cells (n=24 mice), or in mice treated with NT-NK cells (right: dark blue, n=10 mice). P values were determined by two-tailed Student’s paired t test in panel a, two-tailed one-way ANOVA in panel b, two-tailed Student’s t test in panels d and e. Data were assessed by flow cytometry in samples with cell objects of interest >20 counts, and shown by mean + s.e.m, or medium (min/max) in boxplot. Each circle represents an individual mouse sample, and outliers were indicated as dark dots.
Extended Data Fig. 7
Extended Data Fig. 7. In vivo trogocytosis was associated with poor viability of CAR-NK cells.
(a) Schematic illustration of the timeline using a mouse model of lymphoma, engrafted with 0.2×10⁵ luc/GFP-expressing CD19+ Raji cells and treated with a single infusion of CAR19-NK cells or NT-NK cells as control. Blood, BM, spleen and liver were harvested for analysis at two weeks (day 13–15), three to four weeks (day 20–27), or at the end time point (day 29–34) after infusion. (b) Tumor burden was assessed weekly by BLI. The BLI intensity is shown for each mouse after infusion with CAR-NK cells (green) or NT-NK cells (blue). Untreated mice were used as controls (black). (c) Heatmap showing expression levels of phenotypic and functional markers on fractions of TROG+ (tCD19+) and TROG live hCD45+GFPCD56+CD3 NK cells at different timepoints post-infusion. The expression level for each marker is represented by the color grey (low) - orange (high) and the size. (d) The phenotypic cell signature for each condition was evaluated by mass cytometry and merged to create a single t-SNE map. Expression of tCD19 (orange) and CAR19 (green) on hCD45+GFPCD56+CD3 NK cells was determined based on their expression on NT-NK cell controls. (e) Violin plots showing expression of tCD19 on NK cells within each cluster harvested from mice treated with CAR19-NK cells (left); cisplatin levels within the TROG+ vs. TROG fractions for each cluster (right) are shown. (f) Violin plots showing expression of tCD19 on NT-NK cells within each cluster (left); cisplatin levels within the TROG+ vs. TROG fractions for each cluster (right) are shown. (g) Gene signature for total hCD45+ cells at different time points during the treatment course. The t-SNE maps, generated with the Seurat package in R, show color-coded expression levels for CD19 and MS4A1 (Raji cells), NKG7 and FCGR3A (NK cells) for each cluster. P values were determined by two-tailed Wilcoxon matched pairs test in panels e and f. Data were assessed by mass cytometry and shown in violin graph with the indicated median.
Extended Data Fig. 8
Extended Data Fig. 8. iCAR design, expression and impact on primary human NK cell signaling and function.
(a) Schematic diagram of the viral vector design for the different anti-CD19 iCARs; TM: transmembrane; SE: signaling endodomain. (b) Cell surface expression of aCAR19, 19scFv, or iCAR19 constructs by flow cytometry in transduced primary human NK cells. Dot plots are representative of three different donors. Inset numbers indicate the percentage of CAR-expressing cells within the indicated gated regions. (c and d) Flow cytometric expression of (c) phospho-SHP1 (pSHP1) and (d) phospho-Syk/Zap70 in NK cells expressing CAR19, 19scFv or the different iCAR19 constructs (n=5 donors) in response to stimulation with CD19+ Raji cells; the following bar graphs show their expression, determined by gMFI normalized to the unstimulated NK cell population. (e-h) CD107a (left), TNF-α (middle), and IFN-γ production by NK cells transduced with CAR19, 19scFv, or the different iCAR19 constructs in response to 6-hr stimulation with (e) CD19+ K562 cells (K562gCD19+), (f) K562, (g) RajiCD19+, or (h) CD19 RajiCD19-KO target cells (n=5 donors). (i and j) Incucyte analyses of percentage (%) caspase 3/7 events in (i) RajiCD19+ and (j) autoNKgCD19+ target cells after co-culture with NK cells expressing CAR19, 19scFv or the different iCAR19 constructs, (representative for three donors). (k and l) Cumulative population doubling (PD) of NK cells expressing CAR19, 19scFv or the different iCAR19 constructs over 70 days of culture with (k) IL-2 only or with (l) IL-2 plus weekly uAPC stimulation (n=3 donors). (m) tCD19 expression on NK cells transduced with CAR19, 19scFv or the different iCAR19 constructs, presented as ratio of TROG+/TROG cells at different time points during co-culture with RajiCD19+ cells (n=3 donors) P values were determined by two-tailed one-way ANOVA in panels c-h, or two-tailed two-way ANOVA in panels i-m. Data were assessed in flow cytometry in panels b,c,d,e,f,g,h,m, and shown by mean + s.e.m. Each symbol represents an individual donor.
Extended Data Fig. 9
Extended Data Fig. 9. AI-CAR expressing NK cells exert superior in vivo anti-tumor activity in a SKOV3gCD19+ ovarian cancer model.
(a) Schematic illustration of the timeline using a mouse model of SKOV3gCD19+ ovarian cancer. Seven days later, mice received a single infusion of 1×10⁷ NK cells expressing aCAR19/CS1scFv (green), or aCAR19/iCAR-CS1 (orange), or no NK cells (tumor only) (n=5 mice/group). (b and c) Tumor burden as determined by weekly BLI, (b) representative images at select time points are shown; (c) normalized intensity of BLI for each treatment group over the treatment course; dashed lines represent data for each mouse. (d) Kaplan-Meier curves showing survival of mice after NK cell infusion. (e and f) (e) tCD19 (indicated as TROG+/TROG population) and (f) viability of the TROG+ fraction (NKtCD19+) in the peripheral blood of mice at Days 5, 15, and 30 after infusion of aCAR19/CS1scFv (green) or aCAR19/iCAR-CS1 (orange) NK cells (n=5 mice/group). (g) Percentage (%) of live GFPCD3CD56+CAR19+ NK cells in the peripheral blood of mice at Days 5, 15, and 30 after infusion of aCAR19/CS1scFv (green, left) or aCAR19/iCAR-CS1 (orange, right) NK cells (n=5 mice/group). (h) Live NKCAR19+ NK cell counts in the peripheral blood of mice at Days 5, 15, and 30 after infusion of aCAR19/CS1scFv (green) or aCAR19/iCAR-CS1 (orange) NK cells (n=5 mice/group). (i) Representative images showing H&E and IHC staining with anti-Luciferase, anti-hCD45, or anti-hROR1 antibodies on sections from the mesentery tissue of SKOV3ROR1+ grafted mice treated with aCAR-ROR1/CS1-scFv NK cells or aCAR-ROR1/iCAR-CS1 NK cells. Inserted numbers indicate hCD45+ cell count per 0.1 mm2. Black arrows indicate ROR1 expression on tumor cells; blue arrows indicate ROR1 expression on NK cells; scale bar indicates 100 μm. P values were determined by two-tailed Student’s t test in panels c, e,f,h,i,g, Log-rank test in panel d; n.s.: not significant. Date was pooled from two independent experiments in panels c and d, where NK cells were derived from different donors, or assessed by flow cytometry in panels e,f,g,h and shown by mean + s.e.m. Each circle represents an individual mouse sample.
Extended Data Fig. 10
Extended Data Fig. 10. Model of AI-CAR NK cell function.
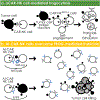
(a) aCAR-NK cell-mediated trogocytosis results in a decrease in antigen density on tumor cells, and promotes CAR-NK cell fratricide and hyporesponsiveness; (b) Engineering NK cells to express both an aCAR against a tumor antigen and a KIR-based inhibitory CAR (iCAR) against an NK self-antigen prevents TROG-induced self-recognition and TROG-antigen mediated fratricide of CAR-NK cells, while preserving their on-target tumor recognition and cytotoxicity.
Figure 1.
Figure 1.. CAR19-mediated trogocytosis in NK cells co-cultured with CD19+ tumor targets.
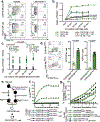
(a) FACS plots show CD19 expression on NK cells transduced with CAR19 or 19scFv (no intracellular signaling domain) after co-culture with Raji cells for 5 min with Latrunculin A (LatA) or vehicle control (representative for 3 donors). The CD19+ gate was determined based on both fluorescent minus one (FMO) control and by referring to NK cells cultured alone. (b) Trogocytic CD19 (tCD19, shown as the ratio of TROG+/TROG) expression on singlet CAR19-NK, 19scFv-NK, and NT-NK cells after co-culture with Raji cells (n= 3 donors). TROG+ fractions comprised NK cells expressing CAR+CD19+ (eg. Q2 from panel a), while the TROG fractions included NK cells expressing CAR+CD19 (eg. Q1 from panel a). (c) tCD19 expression (shown as the ratio of TROG+/TROG) on singlet CAR19-NK (green symbols) or 19scFv-NK cells (black symbols) after co-culture with B-CLL cells (n=4 patients) or B-ALL cells (n=4 patients). (d) Expression of CD107a and IFN-γ in TROG+ vs. TROG CAR19-NK cells 6 hrs after stimulation with Raji cells (representative of 3 donors). Bar graphs show the percentage (%) of CD107a+ and IFN-γ+ cells in each fraction normalized to expression in CAR19-NK cells cultured alone (n=5 donors). (e) Strategy for CD19-mCherry fusion protein expression on CD19-knockout Raji (RajiCD19-KO) cells, controlled by Raji cells genetically modified for intracellular mCherry expression (RajimCherry). (f) Percentage (%) of CAR19-NK cells or 19scFv-NK cells expressing mCherry after co-culture with RajiCD19-mCherry cells or RajimCherry in different conditions in an Incucyte assay (representative of 3 donors). (g) Incucyte analyses showing the % of caspase 3/7 events in the TROG+ fraction of CAR19-NK cells vs. 19scFv-NK cells cultured alone, or with autologous fresh CAR19-NK cells. For CAR19-NKTROG+ cells, anti-human CD19 blocking antibody (αCD19) or an antigen-mismatched scFv antibody were added as controls (representative of 3 donors). P values were determined by two-tailed two-way ANOVA in panels b,c,f,g, or two-sided Student’s paired t test in panel d; n.s.: not significant. Data were shown by mean + s.e.m. Insert numbers indicate % in respective quadrants. Each circle represents an individual donor or experimental replicate.
Figure 2.
Figure 2.. Impact of antigen-induced self-engagement on CAR-NK effector cell phenotype and function.
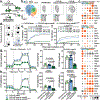
(a) Schematic illustrating a re-challenge (chlg) assay using autoNKgCD19+ at an E:T ratio of 1:3, controlled by co-culture with autoNK cell (lacking CD19 expression). Both autoNKgCD19+ and autoNK cells were genetically modified to express intracellular GFP to facilitate their identification. (b) tSNE analysis of live NKCAR19+/GFP− cells after the second round of re-challenge with autoNKgCD19+/gGFP+ cells; controls include CAR19-NK cells alone or after 4 days of co-culture with autoNKgGFP+ cells (no CD19 expression). Cells were evaluated by CyTOF, and merged to create a single t-SNE map (10,000 cells from 3 pooled donors per condition). Each cluster (EC1-EC5) is represented in a different color, and frequencies indicated for each culture condition. (c) Heat map for expression of key NK cell phenotypic and functional markers. Expression of each marker is represented by color grey (low) to orange (high) and size of the circle. TFs: transcription factors, Grm: granzyme. (d) Schematic illustrating single-cell time-lapse imaging cytotoxicity assay. Time was recorded over 6 hours (T0 –T360min) for a single CAR-NK cell co-cultured with a single tumor cell. During the incubation, Annexin V influx in the tumor cell was determined as a marker of apoptosis. (e and f) Kaplan-Meier curves showing the percent (%) apoptosis in targeted cells when CAR-NK cells were co-cultured with (e) K562 cells or (f) Raji cells (grey: CAR-NK cells alone; blue: CAR-NK cells isolated after 4 days co-culture with autoNKCD19-/GFP+ cells; green: CAR-NK cells isolated after the second round re-challenge by autoNKgCD19+/GFP+ cells). (g) Ex vivo analysis of CAR-NK cell glycolytic fitness by ECAR (extracellular acidification rate); bar graphs showing their basal ECAR (left; n=5 donors), and their maximum ECAR (right; n=5 donors). (h) Oxidative metabolism (OXPHOS) of CAR-NK cells by OCR (oxygen consumption rate); bar graphs showing their basal OCR (left; n=5 donors), and their maximal OCR (right; n=5 donors). P values were determined by Log-rank test in panels e and f, or two-sided Student’s t test in panels g and h. Data were shown by mean + s.e.m. Each symbol represents an individual donor-derived CAR-NK cell sample.
Figure 3.
Figure 3.. Impact of TROG-antigen acquisition on CAR-NK cell phenotype and function in vivo.
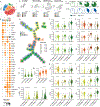
(a) tSNE analysis of live hCD45+GFPCD56+CD3 NK cells collected from different organs (blood, bone marrow, spleen, and liver) of mice at different points during the treatment course. Phenotypic signatures of all collected NK cells were evaluated by mass cytometry and merged to create a single tSNE map. (b) Contour plots showing the tSNE cluster prevalence in the pre-infusion product, 2 weeks after infusion, 3–4 weeks after infusion, or at the endpoint. The number of cell objects for each condition was indicated. (c) Frequencies of NK cells expressing the TROG-antigen (tCD19) in the CAR19-positive (green) or CAR-negative (blue) fractions at different time points during treatment are presented, controlled by their counterparts in the pre-infusion product. (d) Heat map representing the expression levels of phenotypic and functional markers on CAR-NK cells within each cluster. The expression level for each marker is represented by the color grey (low) - orange (high) and the size. (e) FlowSOM analysis of post-infusion NK cell populations where each metacluster is mapped using a self-organizing mapping strategy. Each colored region corresponds to a metacluster with inserted pie chart representing the frequency of NK cells expressing CAR and TROG-antigen (tCD19) on clustered cells; the size of each chart represents the number of clustered cells. (f and g) Violin plots showing the expression of (f) CAR19, and (g) tCD19 on CAR19-NK cells in each cluster, determined based on their level in pre-infused NT-NK cells shown as the grey line, (h) Violin plot showing cisplatin levels in post-infusion CAR19-NKTROG+ cell (expressing CD19) or their CAR19-NKTROG− counterparts for each cluster. Cisplatin level represents the cellular viability of each population. (i-l) Violin plots showing the expression of (i) c-Kit, EOMES, and Tbet; (j) Zap70, Syk, and 2B4; (k) Granzyme (Gr) A, GrB, and perforin; (l) PD-1, TIM3, and TIGIT in TROG+ and TROG fractions of CAR19-NK cells. The median expression strength for each marker in CAR19-NK cells prior to infusion (in C1) is indicated by the grey line. P values were determined by two-tailed Wilcoxon matched pairs test.
Figure 4.
Figure 4.. A lower level of CAR-mediated TROG-antigen expression was associated with improved clinical response to CAR-NK cell-based immunotherapy.
(a) tCD19 expression on singlet cells of donor-derived CAR-expressing NK cells (NKCAR+), donor-derived non-CAR expressing NK cells (NKCAR−) and patient-derived NK cells at different time points after receiving CAR19-NK cell immunotherapy. Geometric mean fluorescent intensity (gMFI) of tCD19 expression was assessed by flow cytometry. Samples from individual patients at different times after CAR-NK cell infusion are presented. (b) Non-linear regression analyses using polynomial models show tCD19 expression on donor-derived NKCAR+ cells over time after CAR-NK cell infusion. The normalized mean tCD19 gMFI on CAR19-NK cells for the whole patient population was 6.29 (range of 0.61–35.77). Patients with a high (> mean) versus low (≤ mean) normalized tCD19-gMFI at more than one time point were defined as group of TROGhigh (n=4 patients) vs. TROGlow (n=7 patients), respectively. (c) CD19 expression (upper), and cell counts (lower) for singlet CD19+ B cells in the TROGlow vs. TROGhigh patient groups at different time points after CAR-NK cell infusion. (d) Pie charts showing the number of responders (res, upper) vs. non-responders (non-res, lower) after receiving CAR19-NK cell infusion in the TROGlow vs. TROGhigh groups. P value was determined by two-tailed two-way ANOVA in panel b, two-sided Student’s t test in panel c, two-tailed Fisher’s exact test in panel d; Data were assessed by mass cytometry and shown by mean + s.e.m. Each circle represents an individual patient.
Figure 5.
Figure 5.. Expression of an iCAR by NK cells reduced fratricide and exhaustion induced by aCAR.
(a) Schematic of the retrovirus vector for aCAR19 and iCAR1-CS1. Flow cytometric analysis shows dual expression of aCAR19 and iCAR1-CS1 on NK cells, measured by tagged peptides (CD19 and CS1). TM: transmembrane; SE: signaling endodomain. CAR expression levels are indicated within respective quadrants. (b) Diagram illustrating engagement of AI-CAR-expressing NK cells with their targets; red symbol indicates inhibitory signal ‘−’, green symbol indicates activating signal ‘+’. (c) Phos-CD3ζ (pCD3z, left) and phos-Syk/Zap70 (right) levels in NK cells expressing 19scFv/CS1scFv (scFv only- no intracellular signaling; blue), 19scFv/iCAR1-CS1 (iCAR/scFv; red), aCAR19/CS1scFv (aCAR/scFv; green), or aCAR19/iCAR1-CS1 (aCAR/iCAR; yellow) after stimulation with RajiCD19+/CS1− cells; the following bar graphs show fold change (FC) in gMFI after normalization to isotype control (n=5 donors/condition). (d) Incucyte analyses showing caspase 3/7 events in CD19+CS1 primary CLL cells after co-culture with CAR-NK cells, controlled by scFv-expressing NK cells (n=3 donors/condition). (e) Phos-CD3ζ (pCD3z, left) and phos-Syk/Zap70 (right) levels in NK cells expressing 19scFv/CS1scFv, 19scFv/iCAR1-CS1, aCAR19/CS1scFv, or aCAR19/iCAR1-CS1 stimulated with CD19+ autoNKCS1+ cells; bar graphs show the FC in gMFI after normalization to isotype control (n=5 donors/condition). (f) Incucyte analysis showing caspase 3/7 events in gCD19+CS1+ autoNK cells after co-culture with CAR-expressing NK cells, controlled by scFv-expressing NK cells (n=3 donors/condition). (g) Co-expression of PD1, TIM3, and TIGIT, and (h) ratio of EOMES/Tbet in singlet CAR-NK cells after the second round of antigen challenge with autoNKgCD19+/CS1+/GFP+ cells (n=5 donors). Representative flow histograms for EOMES and Tbet were shown. (i) Cumulative population doublings (PDs) for each CAR-expressing NK cell condition (n=3 donors) over 70 days of culture with IL-2. (j) tCD19 expression (shown as ratio of TROG+/TROG) on singlet CAR-expressing NK cells (n=3 donors) after co-culture with Raji cells, controlled by scFv-expressing NK cells (representative of 3 donors). P values were determined by two-tailed two-way ANOVA in panels d,f,I,j, or two-sided Student’s t test in panels c,e,g,h; n.s: not significant. Data were assessed by flow cytometry in panels a,c,e,g,h,j, and shown as mean + s.e.m, or medium (min/max) in boxplot. Each circle represents an individual donor.
Figure 6.
Figure 6.. AI-CAR expressing NK cells showed superior in vivo anti-tumor activity.
(a) Schema of the mouse model of Raji tumor. Mice received a single infusion of NK cells expressing 19scFv/CS1scFv (blue), 19scFv/iCAR-CS1 (red), aCAR19/CS1scFv (green), or aCAR19/iCAR-CS1 (orange). trt: treatment, n=5 mice). (b) Tumor burden was assessed weekly by bioluminescence imaging (BLI); and (c) presented as the normalized intensity of BLI; dashed lines refer to each mouse. (d) Kaplan-Meier curves showing survival of mice (e) CD19 expression on Raji cells (molecule count per cell) in peripheral blood (PB) and bone marrow (BM), controlled against tumor only (n=5 mice). (f) tCD19 expression on singlet NKCAR19+ cells, indicated as TROG+/TROG ratio (left), and viability (%) of TROG+ fraction (NKtCD19+, right) for aCAR19/CS1scFv vs. aCAR19/iCAR-CS1 NK cells, in PB (n=5 mice/group). (g) NK cell viability in PB after aCAR19/iCAR1-CS1 (green bars, left) or aCAR19/CS1scFv NK cell infusion (orange bars, right; n=5 mice/group). (h) Viable NKaCAR19+ cell count in PB and spleen (n=5 mice/group). (i) Serum IFN-γ and TNF-α levels (n=5 mice/group). (j) Schema of SKOV3ROR1+engrafted mouse model receiving a single infusion of NK cells expressing aCAR-ROR1/CS1scFv (green), or aCAR-ROR1/iCAR-CS1 (orange), with non-treated tumor-engrafted group as control (n=5 mice/group). (k-m) Weekly tumor burden assessment by BLI (k); and (l) the normalized BLI intensity for each mouse is indicated by dashed lines, and (m) BLI intensity at day 28. (n) tROR1 expression on singlet NKaCAR-ROR1+ cells (ratio of TROG+/TROG). (o) Percent viable TROG+ fraction (NKtROR1+) for aCAR-ROR1/CS1scFv (green bar), or aCAR-ROR1/iCAR-CS1 NK cells (orange bar) in PB (n=5 mice/group). (p) Percent viable GFPCD3CD56+aCAR-ROR1+ NK cells in PB after aCAR-ROR1/CS1scFv (green bar, left) or aCAR-ROR1/iCAR-CS1 NK cell infusion (orange bar, right; n=5 mice/group). (q) Viable NKaCAR-ROR1+ cell count in PB after aCAR-ROR1/CS1scFv (green symbols), or aCAR-ROR1/iCAR-CS1 cell infusion (orange symbols; n=5 mice per group). P values were determined by two-tailed two-way ANOVA in panel c, Log-rank test in panel d, or two-tailed Student’s t test in panels e,f,g,h,i,l,m,n,o,p,q. Data were pooled from two independent experiments using NK cells from different donors in panels c,d,i m. Flow cytometry data are shown as mean + s.e.m. Each symbol represents an individual mouse sample.

Similar articles

Cited by

References

    1. Joly E & Hudrisier D What is trogocytosis and what is its purpose? Nat Immunol 4, 815 (2003). - PubMed
    1. Dance A Core Concept: Cells nibble one another via the under-appreciated process of trogocytosis. Proc Natl Acad Sci U S A 116, 17608–17610 (2019). - PMC - PubMed
    1. Bettadapur A, Miller HW & Ralston KS Biting Off What Can Be Chewed: Trogocytosis in Health, Infection, and Disease. Infect Immun 88(2020). - PMC - PubMed
    1. Ahmed KA, Munegowda MA, Xie Y & Xiang J Intercellular trogocytosis plays an important role in modulation of immune responses. Cell Mol Immunol 5, 261–269 (2008). - PMC - PubMed
    1. Miyake K & Karasuyama H The Role of Trogocytosis in the Modulation of Immune Cell Functions. Cells 10(2021). - PMC - PubMed

Publication types

Substances