. 2022 Dec 5;219(12):e20220726.
doi: 10.1084/jem.20220726. Epub 2022 Sep 28.

DSTYK inhibition increases the sensitivity of lung cancer cells to T cell-mediated cytotoxicity

Affiliations

DSTYK inhibition increases the sensitivity of lung cancer cells to T cell-mediated cytotoxicity

Karmele Valencia et al. J Exp Med. .

Abstract

Lung cancer remains the leading cause of cancer-related death worldwide. We identify DSTYK, a dual serine/threonine and tyrosine non-receptor protein kinase, as a novel actionable target altered in non-small cell lung cancer (NSCLC). We also show DSTYK's association with a lower overall survival (OS) and poorer progression-free survival (PFS) in multiple patient cohorts. Abrogation of DSTYK in lung cancer experimental systems prevents mTOR-dependent cytoprotective autophagy, impairs lysosomal biogenesis and maturation, and induces accumulation of autophagosomes. Moreover, DSTYK inhibition severely affects mitochondrial fitness. We demonstrate in vivo that inhibition of DSTYK sensitizes lung cancer cells to TNF-α-mediated CD8+-killing and immune-resistant lung tumors to anti-PD-1 treatment. Finally, in a series of lung cancer patients, DSTYK copy number gain predicts lack of response to the immunotherapy. In summary, we have uncovered DSTYK as new therapeutic target in lung cancer. Prioritization of this novel target for drug development and clinical testing may expand the percentage of NSCLC patients benefiting from immune-based treatments.


Conflict of interest statement

Disclosures: R. Thomas reported grants from Roche, personal fees from PearlRiver, and “other” from PearlRiver, Centessa, and Epiphanes outside the submitted work. J. Frigola reported grants from Merck Healthcare KGaA during the conduct of the study. A. Calvo reported grants from AstraZeneca and PharmaMar outside the submitted work. E. Felip reported other from AbbVie, Amgen, AstraZeneca, Bayer, Boehringer Ingelheim, Bristol Myers Squibb, Daiichi Sankyo, Eli Lilly, F. Hoffman - La Roche, GlaxoSmithKline, Ipsen, Janssen, Medical Trends, Medscape, Merck KGaA, Merck Sharp & Dohme, Novartis, PeerVoice, Peptomyc, Pfizer, Sanofi, Springer, Takeda, TouchTime, Fundación Merck Salud, Grant for Oncology Innovation and Merck, Healthcare KGaA, and Grifols (Independent Member of the Board) outside the submitted work. I. Melero reported personal fees from AstraZeneca, Pharmamar, Roche, and Genmab; grants from AstraZeneca, BMS, Genmab, and Roche; and personal fees from Merus, F-star, Numab, Amunix, Third Rock, and Pieris outside the submitted work. L.M. Montuenga reported grants from AstraZeneca, Bristol Myers Squibb, and Serum. No other disclosures were reported.

Figures
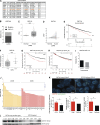
Figure 1.
Figure 1.
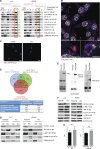
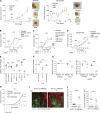
DSTYK is amplified and high levels of the gene correlate with poor prognosis in NSCLC patients. (A) Mutated kinase coding genes of a syngeneic SCC cell line (UN-SCC680) derived from a N-nitroso-tris-chloroethylurea chemically induced mouse model in A/J mice. Orange highlights tyrosine kinase genes. (B) Percentage of patients with DSTYK alteration from lung cancer. From Pan-Cancer TCGA data. (C) DSTYK CNV in normal (n = 960) and tumoral (n = 904) samples from NSCLC patients from the TCGA project. A t test was performed to compared both groups; P value = 2.2 × 10⁻¹⁶. (D) DSTYK CNV in paired normal and tumoral samples (n = 832) of NSCLC patients from the TCGA project. 82% of tumor samples showed DSTYK CN gain. (E) Kaplan–Meier plot. OS significantly decreases in lung cancer patients from the TCGA project with DSTYK CN gain (CNV ≥ 3; n, CVN < 3 = 951; n, CNV ≥ 3 = 40). Log-rank test P = 0.01. (F) Dot plot shows the correlation between CNV and mRNA expression of DSTYK. Patients with CNV ≥3 present significantly higher expression of DSTYK mRNA (n, CVN < 3 = 954; n, CNV ≥ 3 = 54). A t test was performed to compared both groups; P value = 8.5 × 10⁻⁷. (G) Kaplan–Meier plot. PFS significantly decreases in lung cancer patients with high DSTYK mRNA expression (Q1). (n, low = 736; n, high = 246). Log-rank test P = 2.4 × 10⁻⁸. Data are from https://kmplot.com/. (H) Kaplan–Meier plot. OS significantly decreases in lung cancer patients with high DSTYK mRNA expression (Q1). n, low = 1452; n, high = 373. Log-rank test P = 0.036. Data are from https://kmplot.com/. (I) Percentage of LUAD and LUSC patients with CN gain of DSTYK (CN > 3). Data from the TCGA project. (J) DSTYK CNV evaluation in CIMA-CUN-cohort patients by qRT-PCR. (K) FISH analysis of DSTYK (Amp) and (NoAmp) patients. Scale bar: 5 µm. A t test was performed to compare cells with DSTYK CN (P value = 0.04); median average of DSTYK CN (P = 0.02) and maximum CN of DSTYK (P = 0.038). (L) Cropped images from the Western blot analysis of DSTYK in frozen tumor samples from CIMA-CUN cohort patients with DSTYK CN gain and diploid number of DSTYK. *, P < 0.05; ***, P < 0.001. Source data are available for this figure: SourceData F1.
Figure S1.
Figure S1.
DSTYK alterations in cancer. Percentage of patients with DSTYK alteration from 24 different cancer types. From Pan-Cancer TCGA data.
Figure 2.
Figure 2.
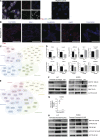
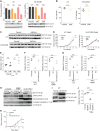
DSTYK is located in autophagosomes and regulates processes related to those vesicles. (A) Subcellular fractionation of LLC and H2009 cells. The following fractions were shown in the Western blot from left to right: total extract; nuclear extract (P3000); cytosolic extract (S3000); large organelle extract (P10000); cytosolic extract without large organelles (S10000); microsomal fraction (P100000); and soluble cytosolic extract (S100000). Different organelle markers were tested to control proper fractionation. (B) Top: Double IF of Flag-Dstyk LLC cells. Flag-DSTYK (magenta) showing co-localization with LC3 (blue). Scale bar: 20 µm. Bottom: Triple IF of Flag-Dstyk LLC cells. Detailed image of autophagosomes: Flag-DSTYK (magenta), LC3 (blue), and LAMP1 (green). Scale bars: 5 and 2 µm. Observed by super-resolution/Airyscan based/confocal microscopy. (C) PLA images of H2009 cells. Left: Red fluorescent dots result from DSTYK+LC3 proteins proximity (maximum distance: 40 nm). Right: Technical negative control. Scale bar: 20 µm. (D) Venn diagram picturing RNAseq analysis. Three RNAseq analyses were carried out to identify the differentially expressed transcripts: LLC comparing parental line vs. silenced (sh#) Dstyk (blue circle), UN-SCC679 line comparing parental vs. overexpression (O/E) Dstyk (green circle), and UN-SCC679 comparing parental vs. silenced (sh#) Dstyk (red circle). Once differentially expressed transcripts were selected (adjusted P value <0.05) in each contrast, all experiments were merged to verify the intersection of the transcripts based on name and the direction. 163 transcripts were finally selected. (E) Immunoprecipitation of Flag-DSTYK in the UN-SCC-679 cell line validating Western blots showing DSTYK binding to P62 protein. (F) Cropped images from the Western blot analysis of autophagy pathway proteins in LLC and H2009 parental and DSTYK-KO cells. (G) Cropped images from the Western blot analysis of lysosomal biogenesis pathway proteins in LLC and H2009 parental and DSTYK-KO cells in cytoplasmic/nuclear fractions. All Western blots show representative results from three independent experiments. (H) Lysosomal pH measurement in LLC and H2009 parental and DSTYK-KO cells. A t test was performed to compared both groups: LLC P value = 0.05; H2009 P value = 0.01. Images shown in A, B, F, G, and H show a representative experiment out of three similarly performed. *, P < 0.05; **, P < 0.01. Source data are available for this figure: SourceData F2.
Figure S2.
Figure S2.
DSTYK is involved in autophagic molecular pathways. (A) Left: Double IF of Flag-Dstyk LLC cells. DSTYK (magenta) showing co-localization with LC3 (blue). Scale bar: 20 µm. Middle: Single channel images correspondent to triple IF of Flag-Dstyk LLC cells. DSTYK (red), LC3 (blue), LAMP1 (green), and nuclei (white). Scale bars: 20 µm. Right: Technical negative control. Scale bars: 10 µm. Observed by super-resolution/Airyscan based/confocal microscopy. (B) Double IF of Flag-Dstyk LLC cells. DSTYK (red) do not co-localize with cellular vesicles markers (blue). Scale bar: 20 µm. (C) Scheme of differentially expressed genes from the RNAseq analysis enriched in the following categories: lysosome, autophagy, mitochondria, oxidative stress, and cytoskeleton. (D) Validation of mRNA expression of candidate genes from the RNAseq analysis in LLC and H2009 parental and CRISPRed cells by quantitative PCR. Analysis was assessed by t test. P values for parental vs. KO comparation were the following: Dstyk in LLC, P < 0.0001 and DSTYK in H2009, P < 0.0001; Lamp1 in LLC, P = 0.001 and LAMP1 in H2009, P < 0.0001; Atp6v0a in LLC, P < 0.0001 and ATP6V0A in H2009, P < 0.03; Nqo1 in LLC, P < 0.0001 and NQO1 in H2009, P < 0.0001; Tomm20 in LLC, P < 0.001 and TOMM20 in H2009, P < 0.03. Three experimental replicates were performed for each experimental condition. (E) Scheme of DSTYK interactor proteins from immunoprecipitation analysis enriched in the following categories: lysosome, autophagy, mitochondria, oxidative stress, and cytoskeleton. (F) Cropped images from Western blot analysis of autophagy pathway proteins in LLC and H2009 parental, DSTYK-KO, and KO treated with rapamycin cells. A representative experiment out of two similarly performed is shown. (G) Glucose levels (mg/dl) in cell culture supernatants of parental H2009 and KO cells. Analysis by t test rendered P = 0.001. Three experimental replicates were performed for each experimental condition. (H) Cropped images from Western blot analysis of autophagy pathway proteins in LLC and H2009 parental, parental treated with chloroquine, and DSTYK-KO cells. *, P < 0.05; **, P < 0.01; ***, P < 0.001. A representative experiment out of two similarly performed is shown. Source data are available for this figure: SourceData FS2.
Figure 3.
Figure 3.
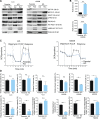
DSTYK role in oxidative stress in lung cancer cells. (A) Cropped images from the Western blot analysis of KEAP1/NRF2 pathway proteins in LLC and H2009 parental and DSTYK-KO cells in cytoplasmic/nuclear fractions. Western blots show representative results from three independent experiments. (B) ROS measurements in LLC and H2009 parental and DSTYK-KO cells in basal conditions. Three experimental replicates were performed for each experimental condition. Experimental groups were compared by t test: LLC, P = 0.0031; and H2009, P = 0.0011. (C) Seahorse extracellular flux analysis shows dynamic representation of oxygen consumption rate (OCR) in LLC and H2009 cells under stress conditions. Three experimental replicates were performed for each experimental condition. (D) Comparison of different phases of mitochondrial respiration. Parental or KO LCC and H2009 cells share alteration of maximal respiratory and spare respiratory capacity in stress conditions. Experimental groups were compered by t test. LLC relative maximal respiration, P = 0.03; relative spare capacity, P = 0.01. H2009 relative ATP production, P = 0.002; relative proton leak, P = 0.04; relative maximal respiration, P = 0.0008; relative spare capacity, P < 0.0001; relative non-mitochondrial oxygen consumption, P = 0.03. *, P < 0.05; **, P < 0.01; ***, P < 0.001. All images are representative results out of three experimental replicates. Source data are available for this figure: SourceData F3.
Figure S3.
Figure S3.
Mitochondrial respiration under baseline conditions in an altered DSTYK context. Seahorse extracellular flux analysis shows dynamic representation of oyxgen consumption rate (OCR) in LLC and H2009 cells under basal conditions. Three experimental replicates were performed for each experimental condition.
Figure 4.
Figure 4.
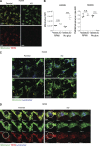
DSTYK is involved in mitochondrial fitness. (A) Confocal microscopy images. Parental or DSTYK KO H2009 tumor cells were plated, and mitochondria were stained using Mitotracker Deep Red and TMRM and treated with RPMI glucose-free serum to induce stress. Scale bar: 20 µm. (B) Flow cytometry was performed for parental or DSTYK KO H2009 cells in basal and stress conditions and stained with Mitotracker Green and TMRM to assess mitochondrial mass and membrane potential. The results shown are triplicates from a representative experiment out of two performed similarly. Experimental groups were compered by t test. H2009 Mitotracker mean fluorescence intensity (MFI) under stress condition, P = 0.0014; H2009 TMRM/Mitotracker ratio MFI under no glucose condition, P < 0.0001. (C) Confocal microscopy images of lysosomes and mitochondria in parental or DSTYK KO H2009 cells were stained using Mitotracker Deep Red (red) and Lysotracker (green) and treated with RPMI glucose-free serum to induce stress for 4 h. Yellow arrows point to lysosome-enriched areas. Scale bar: 20 µm. (D) Confocal microscopy snapshots zoomed in on mitophagy spots in the time-lapse videos taken of parental or DSTYK KO H2009 cells stained using Mitotracker (green), TMRM (red), and Lysotracker (blue) and treated with glucose-free medium for 4 h to induce stress. Light blue staining is the sum of Lysotracker and Mitotracker. ***, P < 0.001. Representative timeframes corresponding to Video 1. Scale bar: 5 µm.
Figure S4.
Figure S4.
DSTYK inhibition affects mitochondrial morphology and functionality. (A) FACs analysis of mitochondrial mass (Mitotracker) and membrane potential (TMRM) of parental or KO LLC and H2009 cells in stress conditions. Three experimental replicates were performed for each experimental condition. Analysis by t test rendered TMRM/Mitotracker ratio MFI, P < 0.0001. (B) Detailed confocal microscopy images of mitochondrial ring-shape in parental or KO H2009 cells under stress conditions. Scale bar: 20 µm. (C) Confocal microscopy images of parental or KO H2009 cells under basal or stress conditions 16 h after treatment. Scale bar: 20 µm. ***, P < 0.001. Panels show representative results from at least two independent experiments performed.
Figure 5.
Figure 5.
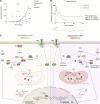
DSTYK depletion sensitizes lung cancer cells to TNF-α CD8+ killing. (A) Syngeneic mouse models for sh#DSTYK LUAD (left) and squamous carcinoma cell lines (right) respectively. sh#DSTYK was activated when tumors reached 50–100 mm3. Analysis by ANOVA. LLC parental vs. sh#3 and parental vs. sh#4, P < 0.001; UN-SCC680 parental vs. sh#3, P = 0.04; and parental vs. sh#4, P < 0.001. Number of C57BL/6J or A/J mice per group = 7. Scale bar: 1 cm. (B) LLC tumor–bearing mice were treated with doxycycline to induce sh#DSTYK in the presence or absence of depleting antibodies (anti-CD8). Statistical analysis was performed by ANOVA comparing tumor volumes of experimental groups at the end point day. LLC parental vs. sh#3, P < 0.001, while no differences were found in other comparations. Number of C57BL/6J mice per group = 7. (C) LLC tumor–bearing mice were treated with doxycycline to induce sh#DSTYK in the presence or absence of depleting antibodies (anti-CD4, anti-NK). Statistical analysis was performed by ANOVA comparing tumor volumes of experimental groups at the end point day. LLC parental vs. sh#3, sh#3+anti-CD4, and sh#3+anti-NKs, P < 0.001. Number of C57BL/6J mice per group = 7. (D) UN-SCC679 tumor–bearing mice were treated with doxycycline to induce sh#DSTYK in the presence or absence of depleting antibodies (anti-CD8). Statistical analysis was performed by ANOVA. Parental vs. sh#4, P < 0.001, while no differences were found in other comparations. Number of A/J mice per group = 7. (E) Control or DSTYK KO LLC cells were pulsed with Ova peptide and incubated with OT-1 T cells at the indicated E:T ratios for 96 h. The dot plot graph shows the relative area under the curve (n = 3) compared with cells incubated in the absence of T cells. t test was used to compared experimental groups and rendered P < 0.001 in every treated condition. (F) LLC T cell killing was performed in the presence of the TNF-α–blocking molecule etanercept. Analysis by t test. KO untreated vs. KO 1:3, P < 0.001. (G) T cell killing of LLC or H2009 parental and KO cell lines was performed in the presence or absence of TNF-α. Analysis by t test. LLC parental vs. KO cells treated with TNF-α, P = 0.02; H2009 parental vs. KO cells treated with TNF-α, P < 0.001. (H) Parental and DSTYK inhibited LLC tumor–bearing mice were treated with etanercept. Statistical analysis was performed by ANOVA. Parental vs. KO, P < 0.0001, while no differences were found in other comparations. Number of C57BL/6J mice per group = 7. (I) Intravital microscopy of T cell responses in LLC DSTYK wildtype and deficient tumors. GFP-LLC#sh tumor cells were injected in the dorsal part of the ear of hCD2dsRED mice in which T cells are red fluorescent. 7 d later, animals were given or not given doxycycline in the drinking water for 24 h and then imaged in a confocal microscope. Images of a representative experiment and corresponding to Video 2. Scale bar: 50 µm. (J) Dot plot quantification of percentage of apoptotic tumor cells per field and number of intratumor T cells in LLC DSTYK wildtype and deficient tumors from F. n = 4 mice per group; each dot represents a single quantified HPF. Statistical analysis of apoptotic tumor cells per field was performed by t test; P < 0.001 and no differences were found in the number of intratumor T cells. *, P < 0.05; ***, P < 0.001.
Figure S5.
Figure S5.
DSTYK inhibition promotes immunogenic death of lung cancer cells. (A) Top: DSTYK mRNA expression by quantitative PCR in LLC and UN-SCC680 parental and sh#DSTYK cells (n = 3). Bottom: DSTYK protein expression by Western blot in LLC and UN-SCC680 parental and sh#DSTYK cells. Analysis was done by t test. Comparison LLC sh#3 −/+ doxy, P = 0.003; sh#4 −/+ doxy, P < 0.001. Comparison UN-SCC680 sh#3 −/+ doxy and sh#4 −/+ doxy, P < 0.001. (B) Proliferation assay measured by xCELLigence Technology for 96 h in LLC and UN-SCC680 parental and sh#DSTYK cells (n = 3). Analysis was done by t test. (C) DSTYK protein expression by Western blot in parental and sh#DSTYK tumors from LLC and UN-SCC680 preclinical models at the end point of in vivo experiment. (D) Tumor volume of LLC and UN-SCC680 parental or sh#DSTYK cells in immunocompromised mice. Analysis was done by ANOVA. Number of Rag−/− IL2Rg−/− mice per group = 5. (E) T cell killing of LLC parental and KO cell lines was performed in the presence or absence of IFN-γ (n = 3). (F) TNF-α–mediated killing of LLC or H2009 parental, KO, and KO treated with rapamycin cell lines (n = 3). Analysis was performed by t test. Parental vs. KO cells treated with TNF-α, P < 0.001 both in LLC and H2009 cell lines. (G) TNF-α–mediated killing of LLC or H2009 parental, parental treated with chloroquine, and KO cell lines (n = 3). Analysis was performed by t test. Parental vs. parental + chloroquine and parental vs. KO cells treated with TNF-α showed P < 0.001 both in LLC and H2009 cell lines. (H) Cropped images from Western blot analysis of apoptosis and necroptosis-related proteins in H2009 parental and DSTYK-KO cells under normal and stress conditions. (I) Cropped images from Western blot analysis of autophagic protein (LC3) in immortalized 3KT parental and overexpressing DSTYK. (J) T cell killing of 3KT parental and overexpressing DSTYK cell lines was performed in the presence or absence of TNF-α (n = 3). Analysis was performed by t test. P < 0.001 for parental vs. parental treated with TNF-α 3KT cell lines. (K) Tumor volume of parental, KO, and KO overexpressing mutated DSTYK LLC tumor–bearing mice. Analysis was performed by ANOVA. P = 0.002 (parental vs. KO tumor-bearing mice). Number of C57BL/6J mice per group = 7. **, P < 0.01; ***, P < 0.001. Source data are available for this figure: SourceData FS5.
Figure 6.
Figure 6.
DSTYK inhibition sensitizes lung cancer cells to immunotherapy. (A) Parental and KO LLC tumor–bearing mice were treated with or without anti–PD-1. Statistical analysis was performed by ANOVA. Parental vs. KO, P = 0.05; parental vs. KO + anti–PD-1, P = 0.008. No differences between parental and parental + anti–PD-1 treated mice. Number of C57BL/6J mice per group = 7. (B) Kaplan–Meier plot showing PFS of lung cancer patients treated with immunotherapy and classified by the presence of absence of DSTYK amplification (n = 76). Log-rank test, P = 0.06. (C) Proposed model of DSTYK molecular mechanism in lung cancer cells. (1) DSTYK inhibits mTOR activity; (2) mTOR mediates TFEB/3 phosphorylation preventing its nuclear translocation; (3) TFEB/3 transcribe genes related to lysosomal biogenesis and maturation; (4) DSTYK binds P62, which is involved in the NRF2/KEAP1 pathway; (5) DSTYK protects mitochondrial integrity; (6) autophagy prevents TNF-α mediated apoptosis. *, P < 0.05; **, P < 0.01.

Comment in

Similar articles

Cited by

References

    1. Ahmad, T., Aggarwal K., Pattnaik B., Mukherjee S., Sethi T., Tiwari B.K., Kumar M., Micheal A., Mabalirajan U., Ghosh B., et al. . 2013. Computational classification of mitochondrial shapes reflects stress and redox state. Cell Death Dis. 4:e461. 10.1038/cddis.2012.213 - DOI - PMC - PubMed
    1. Bhandari, V., Hoey C., Liu L.Y., Lalonde E., Ray J., Livingstone J., Lesurf R., Shiah Y.J., Vujcic T., Huang X., et al. . 2019. Molecular landmarks of tumor hypoxia across cancer types. Nat. Genet. 51:308–318. 10.1038/s41588-018-0318-2 - DOI - PubMed
    1. Bray, N.L., Pimentel H., Melsted P., and Pachter L.. 2016. Near-optimal probabilistic RNA-seq quantification. Nat. Biotechnol. 34:525–527. 10.1038/nbt.3519 - DOI - PubMed
    1. Campbell, J.D., Alexandrov A., Kim J., Wala J., Berger A.H., Pedamallu C.S., Shukla S.A., Guo G., Brooks A.N., Murray B.A., et al. . 2016. Distinct patterns of somatic genome alterations in lung adenocarcinomas and squamous cell carcinomas. Nat. Genet. 48:607–616. 10.1038/ng.3564 - DOI - PMC - PubMed
    1. Canon, J., Rex K., Saiki A.Y., Mohr C., Cooke K., Bagal D., Gaida K., Holt T., Knutson C.G., Koppada N., et al. . 2019. The clinical KRAS(G12C) inhibitor AMG 510 drives anti-tumour immunity. Nature. 575:217–223. 10.1038/s41586-019-1694-1 - DOI - PubMed

Publication types

MeSH terms