. 2022 Sep 26;22(1):294.
doi: 10.1186/s12935-022-02698-5.

Pancancer landscape analysis of the thymosin family identified TMSB10 as a potential prognostic biomarker and immunotherapy target in glioma

Affiliations

Pancancer landscape analysis of the thymosin family identified TMSB10 as a potential prognostic biomarker and immunotherapy target in glioma

Ye Xiong et al. Cancer Cell Int. .

Abstract

Background: Thymosin family genes (TMSs), biologically important peptides with diverse intracellular and extracellular functions, have been shown to promote the progression of multiple cancers. However, multiomics characterization of TMSs and their role in human cancer prognosis has not been systematically performed.

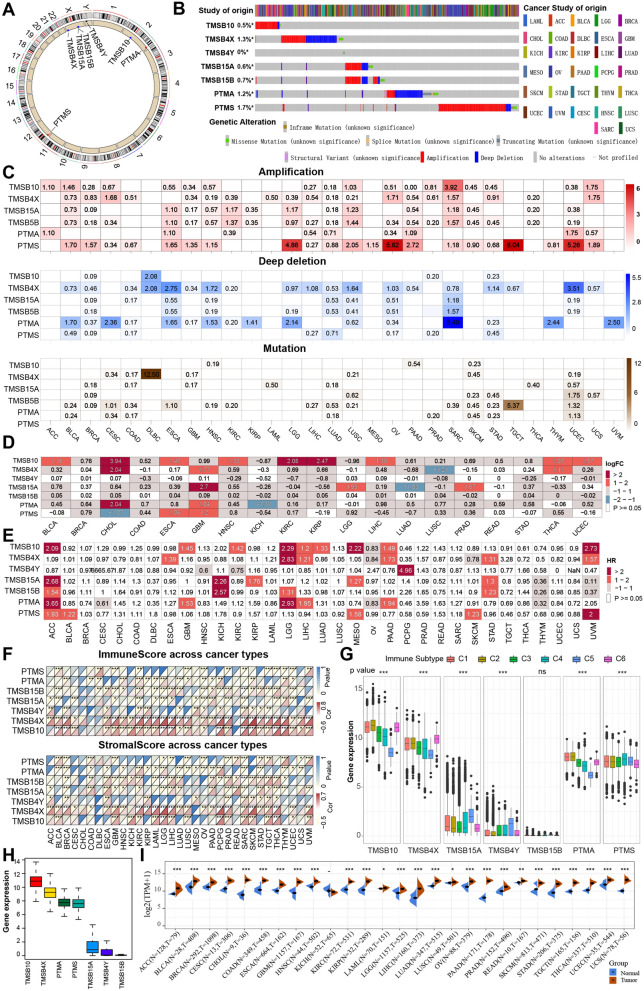
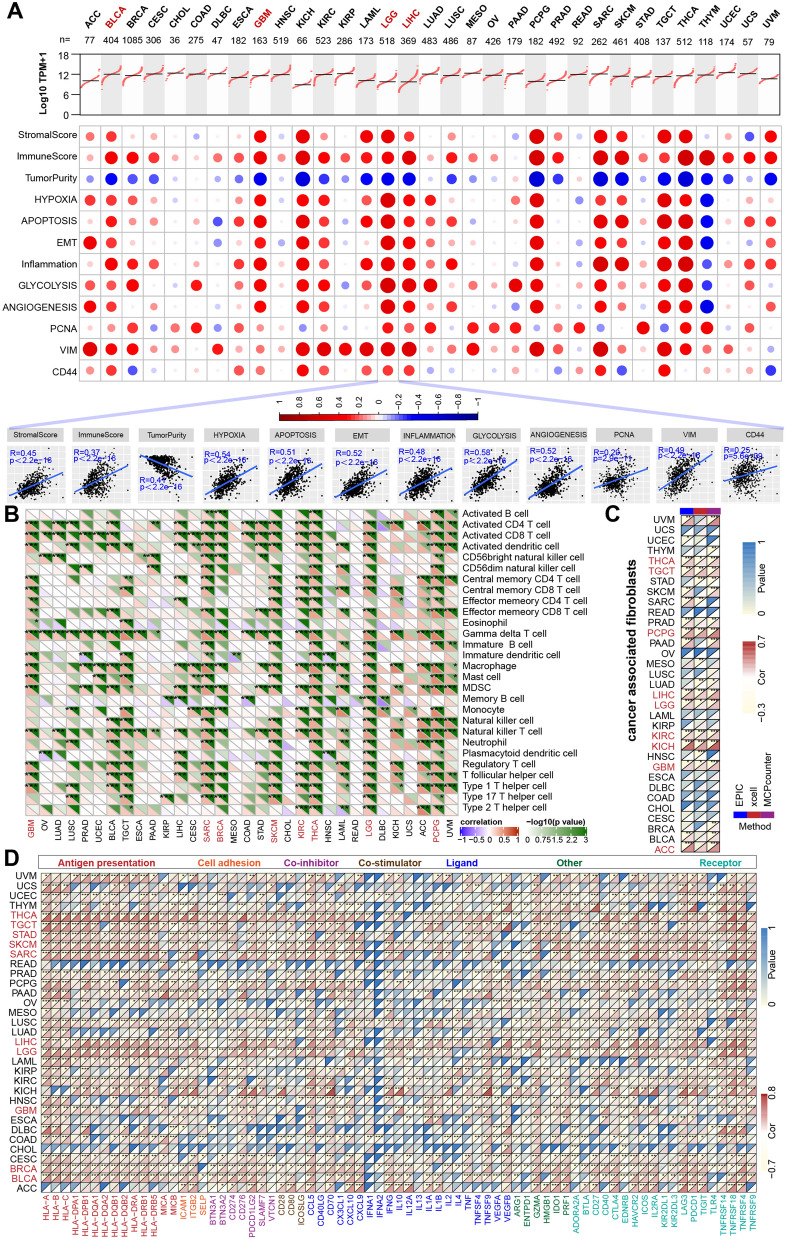
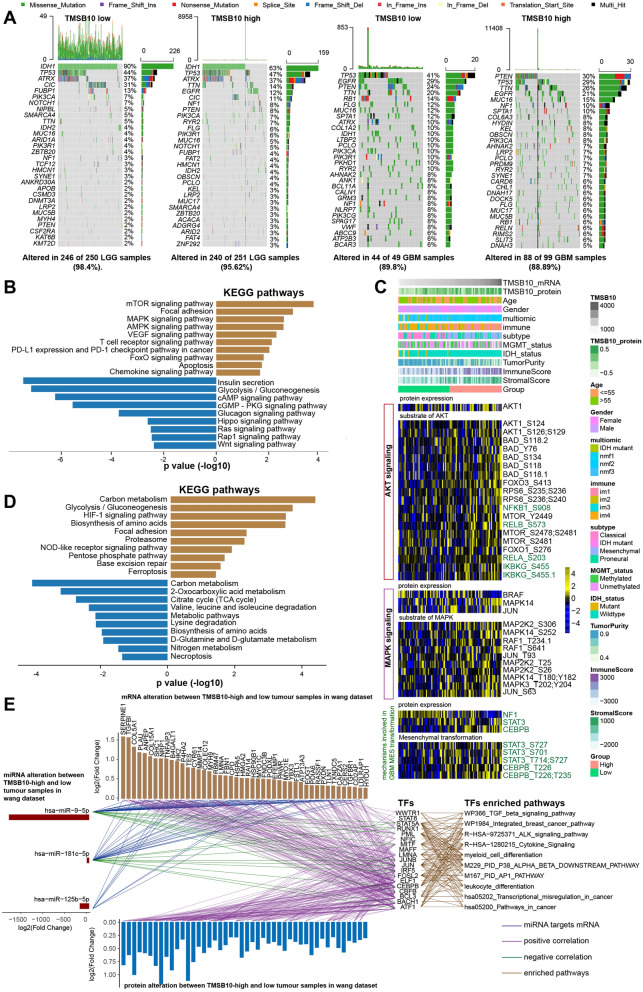
Methods: We performed a comprehensive analysis of TMSs and thymosin β10 (TMSB10) using multiomics data from more than 10,000 tumor samples of 33 cancer types from The Cancer Genome Atlas (TCGA). We used single-sample gene set enrichment analysis (ssGSEA) and the gene set variation analysis (GSVA) algorithm to investigate the differences in tumor microenvironment (TME) cell infiltration and functional annotation for individual tumor samples, respectively. The role of TMSB10 in the malignant progression of glioma, the promotion of macrophage infiltration,and immunosuppressive polarization, and the combination drug efficacy were assessed via biological function assays.

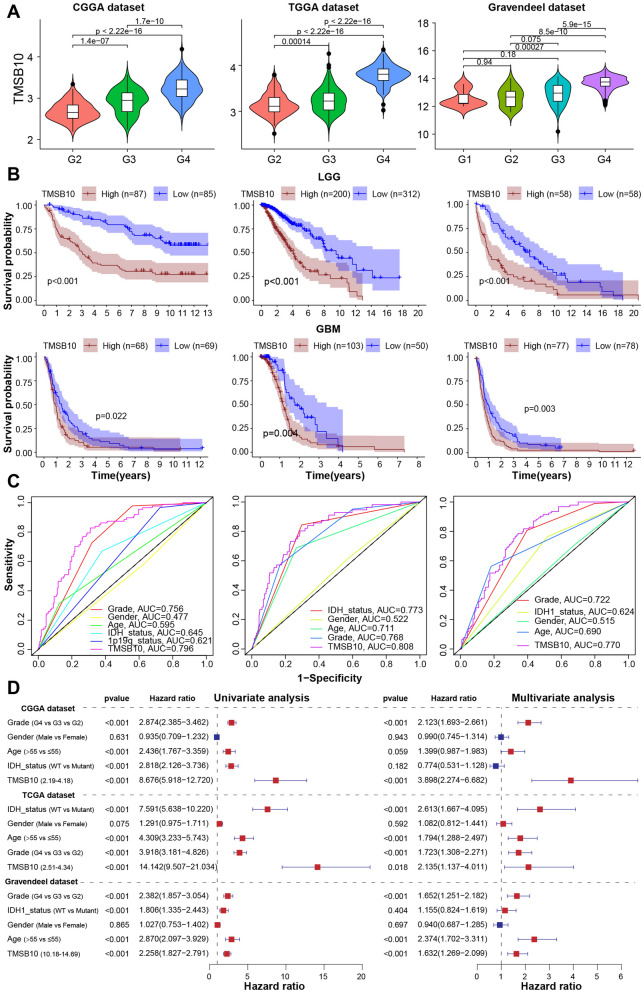
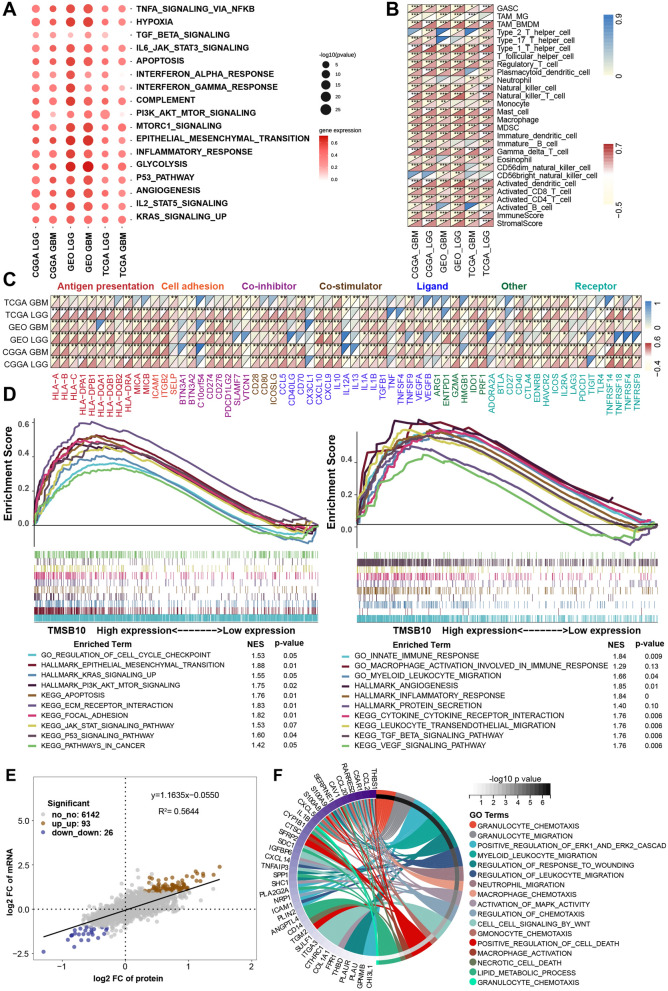
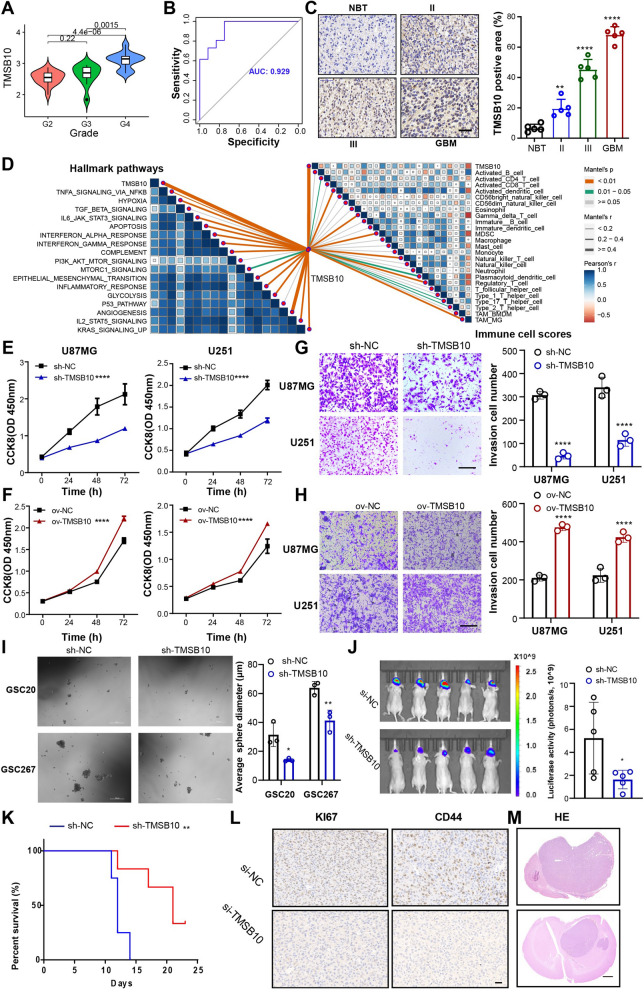
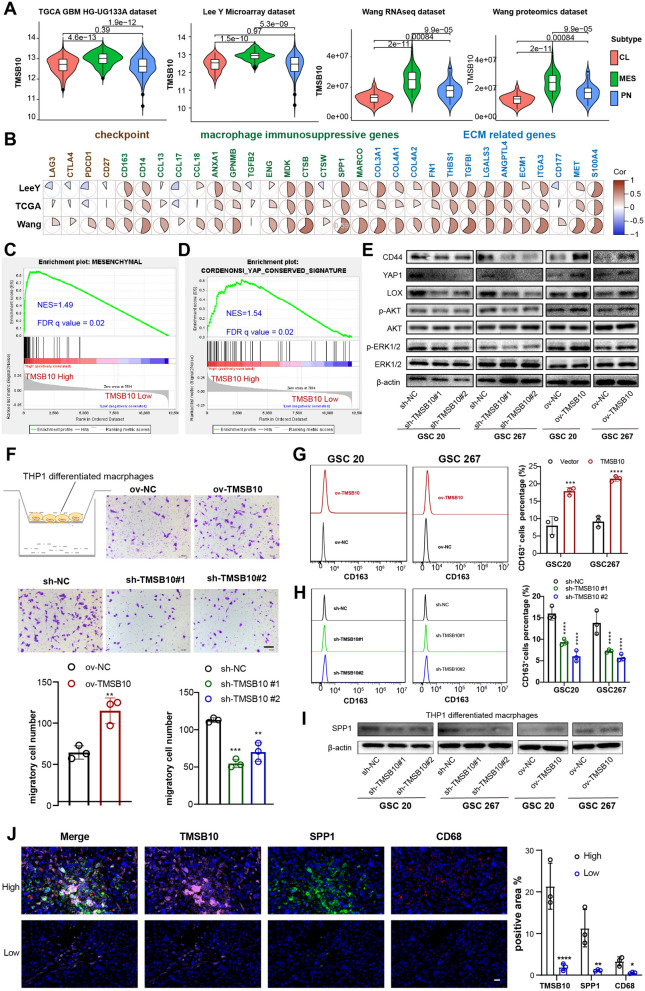
Results: We comprehensively assessed genomic mutations, expression dysregulation, prognosis and immunotherapeutic response across 33 human cancer samples and showed that TMSB10 is specifically overexpressed in almost all types of cancer tissues. Further pan-cancer analysis showed that TMSB10 is closely related to the biological function, immune regulation and prognosis of glioma. Similar results were also found in several public glioma cohorts and our Qilu local cohort. Further integration with other biological experiments revealed the key roles of TMSB10 in the malignant progression of glioma, the promotion of macrophage infiltration and immunosuppressive polarization. We also identified multiple drugs targeting cells with high TMSB10 expression and validated that knockdown of TMSB10 improved the efficacy of selumetinib (a MEK1/2 inhibitor approved by the FDA for the treatment of neurofibromatosis-associated tumors) and anti-PD1 treatment in glioma.

Conclusion: These results indicate that TMSB10 holds promise as a novel prognostic marker and therapeutic target, providing a theoretical basis for the development of more effective and targeted clinical treatment strategies for glioma patients.

Keywords: Glioma; Immune checkpoint blockade; Pancancer; TMSB10; Tumor microenvironment.


Conflict of interest statement

The authors declare that they have no competing interests.

Figures

Fig. 1
Fig. 1
Pancancer genomic alteration landscape, expression pattern, prognostic significance, and immunological correlation of the thymosin family. A The location of TMSs on 23 chromosomes. B Landscape of genomic aberrations in the TMSs in cancer. Each row represents a gene, and each column represents a patient. Only patients with genomic alterations in the indicated genes are shown. Alteration rates per TMS gene are displayed on the left. C Distribution of (up) mutation and (middle and down) CNA frequencies over cancer types. The darkness of color is proportional to the frequency. D Differential expression of TMS genes in 19 different cancer types. FC and p values were obtained by comparing normal tissue with the corresponding tumor tissue. Color is displayed only when P value < 0.05. Red indicates upregulation, while blue indicates downregulation. E Summary of Cox regression correlation of TMSs with survival. Color is displayed only when P value < 0.05. Red indicates worse survival. F Correlation between TMSB10 expression and (up) immune score, as well as (down) stromal score, across 33 cancer types. G Differences in the TMSs between six different immune molecular subtypes. The Kruskal–Wallis test was used to determine the significance of differences between the six immune molecular subtypes. H Box plot showing the distribution of sample-specific pathway scores across 33 cancer types. The median, interquartile range, and outliers are indicated. I The expression of TMSB10 between GTEx normal tissues and tumor tissues. The statistical significance is indicated as follows: ns > 0.05; *P < 0.05; **P < 0.01; ***P < 0.001
Fig. 2
Fig. 2
Pancancer expression pattern and biological and immunomodulatory function of TMSB10. A (Top) The distribution of sample-specific TMSB10 expression across each cancer type; (middle) bubble plots showing the correlation between TMSB10 and classical cancer pathways or genes. The color of the circle represents the correlation coefficient: red indicates a positive correlation, and blue indicates a negative correlation. (Down) The scatter plot shows the correlation between TMSB10 and classical cancer pathways or genes in LGG. Correlation between TMSB10 and B 28 tumor-associated immune cells calculated with the ssGSEA algorithm and correlation with (C) CAFs and D immunomodulators (immunoinhibitory, immunostimulatory and MHC molecules). The color indicates the correlation coefficient. The asterisks indicate a statistically significant p value calculated using Spearman correlation analysis. The statistical significance is indicated as follows: *P < 0.05; **P < 0.01; ***P < 0.001; ****P < 0.0001
Fig. 3
Fig. 3
Expression signature and prognostic value of TMSB10 in glioma. A The mRNA expression level of TMSB10 increased with tumor grade in the (left) CGGA, (middle) TCGA and (right) Gravendeel datasets. B Kaplan–Meier curves for the OS of (upper) LGG and (lower) GBM patients with high TMSB10 expression and low TMSB10 expression in three glioma datasets; the log-rank test was used to calculate the p value. C ROC curve showing that, among other clinical characteristics, the expression level of TMSB10 had the largest AUC in predicting the survival rate of glioma patients in three glioma datasets. D Univariate and multivariate analyses of TMSB10 expression and clinicopathological characteristics in three glioma datasets
Fig. 4
Fig. 4
Biological pathways and immunological characteristics of TMSB10 in glioma. A Spearman correlation analysis of TMSB10 and classical signaling pathways in three glioma cohorts. Red indicates positive correlations, and the darkness of color is proportional to the correlation coefficient. The size of the circle represents the statistical P value, with larger circles representing greater statistical significance. Correlation between TMSB10 expression and B the infiltration of 28 tumor-associated TME cells calculated with the ssGSEA algorithm and C immunomodulators. The color indicates the correlation coefficient. The asterisks indicate a statistically significant p value calculated using Spearman correlation analysis. D GSEA showing the (left) classical cancer-promoting pathways and (right) immune-related pathways in the high TMSB10 expression group. E Dot plot of the log2FC (mRNA expression) versus the log2FC (protein expression), showing a positive correlation between the overall mRNA and protein expression level (Pearson’s r = 0.6527) and the distribution of genes with significant changes in both the mRNA expression (|FC| > 2, P < 0.05) and corresponding protein expression (|FC| > 1.2, P < 0.05) in the high TMSB10 expression group compared with the low TMSB10 expression group. F GO BP enrichment analysis of 93 genes that were significantly upregulated at both the mRNA and protein levels. The statistical significance is shown as P < 0.05; **P < 0.01; ***P < 0.001
Fig. 5
Fig. 5
Multiomics regulatory profile of TMSB10 in glioma. A waterfall plot of the tumor somatic mutation landscape in the low-TMSB10 and high-TMSB10 samples in the TCGA-LGG (left) and GBM (right) datasets. Each bar represents the mutation information for an individual patient. The top bar plot shows TMB, and the numbers on the right indicate the mutation frequency of each gene. The bar plot on the right shows the proportion of each mutation type. B KEGG enrichment analysis of proteins with significantly different phosphorylation levels in GBM samples with high TMSB10 expression. The right represents the upregulated pathway, and the left represents the downregulated pathway. C Heatmap showing somatic mutation-based alterations in specific proteins and their downstream protein phosphorylation sites. Yellow represents a high level, and blue represents a low level. D KEGG enrichment analysis of proteins with significantly different acetylation levels in GBM samples with high TMSB10 expression. The right represents the upregulated pathway, and the left represents the downregulated pathway. E Interaction of TMSB10-associated miRNAs, mRNA, protein and transcription factor (TF). Upregulated mRNAs (claybank bars in the upper panel) and proteins (blue bars in the lower panel) in TMSB10-high GBM were positively correlated (purple lines) with the expression of 19 TFs (Pearson R > 0.5, p < 0.05). Downregulated miRNAs (red bars, left panel) negatively correlated (green lines) with TF expression (Pearson R< − 0.3, p < 0.05). The targeted pathways of TFs are listed in the panel to the right. The blue line indicates miRNA-targeted mRNAs
Fig. 6
Fig. 6
TMSB10 promotes the proliferation, migration and invasion of glioma cells in vitro and in vivo. A The mRNA expression level of TMSB10 increased with tumor grade in the Qilu dataset. B ROC curve showing that the expression level of TMSB10 had a high AUC in predicting the grade of glioma in the Qilu dataset. C IHC analysis showing TMSB10 protein expression in normal brain tissues (NBTs) and glioma tissues with different WHO grades. Histogram representing statistical data of IHC. The FTO-positive ratio was defined as the ratio of the FTO-positive area to the total area; n = 3. D Correlations between TMSB10 and the enrichment scores of (left) cancer hallmark pathways and (right) immune cells in the Qilu cohort. CCK-8 assays showing the proliferation ability of GBM cells transfected with (E) sh-NC or sh-TMSB10 and (F) ov-NC or ov-TMSB10; n = 3. G Representative Transwell migration and invasion assays showing the migration and invasion ability of GBM cells transfected with (G) sh-NC or sh-TMSB10 and (H) ov-NC or ov-TMSB10; scale bar, 200 μm. The quantification histogram represents the relative cell numbers. Data represent the mean ± SD from at least three independent experiments. I Representative tumor sphere formation images of GSCs transfected with sh-NC or sh-TMSB10; scale bar, 100 μm. The quantification histogram represents the average sphere diameter. Data represent the mean ± SD from at least three independent experiments. J Bioluminescent image showing the tumor size of mice implanted with luciferase-labeled U87MG cells expressing sh-TMSB10 or sh-NC at the indicated times. The quantification histogram represents the bioluminescent flux. Data represent the mean ± SD; n = 5 for each group. K Kaplan–Meier survival curves for mice implanted with luciferase-labeled U87MG cells expressing sh-TMSB10 or sh-NC. Log-rank analysis was used; n = 5 for each group. L Representative CD44 and KI67 immunohistochemistry images for a subgroup of animals sacrificed simultaneously in each group; n = 5 for each group, scale bar, 20 μm. M Representative H&E staining images for a subgroup of animals sacrificed simultaneously in each group; n = 5 for each group, scale bar, 10 μm. All data are presented as the mean ± SD. The statistical significance is shown as *P < 0.05; **P < 0.01; ****P < 0.0001
Fig. 7
Fig. 7
TMSB10 promotes GBM MES transformation and facilitates macrophage infiltration. A The mRNA or protein expression level of TMSB10 in different subtypes of GBM. B Correlation between TMSB10 and suppressive immunomodulators. The color indicates the correlation coefficient. GSEA showing the C MES signature and D CORDENONSI_YAP_CONSERVED_SIGNATURE in the high TMSB10 expression group in the TCGA GBM cohort. E Western blot assays showing the protein expression of CD44, YAP1, LOX, as well as phosphorylation levels of AKT and ERK1/2 in GSCs transfected with sh-NC or sh-TMSB10 and ov-NC or ov-TMSB10 as indicated. F (Top) Representative Transwell migration assays showing the chemotaxis capacity of human THP-1-differentiated macrophages by exposing them to CM from GSCs transfected with sh-NC or sh-TMSB10 and ov-NC or ov-TMSB10 as indicated. (Bottom) Quantification histogram representing relative cell numbers; n = 3, scale bar, 100 μm. G Representative flow cytometry histogram showing the proportion of CD163 + in THP-1 differentiated macrophages treated with CM from GSCs transfected with G sh-NC or sh-TMSB10 and H ov-NC or ov-TMSB10 as indicated. The quantification histogram represents the proportion of CD163 + differentiated THP-1 macrophages; n = 3. I Western blot assays showing the protein expression of SPP1 in THP-1 differentiated macrophages treated with CM from GSCs transfected with sh-NC or sh-TMSB10 and ov-NC or ov-TMSB10 as indicated. J Representative IF staining in a human glioma tissue microarray showed that the expression of SPP1 and CD68 was higher in the TMSB10-high group than in the TMSB10-low group. Histogram representing statistical proportion data of positive area. All data are presented as the mean ± SD. The statistical significance is shown as *P < 0.05; **P < 0.01; ***P < 0.001; ****P < 0.0001
Fig. 8
Fig. 8
TMSB10 could be a potential immunotherapy target for glioma patients, and knockdown of TMSB10 improves the efficacy of selumetinib and anti-PD1 in glioma. A Spearman’s correlation analysis between TMSB10 and the bioavailability (AUC) of the drugs that have undergone clinical trials or received FDA approval was collected from the CellMiner database (https://discover.nci.nih.gov/cellminer/). B Comparison of the estimated selumetinib AUC between the TMSB10-high group and the TMSB10 low group. C Animal experiment protocol design process. D Bioluminescent image showing the tumor size of mice coimplanted with THP-1 cells and luciferase-labeled GSC267 expressing sh-TMSB10 or sh-NC and treated with selumetinib (50 mg/ml) for the indicated times. The quantification histogram represents the bioluminescent flux. Data represent the mean ± SD; n = 5 for each group. E Kaplan–Meier survival curves showing the mice coimplanted with THP-1 cells and luciferase-labeled GSCs expressing sh-TMSB10 or sh-NC and treated with selumetinib (50 mg/ml). Log-rank analysis was used; n = 5 for each group. F Expression of TMSB10 in distinct anti-PD1 clinical response groups. G The proportion of patients who responded to anti-PD1 immunotherapy in the low or high TMSB10 expression groups. R, response; NR, no response. H ROC curve quantifying the predictive value of TMSB10 in GBM patients treated with anti-PD1 therapy (AUC, 0.757). Kaplan–Meier curves for (I) the OS of GBM patients (log-rank test P = 0.027) and J survival duration after anti-PD1 treatment (log-rank test P < 0.001 in the PD1 dataset. K GBOs at 1 week were cocultured with CM from GSC 267 cells, transfected with sh-TMSB10 or sh-NC, and treated with PD1 antibody (5 µM) and/or selumetinib (7.5 µM) for 5 days as indicated. IF staining for KI67 and CD44 in GBO sections showed that knockdown of TMSB10 enhanced the effect of anti-PD1 and selumetinib therapy; scale bars: 10 μm. Histogram representing statistical data for proportion of positive area; n = 3 for each group. All data are presented as the mean ± SD. The statistical significance is shown as follows: ns > 0.05; *P < 0.05; **P < 0.01; ***P < 0.001; ****P < 0.0001

Similar articles

Cited by

References

    1. Hall AK, Chen SC, Hempstead JL, Morgan JI. Retinoic acid regulates thymosin beta 10 levels in rat neuroblastoma cells. J Neurochem. 1991;56(2):462–8. doi: 10.1111/j.1471-4159.1991.tb08173.x. - DOI - PubMed
    1. Erickson-Viitanen S, Horecker BL. Thymosin β11: a peptide from trout liver homologous to thymosin β4. Arch Biochem Biophys. 1984;233(2):815–20. doi: 10.1016/0003-9861(84)90510-1. - DOI - PubMed
    1. Chen C, Li M, Yang H, Chai H, Fisher W, Yao Q. Roles of thymosins in cancers and other organ systems. World J Surg. 2005;29(3):264–70. doi: 10.1007/s00268-004-7817-2. - DOI - PubMed
    1. Cha HJ, Jeong MJ, Kleinman HK. Role of thymosin beta4 in tumor metastasis and angiogenesis. J Natl Cancer Inst. 2003;95(22):1674–80. doi: 10.1093/jnci/djg100. - DOI - PubMed
    1. Wirsching HG, Krishnan S, Florea AM, Frei K, Krayenbuhl N, Hasenbach K, Reifenberger G, Weller M, Tabatabai G. Thymosin beta 4 gene silencing decreases stemness and invasiveness in glioblastoma. Brain. 2014;137(Pt 2):433–48. doi: 10.1093/brain/awt333. - DOI - PubMed