

Comparative physiological and coexpression network analyses reveal the potential drought tolerance mechanism of peanut
- PMID: 36162997
- PMCID: PMC9511739
- DOI: 10.1186/s12870-022-03848-7
Comparative physiological and coexpression network analyses reveal the potential drought tolerance mechanism of peanut
Abstract
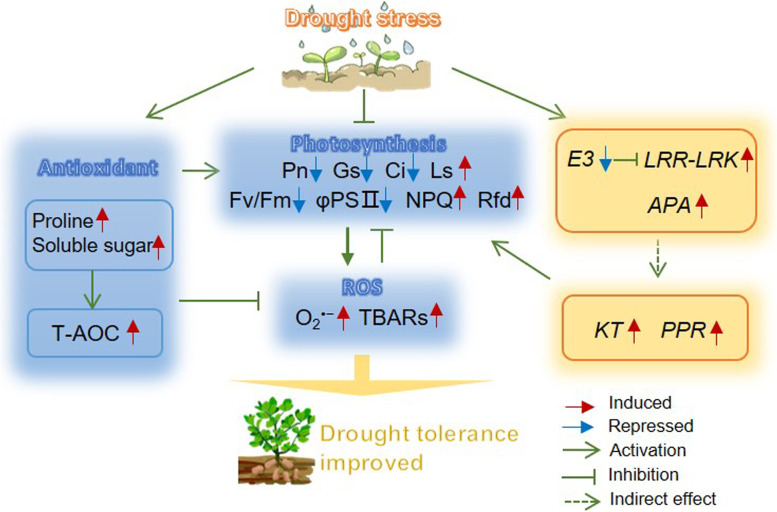
Background: Drought stress has negative effects on plant growth and productivity. In this study, a comprehensive analysis of physiological responses and gene expression was performed. The responses and expressions were compared between drought-tolerant (DT) and drought-sensitive (DS) peanut varieties to investigate the regulatory mechanisms and hub genes involved in the impact of drought stress on culture.
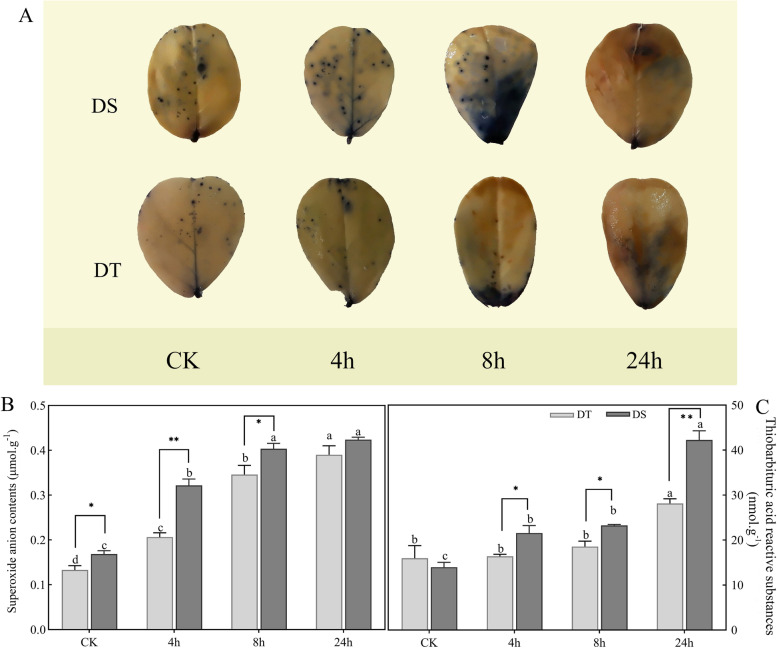
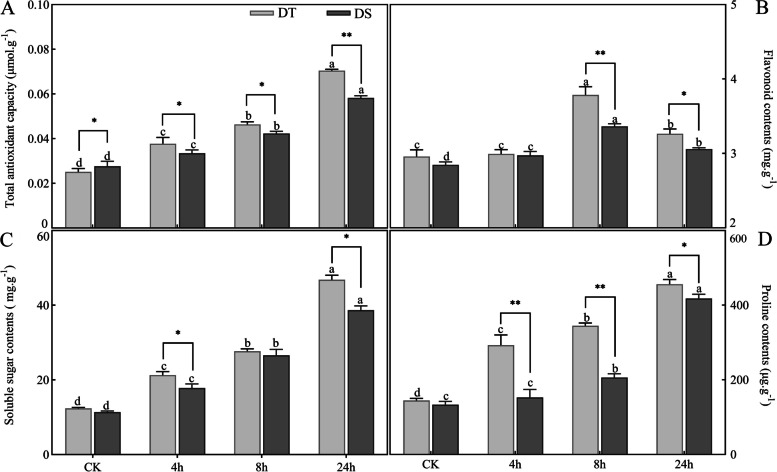
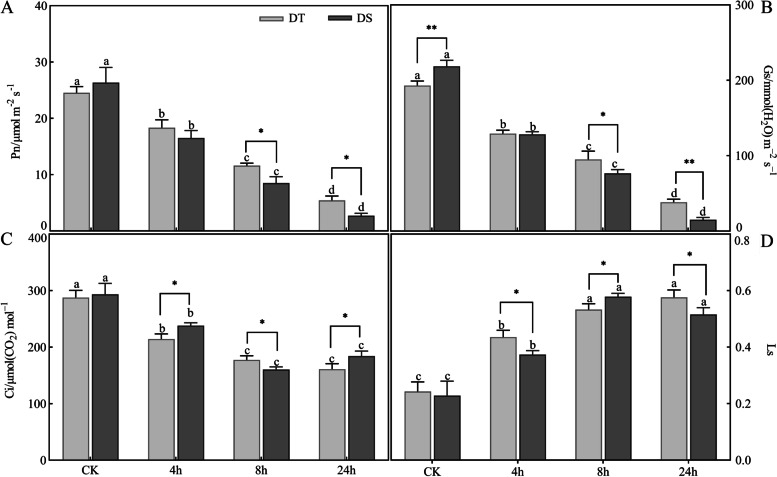
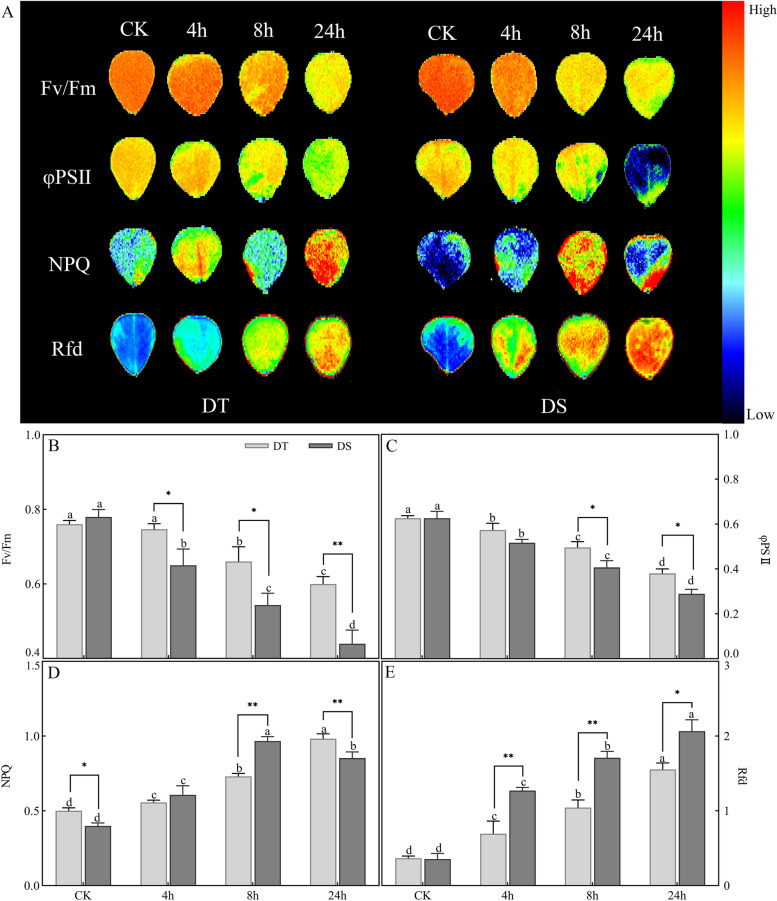
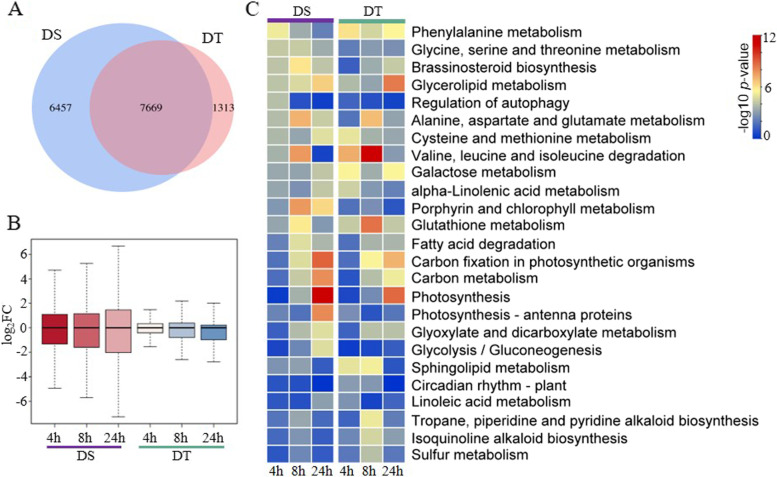
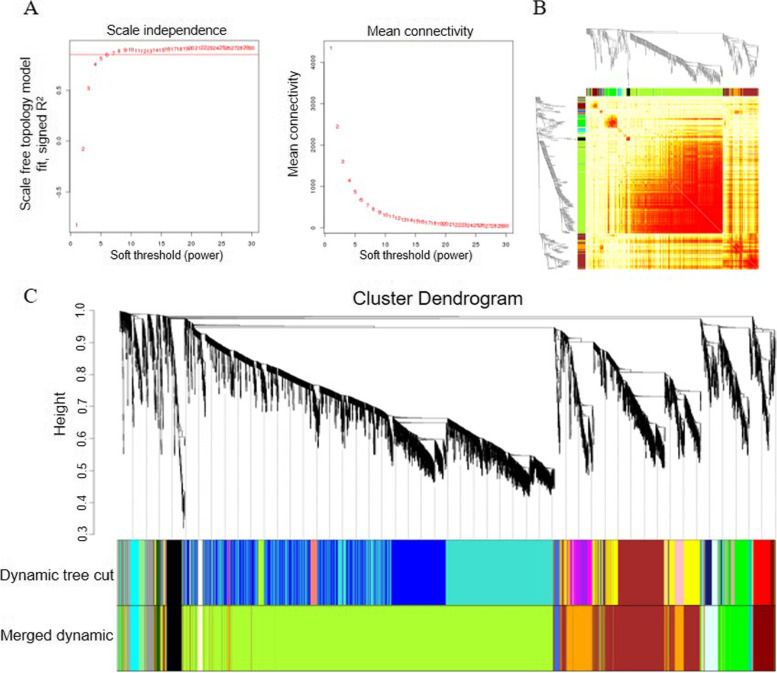
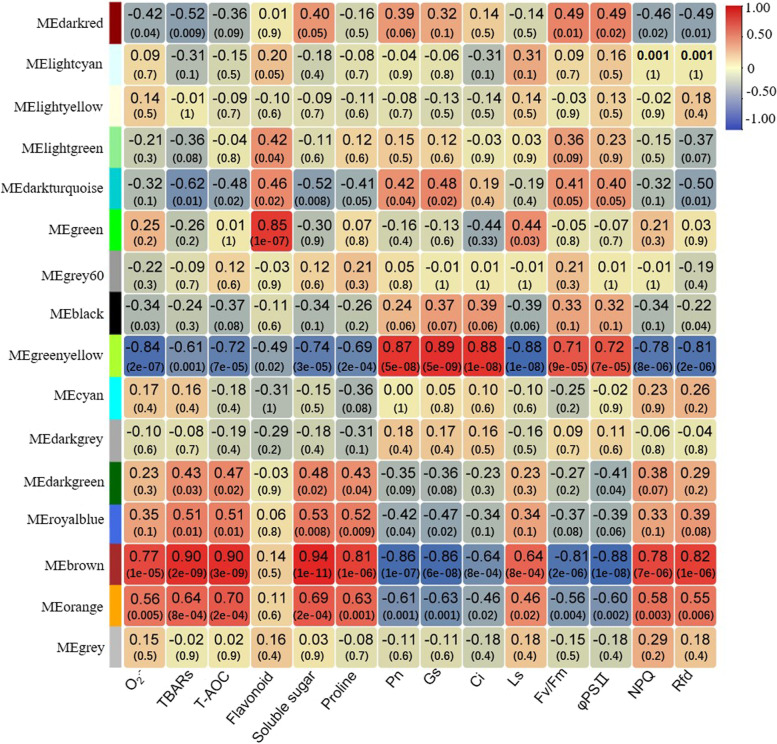
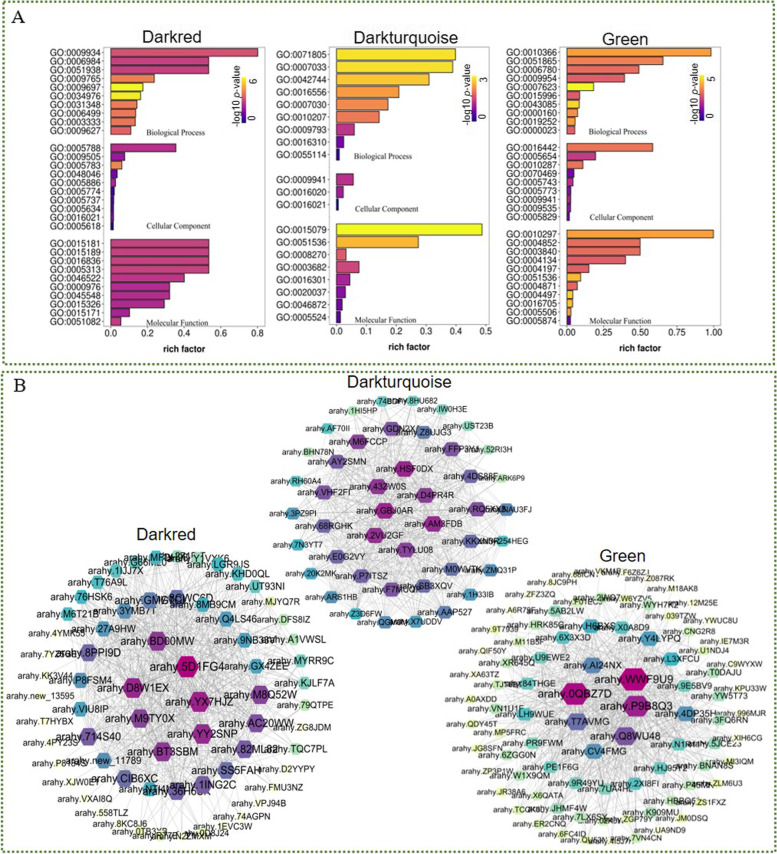
Results: The drought-tolerant variety had robust antioxidative capacities with higher total antioxidant capacity and flavonoid contents, and it enhanced osmotic adjustment substance accumulation to adapt to drought conditions. KEGG analysis of differentially expressed genes demonstrated that photosynthesis was strongly affected by drought stress, especially in the drought-sensitive variety, which was consistent with the more severe suppression of photosynthesis. The hub genes in the key modules related to the drought response, including genes encoding protein kinase, E3 ubiquitin-protein ligase, potassium transporter, pentatricopeptide repeat-containing protein, and aspartic proteinase, were identified through a comprehensive combined analysis of genes and physiological traits using weighted gene co-expression network analysis. There were notably differentially expressed genes between the two varieties, suggesting the positive roles of these genes in peanut drought tolerance.
Conclusion: A comprehensive analysis of physiological traits and relevant genes was conducted on peanuts with different drought tolerances. The findings revealed diverse drought-response mechanisms and identified candidate genes for further research.
Keywords: Drought stress; O2 •− /TBARs accumulation; Peanut; Transcriptional regulation; WGCNA.
© 2022. The Author(s).
Conflict of interest statement
The authors declare that they have no competing interests.
Figures
Similar articles
-
Comparative transcriptome analysis of genes involved in the drought stress response of two peanut (Arachis hypogaea L.) varieties.BMC Plant Biol. 2021 Jan 27;21(1):64. doi: 10.1186/s12870-020-02761-1. BMC Plant Biol. 2021. PMID: 33504328 Free PMC article.
-
Transcriptome analysis provides insights into the stress response in cultivated peanut (Arachis hypogaea L.) subjected to drought-stress.Mol Biol Rep. 2023 Aug;50(8):6691-6701. doi: 10.1007/s11033-023-08563-6. Epub 2023 Jun 28. Mol Biol Rep. 2023. PMID: 37378750
-
Time-course transcriptome and WGCNA analysis revealed the drought response mechanism of two sunflower inbred lines.PLoS One. 2022 Apr 1;17(4):e0265447. doi: 10.1371/journal.pone.0265447. eCollection 2022. PLoS One. 2022. PMID: 35363798 Free PMC article.
-
Comparative transcriptome and coexpression network analysis reveals key pathways and hub candidate genes associated with sunflower (Helianthus annuus L.) drought tolerance.BMC Plant Biol. 2024 Mar 27;24(1):224. doi: 10.1186/s12870-024-04932-w. BMC Plant Biol. 2024. PMID: 38539093 Free PMC article.
-
Transcriptional regulatory networks in response to drought stress and rewatering in maize (Zea mays L.).Mol Genet Genomics. 2021 Nov;296(6):1203-1219. doi: 10.1007/s00438-021-01820-y. Epub 2021 Oct 3. Mol Genet Genomics. 2021. PMID: 34601650 Review.
Cited by
-
The genus Arachis: an excellent resource for studies on differential gene expression for stress tolerance.Front Plant Sci. 2023 Oct 30;14:1275854. doi: 10.3389/fpls.2023.1275854. eCollection 2023. Front Plant Sci. 2023. PMID: 38023864 Free PMC article. Review.
-
Genome-wide analysis reveals regulatory mechanisms and expression patterns of TGA genes in peanut under abiotic stress and hormone treatments.Front Plant Sci. 2023 Nov 21;14:1269200. doi: 10.3389/fpls.2023.1269200. eCollection 2023. Front Plant Sci. 2023. PMID: 38078104 Free PMC article.
-
The transcriptional regulatory network of hormones and genes under salt stress in tomato plants (Solanum lycopersicum L.).Front Plant Sci. 2023 Feb 6;14:1115593. doi: 10.3389/fpls.2023.1115593. eCollection 2023. Front Plant Sci. 2023. PMID: 36814758 Free PMC article.
-
Impact of Cd and Pb on the photosynthetic and antioxidant systems of Hemerocallis citrina Baroni as revealed by physiological and transcriptomic analyses.Plant Cell Rep. 2024 Sep 4;43(9):226. doi: 10.1007/s00299-024-03312-w. Plant Cell Rep. 2024. PMID: 39227493
References
-
- Dai A. Increasing drought under global warming in observations and models. Nat Clim Chang. 2013;3(1):52–58. doi: 10.1038/nclimate1633. - DOI
MeSH terms
Substances
LinkOut - more resources
Full Text Sources
