Quantitative Expression of SFN, lncRNA CCDC18-AS1, and lncRNA LINC01343 in Human Breast Cancer as the Regulator Biomarkers in a Novel ceRNA Network: Based on Bioinformatics and Experimental Analyses
- PMID: 36160032
- PMCID: PMC9484965
- DOI: 10.1155/2022/6787791
Quantitative Expression of SFN, lncRNA CCDC18-AS1, and lncRNA LINC01343 in Human Breast Cancer as the Regulator Biomarkers in a Novel ceRNA Network: Based on Bioinformatics and Experimental Analyses
Abstract
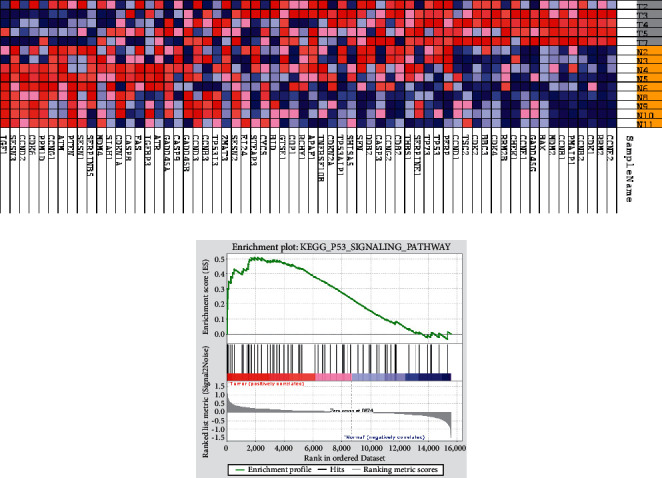
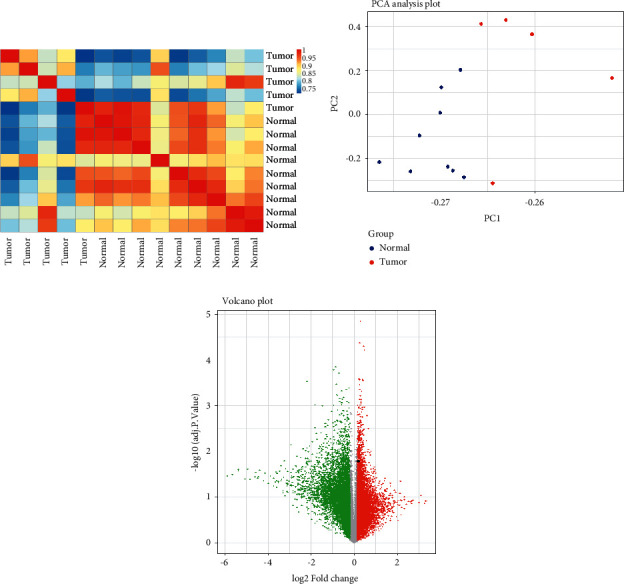
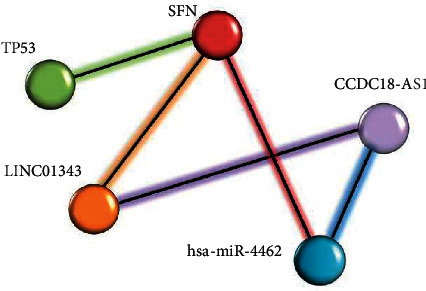
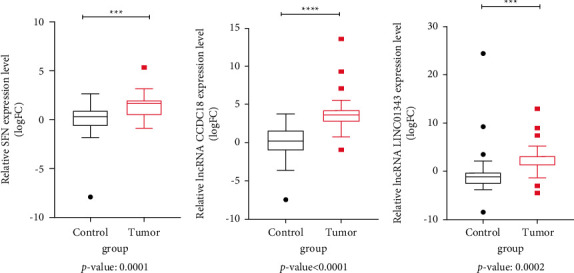
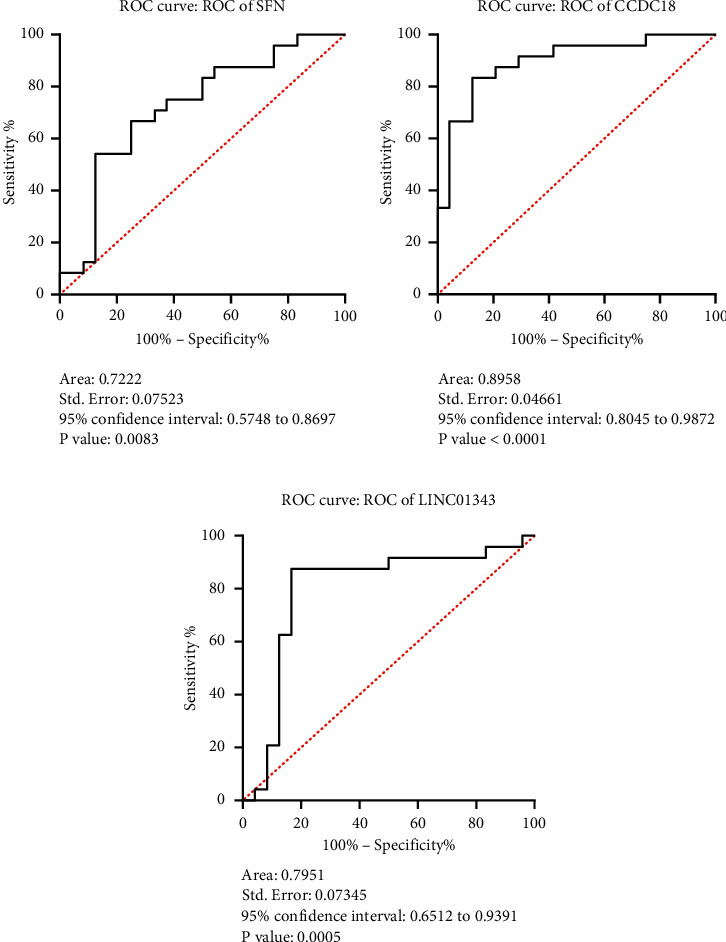
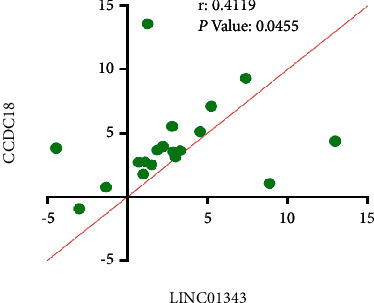
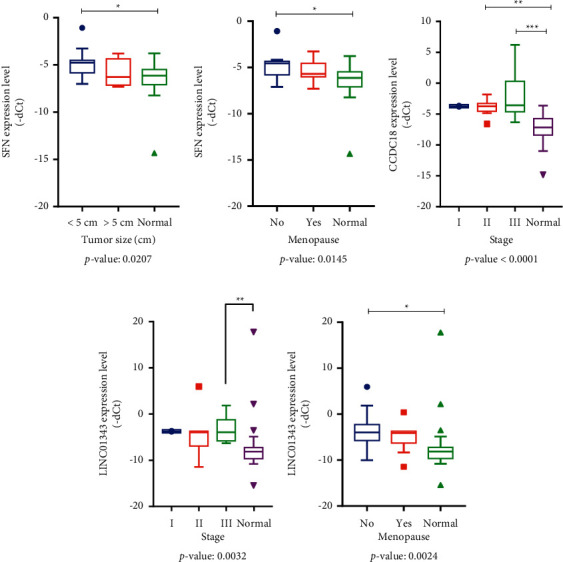
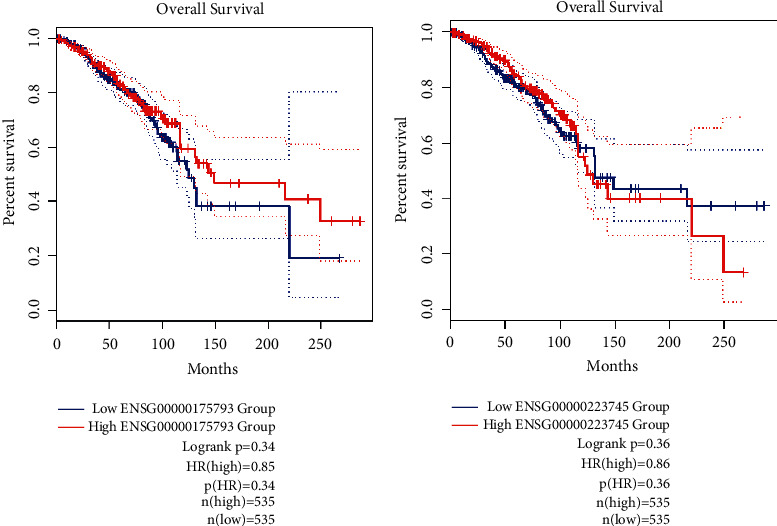
Breast cancer (BC) is one of the leading cancers in the world, which has become an increasing serious problem. In this context, reports demonstrate that some long noncoding RNAs (lncRNAs) play significant regulatory roles in breast tumorigenesis and BC progression via various pathways and act as endogenous RNAs. Finding their dysregulation in cancer and evaluating their interaction with other molecules, such as short noncoding RNAs "microRNA (miRNAs)" as well as various genes, are the most important parts in cancer diagnostics. In this study, after performing GSEA and microarray analysis on the GSE71053 dataset, a new ceRNA network of CCDC18-AS1, LINC01343, hsa-miR4462, and SFN in BC was detected by bioinformatics analysis. Therefore, the expression of SFN, CCDC18-AS1, and LINC01343 was quantitatively measured in 24 BC and normal paired tissues using qRT-PCR. CCDC18-AS1, LINC01343, and SFN were expressed higher in BC than in the control (normal paired) tissues based on qRT-PCR data. Furthermore, a significant positive correlation was observed between CCDC18-AS1 and LINC01343 expression in the samples investigated in this study. The investigation of clinicopathological parameters showed that SFN was highly expressed in tumor size of <5 cm and in nonmenopausal ages, while CCDC18-AS1 and LINC01343 indicated a high expression in stages II-III and III of BC, respectively. The overall survival analysis displayed high and low survival in patients with high expression of SFN and CCDC18-AS1, respectively. The ROC curve analysis disclosed that SFN, CCDC18-AS1, and LINC01343 might be suggested as potential biological markers in BC patients. The high expression of CCDC18-AS1, LINC01343, and SFN in BC samples suggests their potential role in BC tumorigenesis and could be considered hallmarks for the diagnosis and prognosis of BC, although this will require further clinical investigations.
Copyright © 2022 Mehrnoush Rishehri et al.
Conflict of interest statement
The authors declare that there are no conflicts of interest.
Figures
Similar articles
-
Systematic analysis of lncRNA-miRNA-mRNA competing endogenous RNA network identifies four-lncRNA signature as a prognostic biomarker for breast cancer.J Transl Med. 2018 Sep 27;16(1):264. doi: 10.1186/s12967-018-1640-2. J Transl Med. 2018. PMID: 30261893 Free PMC article.
-
JHDM1D-AS1-driven inhibition of miR-940 releases ARTN expression to induce breast carcinogenesis.Clin Transl Oncol. 2023 Jul;25(7):2192-2203. doi: 10.1007/s12094-023-03102-y. Epub 2023 Mar 2. Clin Transl Oncol. 2023. PMID: 36862282
-
Expression profiles and functional prediction of long non-coding RNAs LINC01133, ZEB1-AS1 and ABHD11-AS1 in the luminal subtype of breast cancer.J Transl Med. 2021 Aug 26;19(1):364. doi: 10.1186/s12967-021-03026-7. J Transl Med. 2021. PMID: 34446052 Free PMC article.
-
Identification of MFI2-AS1, a Novel Pivotal lncRNA for Prognosis of Stage III/IV Colorectal Cancer.Dig Dis Sci. 2020 Dec;65(12):3538-3550. doi: 10.1007/s10620-020-06064-1. Epub 2020 Jan 20. Dig Dis Sci. 2020. PMID: 31960204 Review.
-
The Emerging Role of Thymopoietin-Antisense RNA 1 as Long Noncoding RNA in the Pathogenesis of Human Cancers.DNA Cell Biol. 2021 Jul;40(7):848-857. doi: 10.1089/dna.2021.0024. Epub 2021 Jun 4. DNA Cell Biol. 2021. PMID: 34096793 Review.
Cited by
-
A novel autophagy-related long non-coding RNAs prognostic risk score for clear cell renal cell carcinoma.BMC Urol. 2022 Dec 10;22(1):203. doi: 10.1186/s12894-022-01148-8. BMC Urol. 2022. PMID: 36496360 Free PMC article.
-
miRNAs as Interconnectors between Obesity and Cancer.Noncoding RNA. 2024 Apr 15;10(2):24. doi: 10.3390/ncrna10020024. Noncoding RNA. 2024. PMID: 38668382 Free PMC article. Review.
-
Multi-omics approach for identifying CNV-associated lncRNA signatures with prognostic value in prostate cancer.Noncoding RNA Res. 2023 Oct 10;9(1):66-75. doi: 10.1016/j.ncrna.2023.10.001. eCollection 2024 Mar. Noncoding RNA Res. 2023. PMID: 38075203 Free PMC article.
-
Identification and validation of a cellular senescence-related lncRNA signature for prognostic prediction in patients with multiple myeloma.Cell Cycle. 2023 Jun;22(12):1434-1449. doi: 10.1080/15384101.2023.2213926. Epub 2023 May 25. Cell Cycle. 2023. PMID: 37227248 Free PMC article.
-
Analysis of Long Noncoding RNAs-Related Regulatory Mechanisms in Duchenne Muscular Dystrophy Using a Disease-Related lncRNA-mRNA Pathway Network.Genet Res (Camb). 2022 Dec 14;2022:8548804. doi: 10.1155/2022/8548804. eCollection 2022. Genet Res (Camb). 2022. PMID: 36619896 Free PMC article.
References
-
- Abdollahzadeh R., Daraei A., Mansoori Y., Sepahvand M., Amoli M. M., Tavakkoly-Bazzaz J. Competing endogenous RNA (ceRNA) cross talk and language in ceRNA regulatory networks: a new look at hallmarks of breast cancer. Journal of Cellular Physiology . 2019;234(7):10080–10100. doi: 10.1002/jcp.27941. - DOI - PubMed
MeSH terms
Substances
LinkOut - more resources
Full Text Sources
Medical
Research Materials
Miscellaneous