. 2022 Sep 9:13:972003.
doi: 10.3389/fimmu.2022.972003. eCollection 2022.

Maturation of circulating Ly6ChiCCR2+ monocytes by mannan-MOG induces antigen-specific tolerance and reverses autoimmune encephalomyelitis

Affiliations

Maturation of circulating Ly6ChiCCR2+ monocytes by mannan-MOG induces antigen-specific tolerance and reverses autoimmune encephalomyelitis

Anastasia Dagkonaki et al. Front Immunol. .

Abstract

Autoimmune diseases affecting the CNS not only overcome immune privilege mechanisms that protect neural tissues but also peripheral immune tolerance mechanisms towards self. Together with antigen-specific T cells, myeloid cells are main effector cells in CNS autoimmune diseases such as multiple sclerosis, but the relative contributions of blood-derived monocytes and the tissue resident macrophages to pathology and repair is incompletely understood. Through the study of oxidized mannan-conjugated myelin oligodendrocyte glycoprotein 35-55 (OM-MOG), we show that peripheral maturation of Ly6ChiCCR2+ monocytes to Ly6ChiMHCII+PD-L1+ cells is sufficient to reverse spinal cord inflammation and demyelination in MOG-induced autoimmune encephalomyelitis. Soluble intradermal OM-MOG drains directly to the skin draining lymph node to be sequestered by subcapsular sinus macrophages, activates Ly6ChiCCR2+ monocytes to produce MHC class II and PD-L1, prevents immune cell trafficking to spinal cord, and reverses established lesions. We previously showed that protection by OM-peptides is antigen specific. Here, using a neutralizing anti-PD-L1 antibody in vivo and dendritic cell-specific Pdl1 knockout mice, we further demonstrate that PD-L1 in non-dendritic cells is essential for the therapeutic effects of OM-MOG. These results show that maturation of circulating Ly6ChiCCR2+ monocytes by OM-myelin peptides represents a novel mechanism of immune tolerance that reverses autoimmune encephalomyelitis.

Keywords: EAE; MDSC; PD-L1, Cre/loxP mouse; demyelination; immunotherapy; monocyte maturation; multiple sclerosis.


Conflict of interest statement

M-EA was employed by the company Vianex S.A. The remaining authors declare that the research was conducted in the absence of any commercial or financial relationships that could be construed as a potential conflict of interest.

Figures

Figure 1
Figure 1
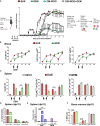
Ly6Chi and Ly6G+ myeloid cells expand in the blood and spleen in response to immunization. (A) Time-course of CD11b+, Ly6Chi and Ly6G+ myeloid cell expansion in blood of CFA and EAE immunized mice (n=2 at day 0 and n=4-5/group/time-point). Arrows indicate the days of onset (o) and peak (p) of clinical symptoms in the EAE mice. (B) Gating strategy of CD11b+ sub-populations in spleens of naïve and EAE mice at the peak of clinical symptoms (dpi 18). (C) Time-course of CD11b+, Ly6Chi and Ly6G+ myeloid cell expansion in spleens of CFA and EAE immunized mice (n=3-4/group/time-point). Arrows indicate the days of onset (o) and peak (p) of clinical symptoms in the EAE mice. (D) Proportions of MHCII- and MHCII+ splenocytes within the Ly6Chi and Ly6G+ subpopulations in CFA and EAE immunized mice at the peak of clinical symptoms (dpi 18) (n=3/group). Data and statistical analysis are derived from one experiment in each case (one for A, C, one for B, D). Statistical significance is shown after pairwise comparisons between groups using Student’s t test (A, C) or multiple comparisons using one-way ANOVA followed by Tukey’s post hoc test (D) (*p ≤ 0.05, **p ≤ 0.01, ***p ≤ 0.001).
Figure 2
Figure 2
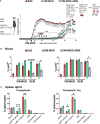
Gemcitabine transiently delays EAE onset and extends protection by OM-MOG. (A) Schematic representation of the experimental approach and the time points of injection of OM-MOG and gemcitabine (GEM) in the EAE mice. Mean clinical scores of EAE mice after long-term prophylactic administration of OM-MOG (days -45, -30, -15 relative to immunization for EAE, upward arrows) and pre-onset administration of GEM (dpi 6 and 10, downward arrows) (n=6-7/group). (B) Time-course of CD11b+, Ly6Chi and Ly6G+ myeloid cell expansion in blood of EAE mice untreated or treated with GEM (dpi 6 and 10; arrows) (n=2 at day 0 and n=4-5 mice/group/time-point). (C) Time-course of CD11b+, Ly6Chi and Ly6G+ myeloid cell expansion in spleens of EAE mice untreated or treated with GEM (dpi 6, 10 and 17; arrows) (n=2-3/group/time-point). (D) Proportions of different populations of myeloid cells, including CD11b+CD11c-, CD11b+CD11c+ (myeloid DC) and CD11b-CD11c+ DC cells, in spleens of EAE mice untreated or treated with GEM shown in C, at dpi 11 (n=2-3/group). (E) T cell proliferation responses to MOG or anti-mouse CD3e in spleens of EAE mice untreated or treated with GEM shown in C, at dpi 11 (n=2-3/group). Data are expressed as division index (total number of divisions/cells at start of culture). (F) Proportions of CD11b+, Ly6Chi and Ly6G+ myeloid cells in bone marrow of EAE mice untreated or treated with GEM shown in C, at dpi 11, and naïve mice (n=2-3/group). Data and statistical analysis are derived from one experiment in each case (one for A, one for B–F). Statistical significance is shown after comparisons to the vehicle (EAE) group using Mann-Whitney test (A), or pairwise comparisons between groups using Student’s t test (B–D, F) or Student’s t test followed by Bonferroni post hoc test (E) (*p ≤ 0.05, **p ≤ 0.01, ***p ≤ 0.001).
Figure 3
Figure 3
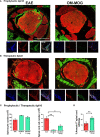
OM-MOG retains Ly6Chi monocytes in the periphery during the induction of EAE. (A) Schematic representation of the experimental approach and the time points of injection of OM-MOG and gemcitabine (GEM) in the EAE mice. Mean clinical scores of EAE mice after short-term prophylactic administration of OM-MOG (dpi 7, 11 and 14, upward arrows) and post-onset administration of GEM (dpi 14 and every 2 days, downward arrows) (n=6-8/group). (B) Time-course of Ly6Chi and Ly6G+ cell expansion in blood of EAE mice untreated or treated with GEM, as shown in A (n= 3-4/group/time-point). (C) Proportions of CD11b+, Ly6Chi, Ly6G+, CD11b+CD11c+ (myeloid DC) and CD11b-CD11c+ (DC) myeloid cells and CD4+ T cells in spleen of EAE mice after short-term prophylactic (as shown in A., left panel) or therapeutic (24 h post-injection, right panel) administration of vehicle or OM-MOG, at peak of disease in the vehicle mice (dpi 16) (n=8 for EAE and n=4 for OM-MOG). Data and statistical analysis are derived from one experiment in each case (one for A, B, one for C). Statistical significance is shown after comparison to the vehicle (EAE) group using Mann-Whitney test (A), one-way ANOVA followed by Tukey’s post hoc test (B), or Student’s t test (C) (*p ≤ 0.05, **p ≤ 0.01, ***p ≤ 0.001).
Figure 4
Figure 4
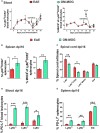
OM-MOG prevents and reverses immune cell infiltration and demyelinating lesions in the spinal cord during EAE. (A) Whole mount spinal cord sections with surrounding meninges and vertebrae prepared from EAE mice after short-term prophylactic administration of vehicle or OM-MOG (dpi 7, 11 and 14) at peak of disease in the EAE group (dpi 18), and immunostained with anti-MBP for myelin (red) and anti-CD45 for immune infiltrates (green) (low power photomicrographs), or anti-laminin for blood brain barrier (LAM; red), anti-CD45 (green) and DAPI (blue) (high power photomicrographs). Representative images from 1 of 3 mice/group. Scale bars 500 μM (upper low-power images) and 100 μM (lower high-power images). (B) Whole mount spinal cord sections prepared from mice with ongoing EAE (dpi 22) after therapeutic treatment with 4 injections of vehicle or OM-MOG starting at clinical score 2, and immunostained with anti-MBP for myelin (red) and anti-CD45 for immune infiltrates (green) (low power magnification), or anti-laminin for blood brain barrier (LAM; red), anti-CD45 (green) and DAPI (blue) (high power magnification). Representative images from 1 of 3 mice/group. (C) Total numbers of splenocytes and CNS-infiltrating mononuclear cells recovered from spinal cords of EAE mice at disease peak (dpi 16) after short-term prophylactic administration, as in A (OM-MOG P), or 24 h after 1 therapeutic injection of vehicle or OM-MOG (OM-MOG T, 1 inj) (n=8 for EAE and n=4 for OM-MOG). (D) Proportions of Annexin V+ CNS- infiltrating mononuclear cells recovered from spinal cords of EAE mice at disease peak (dpi 14) 24 hours after 1 therapeutic injection of vehicle (EAE) or OM-MOG (OM-MOG T, 1 inj) (n=4-5/group). Data and statistical analysis are derived from one experiment in each case (A–C) or one representative of two experiments (D). Statistical significance is shown after comparison to the vehicle (EAE) group using one-way ANOVA followed by Tukey’s post hoc test (C), or Student’s t test (D) (*p ≤ 0.05, **p ≤ 0.01).
Figure 5
Figure 5
Therapeutic OM-MOG alternatively activates and retains Ly6ChiCCR2+ monocytes in the periphery of EAE mice, while inhibiting infiltration of the spinal cord. (A) Time-course of proportions of Ly6ChiCCR2+ monocytes (left graph) and Ly6ChiCCR2+ monocytes expressing MHCII (right graph) in blood of EAE mice treated therapeutically with vehicle or OM-MOG from dpi 15 (arrow) every two days (n=3 at day 0 and n=3-10/group/time-point). (B) Proportions of Ly6ChiCCR2+ monocytes (left graph) and Ly6ChiCCR2+ monocytes expressing MHCII (right graph) in spleen of EAE mice at disease peak (dpi 16) 24 hours after 1 therapeutic injection of vehicle (EAE) or OM-MOG 15 (arrow in A). (C) Proportions of Ly6ChiCCR2+ and Ly6C+MHCII+ cells and CD4+ T cells in CNS-infiltrating mononuclear cells recovered from spinal cord of mice shown in A at disease peak (dpi 16) 24 hours after 1 therapeutic injection of vehicle (EAE) or OM-MOG (n=8 for EAE and n=4 for OM-MOG). Proportions of PD-L1-producing, (D) CD11c-Ly6Clo, CD11c-Ly6Chi myeloid cells and Ly6C- cells in blood (n=6 for EAE and n=4 for OM-MOG), and (E) CD11c-Ly6Clo, CD11c-Ly6Chi myeloid cells and CD11c+Ly6C- DC in spleen (n=8 for EAE and n=4 for OM-MOG) of mice shown in A at disease peak (dpi 16) 24 hours after 1 therapeutic injection of vehicle (EAE) or OM-MOG. Data and statistical analysis are from one experiment. Statistical significance is shown after pairwise comparisons between groups using Student’s t test (*p ≤ 0.05, **p ≤ 0.01, ***p ≤ 0.001).
Figure 6
Figure 6
Soluble OM-MOG rapidly localizes to CD169+ subcapsular macrophages in the skin DLN: (A) Schematic representation of the overall experimental approach and the time point of injection of OM-F-MOG in the EAE mice. (B) Frozen sections of draining skin LN (DLN) and mesenteric LN (mLN) recovered from naïve (top row) and EAE mice at dpi 14 (bottom row), after a single i.d. injection of OM-F-MOG, showing the distribution of FITC fluorescence (green) at the indicated time-points and counter-stained with DAPI (blue). Representative images are shown from 1 mouse (naïve) and 1 of 2 mice (EAE). Scale bar 500 μM; 10x objective.(C) Flow cytometry plots of DLN cells (first 2 panels in each row) and mLN cells (3rd panels) recovered from naïve and EAE mice at dpi 16, after a single i.d. injection of OM-F-MOG, at the indicated time-points. Representative plots from 1 mouse (naïve) and 1 of 2 mice (EAE). (D) Proportions of FITC+ cells in different cell populations of the DLN, recovered from EAE mice 3 h and 24 h after a single therapeutic i.d. injection of OM-F-MOG (n=2 mice/time point). (E) Frozen sections of DLN and mLN, as shown in (A), immunostained with anti-CD169 (red) and counterstained with DAPI (blue). Tissues were collected from EAE mice at 3 h (i, iii, v) and 24 h (ii, vi), or naïve mice at 14 d (iv, vii, viii), after a single i.d. injection of OM-F-MOG or, as anti-CD169 immunostaining control, OM-MOG without FITC (ii, vi). Scale bars 500 μM, 10x objective (ii, iii, vii); 100 μM; 20x objective (i, iv); 50 μM; 63x objective (v, vi, viii). Representative images from 1 mouse (naïve) and 1 of 2 mice (EAE). Data are from two independent experiments, one for A, D (immunohistochemistry), and one for B, C (flow cytometry).
Figure 7
Figure 7
Soluble OM-MOG retains and activates Ly6Chi CCR2+ monocytes in the skin DLN: (A) Proportions of Ly6ChiCCR2+ monocytes (left graph), and Ly6ChiCCR2+ monocytes expressing MHCII (right graph) in blood, spleen and draining inguinal LN (DLN) of EAE mice 3 h after a single therapeutic i.d. injection of vehicle (EAE control) or OM-MOG (n=4/group). (B) Proportions of Ly6ChiCCR2+ monocytes expressing MHCII in the DLN of EAE mice 3 h and 24 h after a single therapeutic i.d. injection of vehicle (EAE control) or OM-MOG (n=3/group). (C) Proportions of PD-L1-producing CD11b+CD11c-, CD11b+CD11c+ (myeloid DC), CD11b-CD11c+ (DC) and CD11b+CD11c-Ly6Chi cells in the DLN of EAE mice 3 h and 24 h after a single therapeutic i.d. injection of vehicle (EAE control) or OM-MOG, as in B (n=3/group). Data and statistical analysis are from one (B, C) or one of 2 independent experiments (A). Statistical significance is shown after comparisons between groups using Mann-Whitney test (A), or one-way ANOVA followed by Tukey’s post hoc test (B, C) (*p ≤ 0.05, **p ≤ 0.01, ***p ≤ 0.001).
Figure 8
Figure 8
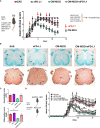
The protective effects of OM-MOG in EAE are abolished by PD-L1 neutralization and not altered by DC-specific PD-L1 knockout. (A) Schematic representation of the overall experimental approach and the time points of injection of OM-MOG and anti-PD-L1 neutralizing antibody in the EAE mice. Mean clinical scores of EAE mice treated therapeutically with vehicle (EAE), OM-MOG (black arrows), anti-PD-L1 neutralizing antibody (red arrows), or both OM-MOG and anti-PD-L1 antibody (n=4-6/group). Disease onset was synchronized according to the start of disease in each mouse, occurring between dpi 10-12, so that each mouse was monitored for the same number of days and received the same number of injections. (B) Histopathological analysis of spinal cord sections taken from mice shown in (A) at the completion of the experiment. Demyelination was measured by Luxol fast blue staining (LFB; upper panels) and inflammatory infiltration by haematoxylin-eosin staining (H&E; lower panels). Confluent inflammatory demyelinating lesions characteristic of EAE are seen in mice treated with vehicle (EAE), anti-PD-L1 antibody and both OM-MOG and anti-PD-L1 antibody (arrowheads), in contrast to markedly reduced lesions in mice treated with OM-MOG. Representative images from 1 of 4 or 6 (EAE) mice/group are shown. Scale bar 500 μM. (C) Semi-quantitative analysis of LFB and H&E-stained spinal cord sections of the mice shown in (A). 6-7 sections per mouse were analyzed (n=4-6 mice/group). (D) Mean clinical scores of PD-L1ff and dcPD-L1KO EAE mice treated therapeutically with vehicle (EAE) or OM-MOG (black arrows) (n=6-8/group). Data and statistical analysis are from one experiment in each case (one for A-C, one for (D). Statistical significance is shown after comparisons between groups using Mann-Whitney test (A, *EAE vehicle versus OM-MOG; #OM-MOG vs OM-MOG+anti-PD-L1) (D, *PD-L1ff EAE vehicle versus PD-L1ff+OM-MOG; #PD-L1ff EAE vehicle versus dcPD-L1KO+OM-MOG; formula image PD-L1ff+OM-MOG versus dcPD-L1KO+OM-MOG), and one-way ANOVA followed by Tukey’s post hoc test (C) (*, #, formula image p ≤ 0.05, **, ## p ≤ 0.01).

Similar articles

Cited by

References

    1. Codarri L, Greter M, Becher B. Communication between pathogenic T cells and myeloid cells in neuroinflammatory disease. Trends Immunol (2013) 34(3):114–9. doi: 10.1016/j.it.2012.09.007 - DOI - PubMed
    1. Hohlfeld R, Dornmair K, Meinl E, Wekerle H. The search for the target antigens of multiple sclerosis, part 1: autoreactive CD4+ T lymphocytes as pathogenic effectors and therapeutic targets. Lancet Neurol (2016) 15(2):198–209. doi: 10.1016/S1474-4422(15)00334-8 - DOI - PubMed
    1. Ben-Nun A, Wekerle H, Cohen IR. Pillars article: The rapid isolation of clonable antigen-specific T lymphocyte lines capable of mediating autoimmune encephalomyelitis. J Immunol (2017) 198(9):3384–8. - PubMed
    1. Bittner S, Wiendl H. Neuroimmunotherapies targeting T cells: From pathophysiology to therapeutic applications. Neurother J Am Soc Exp Neurother (2016) 13(1):4–19. doi: 10.1007/s13311-015-0405-3 - DOI - PMC - PubMed
    1. Huitinga I, van Rooijen N, de Groot CJ, Uitdehaag BM, Dijkstra CD. Suppression of experimental allergic encephalomyelitis in Lewis rats after elimination of macrophages. J Exp Med (1990) 172(4):1025–33. doi: 10.1084/jem.172.4.1025 - DOI - PMC - PubMed