

Harmonization and qualification of an IFN-γ Enzyme-Linked ImmunoSpot assay (ELISPOT) to measure influenza-specific cell-mediated immunity within the FLUCOP consortium
- PMID: 36159843
- PMCID: PMC9493492
- DOI: 10.3389/fimmu.2022.984642
Harmonization and qualification of an IFN-γ Enzyme-Linked ImmunoSpot assay (ELISPOT) to measure influenza-specific cell-mediated immunity within the FLUCOP consortium
Abstract
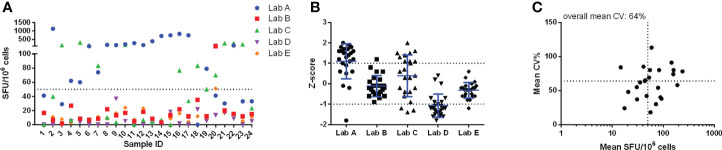
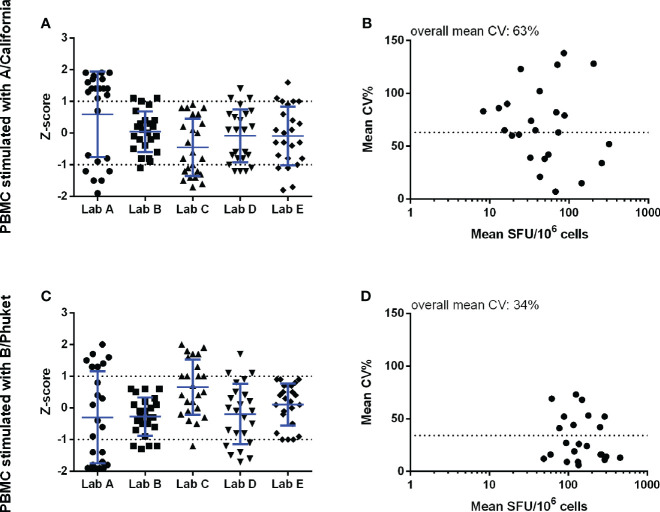
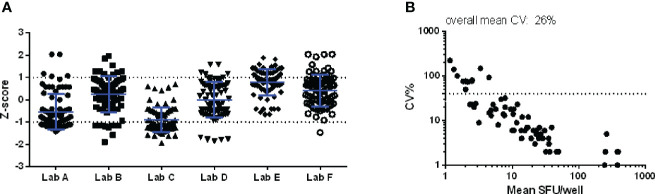
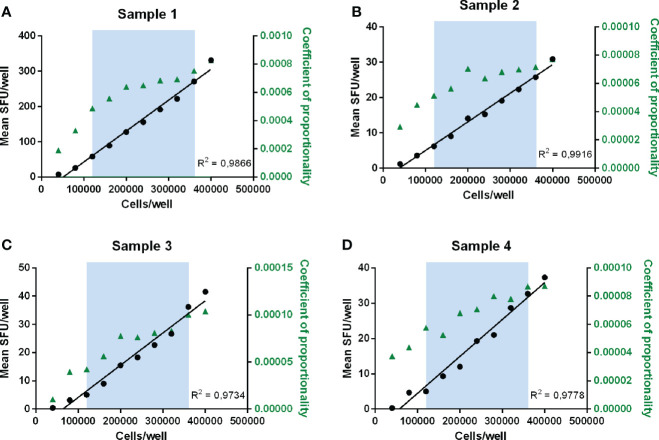
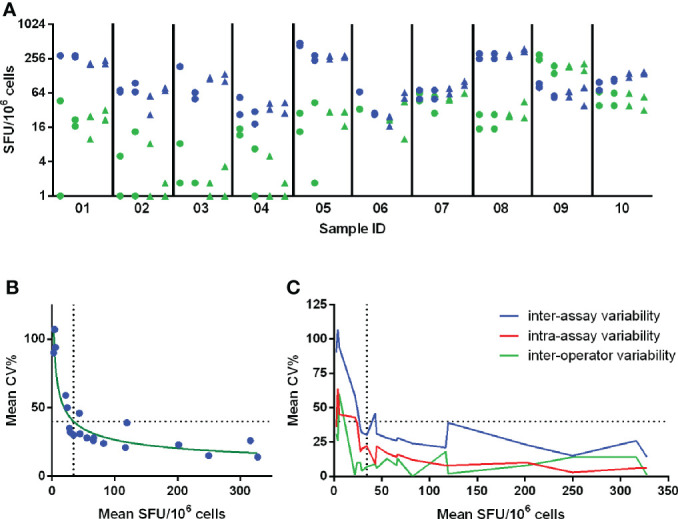
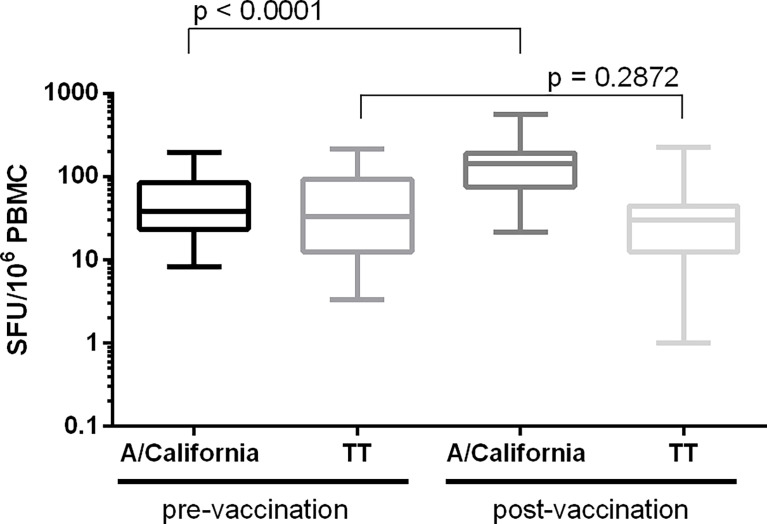
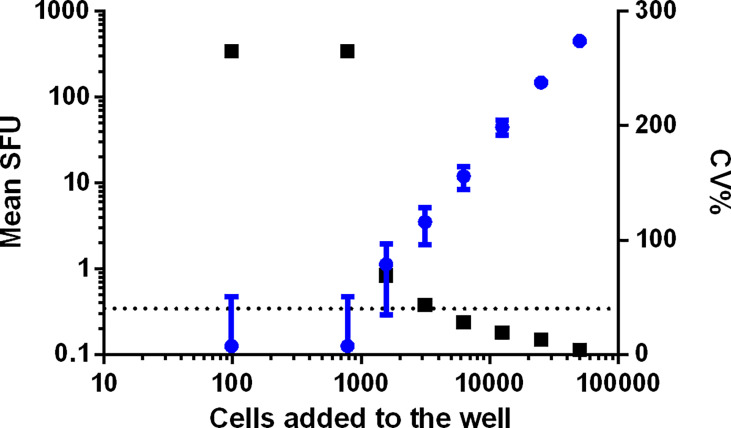
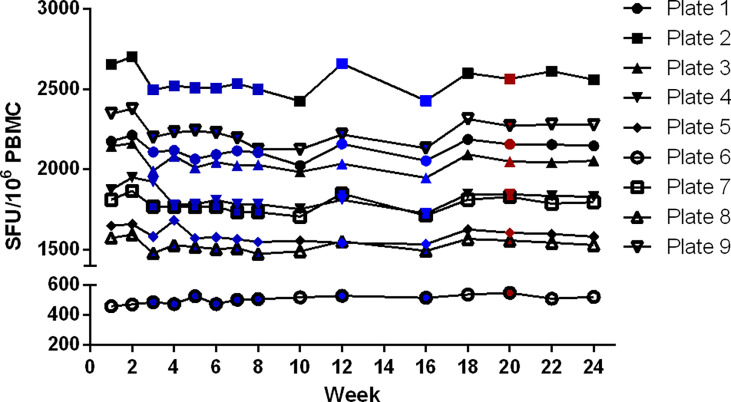
Influenza continues to be the most important cause of viral respiratory disease, despite the availability of vaccines. Today's evaluation of influenza vaccines mainly focuses on the quantitative and functional analyses of antibodies to the surface proteins haemagglutinin (HA) and neuraminidase (NA). However, there is an increasing interest in measuring cellular immune responses targeting not only mutation-prone surface HA and NA but also conserved internal proteins as these are less explored yet potential correlates of protection. To date, laboratories that monitor cellular immune responses use a variety of in-house procedures. This generates diverging results, complicates interlaboratory comparisons, and hampers influenza vaccine evaluation. The European FLUCOP project aims to develop and standardize assays for the assessment of influenza vaccine correlates of protection. This report describes the harmonization and qualification of the influenza-specific interferon-gamma (IFN-γ) Enzyme-Linked ImmunoSpot (ELISpot) assay. Initially, two pilot studies were conducted to identify sources of variability during sample analysis and spot enumeration in order to develop a harmonized Standard Operating Procedure (SOP). Subsequently, an assay qualification study was performed to investigate the linearity, intermediate precision (reproducibility), repeatability, specificity, Lower and Upper Limits of Quantification (LLOQ-ULOQ), Limit of Detection (LOD) and the stability of signal over time. We were able to demonstrate that the FLUCOP harmonized IFN-γ ELISpot assay procedure can accurately enumerate IFN-γ secreting cells in the analytical range of 34.4 Spot Forming Units (SFU) per million cells up to the technical limit of the used reader and in the linear range from 120 000 to 360 000 cells per well, in plates stored up to 6 weeks after development. This IFN-γ ELISpot procedure will hopefully become a useful and reliable tool to investigate influenza-specific cellular immune responses induced by natural infection or vaccination and can be an additional instrument in the search for novel correlates of protection.
Keywords: IFN-γ ELISpot; assay harmonization; assay qualification; cell-mediated immunity; influenza.
Copyright © 2022 Waerlop, Leroux-Roels, Lambe, Bellamy, Medaglini, Pettini, Cox, Trieu, Davies, Bredholt, Montomoli, Gianchecchi and Clement.
Conflict of interest statement
Authors EM and EG are employed by VisMederi srl. The remaining authors declare that the research was conducted in the absence of any commercial or financial relationships that could be construed as a potential conflict of interest.
Figures
Similar articles
-
Proficiency tests to evaluate the impact on assay outcomes of harmonized influenza-specific Intracellular Cytokine Staining (ICS) and IFN-ɣ Enzyme-Linked ImmunoSpot (ELISpot) protocols.J Immunol Methods. 2023 Dec;523:113584. doi: 10.1016/j.jim.2023.113584. Epub 2023 Oct 31. J Immunol Methods. 2023. PMID: 37918618
-
Harmonization and qualification of intracellular cytokine staining to measure influenza-specific CD4+ T cell immunity within the FLUCOP consortium.Front Immunol. 2022 Oct 20;13:982887. doi: 10.3389/fimmu.2022.982887. eCollection 2022. Front Immunol. 2022. PMID: 36341380 Free PMC article.
-
Validation of a Harmonized Enzyme-Linked-Lectin-Assay (ELLA-NI) Based Neuraminidase Inhibition Assay Standard Operating Procedure (SOP) for Quantification of N1 Influenza Antibodies and the Use of a Calibrator to Improve the Reproducibility of the ELLA-NI With Reverse Genetics Viral and Recombinant Neuraminidase Antigens: A FLUCOP Collaborative Study.Front Immunol. 2022 Jun 17;13:909297. doi: 10.3389/fimmu.2022.909297. eCollection 2022. Front Immunol. 2022. PMID: 35784305 Free PMC article.
-
ELISpot for measuring human immune responses to vaccines.Expert Rev Vaccines. 2011 Mar;10(3):299-306. doi: 10.1586/erv.10.169. Expert Rev Vaccines. 2011. PMID: 21434798 Free PMC article. Review.
-
Validation of the performance and suitability of a new class of FBS optimized for use in single-cell functional assays.J Immunol Methods. 2023 Apr;515:113452. doi: 10.1016/j.jim.2023.113452. Epub 2023 Feb 28. J Immunol Methods. 2023. PMID: 36858170 Free PMC article. Review.
Cited by
-
Meeting Report From "Correlates of Protection for Next Generation Influenza Vaccines: Lessons Learned From the COVID-19 Pandemic".Influenza Other Respir Viruses. 2024 Oct;18(10):e13314. doi: 10.1111/irv.13314. Influenza Other Respir Viruses. 2024. PMID: 39380156 Free PMC article.
-
Immune responses in healthy adults elicited by a bivalent norovirus vaccine candidate composed of GI.4 and GII.4 VLPs without adjuvant.Front Immunol. 2023 Jun 26;14:1188431. doi: 10.3389/fimmu.2023.1188431. eCollection 2023. Front Immunol. 2023. PMID: 37435073 Free PMC article. Clinical Trial.
-
Unravelling influenza correlates of protection: lessons from human A/H1N1 Challenge.mBio. 2024 May 8;15(5):e0006424. doi: 10.1128/mbio.00064-24. Epub 2024 Mar 28. mBio. 2024. PMID: 38546212 Free PMC article. Review.
-
Validation of the Enzyme-Linked ImmunoSpot Analytic Method for the Detection of Human IFN-γ from Peripheral Blood Mononuclear Cells in Response to the SARS-CoV-2 Spike Protein.Biomolecules. 2024 Oct 11;14(10):1286. doi: 10.3390/biom14101286. Biomolecules. 2024. PMID: 39456219 Free PMC article.
-
SARS-CoV-2 epitope-specific T cells: Immunity response feature, TCR repertoire characteristics and cross-reactivity.Front Immunol. 2023 Mar 10;14:1146196. doi: 10.3389/fimmu.2023.1146196. eCollection 2023. Front Immunol. 2023. PMID: 36969254 Free PMC article. Review.
References
-
- Cox JH, Ferrari G, Kalams SA, Lopaczynski W, Oden N, D’souza MP. Results of an ELISPOT proficiency panel conducted in 11 laboratories participating in international human immunodeficiency virus type 1 vaccine trials. AIDS Res Hum Retroviruses (2005) 21(1):68–81. doi: 10.1089/aid.2005.21.68 - DOI - PubMed
Publication types
MeSH terms
Substances
LinkOut - more resources
Full Text Sources
Medical