. 2022;90(2):565-583.
doi: 10.3233/JAD-220383.

Mitochondrial Alterations in Neurons Derived from the Murine AppNL-F Knock-In Model of Alzheimer's Disease

Affiliations

Mitochondrial Alterations in Neurons Derived from the Murine AppNL-F Knock-In Model of Alzheimer's Disease

Giacomo Dentoni et al. J Alzheimers Dis. 2022.

Abstract

Background: Alzheimer's disease (AD) research has relied on mouse models overexpressing human mutant A βPP; however, newer generation knock-in models allow for physiological expression of amyloid-β protein precursor (AβPP) containing familial AD mutations where murine AβPP is edited with a humanized amyloid-β (Aβ) sequence. The AppNL-F mouse model has shown substantial similarities to AD brains developing late onset cognitive impairment.

Objective: In this study, we aimed to characterize mature primary cortical neurons derived from homozygous AppNL-F embryos, especially to identify early mitochondrial alterations in this model.

Methods: Primary cultures of AppNL-F neurons kept in culture for 12-15 days were used to measure Aβ levels, secretase activity, mitochondrial functions, mitochondrial-ER contacts, synaptic function, and cell death.

Results: We detected higher levels of Aβ42 released from AppNL-F neurons as compared to wild-type neurons. AppNL-F neurons, also displayed an increased Aβ42/Aβ40 ratio, similar to adult AppNL-F mouse brain. Interestingly, we found an upregulation in mitochondrial oxygen consumption with concomitant downregulation in glycolytic reserve. Furthermore, AppNL-F neurons were more susceptible to cell death triggered by mitochondrial electron transport chain inhibition. Juxtaposition between ER and mitochondria was found to be substantially upregulated, which may account for upregulated mitochondrial-derived ATP production. However, anterograde mitochondrial movement was severely impaired in this model along with loss in synaptic vesicle protein and impairment in pre- and post-synaptic function.

Conclusion: We show that widespread mitochondrial alterations can be detected in AppNL-F neurons in vitro, where amyloid plaque deposition does not occur, suggesting soluble and oligomeric Aβ-species being responsible for these alterations.

Keywords: Alzheimer’s disease; AppNL-F knock-in mice; mitochondria; mitochondria-ER contact sites; synapses.


Conflict of interest statement

Authors’ disclosures available online (https://www.j-alz.com/manuscript-disclosures/22-0383r2).

Figures

Fig. 1
Fig. 1
Amyloid processing characterization in AppNL-F neurons. A) Representative immunoblots of primary cortical neurons homogenate from WT and AppNL-F neurons. Blots were probed with antibodies against A βPP and sAβPPα/β (Y188), ADAM-10, BACE-1, PS1 NTF, PS2 NTF, and tubulin was used as a loading control. B) Bar graph shows amounts of protein analyzed once standardized to tubulin content in each sample (n = 3–8 independent cultures). C) Bar graph shows quantification of extracellular Aβ40 and Aβ42 concentration (pmol/L) in WT and AppNL-F neurons (n = 4–5 independent cultures). D) Quantification of Aβ42 to Aβ40 ratio extracellular concentration in WT and AppNL-F neurons (n = 4–5 independent cultures). E) Quantification of fluorescent intensity recording of BACE-1 activity; β-secretase substrate and inhibitor were used as positive and negative controls respectively. Values were standardized to protein concentration (n = 3–4). F) Bar graph shows quantification of γ-secretase activity by assessing Aβ (pmol/L) in the media derived from WT or AppNL-F cells with or without γ-secretase inhibitor L685,458. Ratio between L685,458 and DMSO treated cells was used to assess γ-secretase activity (n = 3–4). Data shown as mean±SEM. *p≤0.05, ***p≤0.001.
Fig. 2
Fig. 2
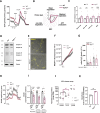
Characterization of bioenergetics in AppNL-F neurons. A) Oxygen consumption rate (OCR) representative traces showing cellular respiration in WT and AppNL-F neurons after the sequential injection of oligomycin (oligo, 1μM), FCCP (1μM) and Rotenone + Antimycin A (Rot + AntA, 0.5μM). B) Spider chart lines represent fold-increase in OCR considering the basal respiration of the WT neurons as 1. C) Bar graphs show quantification of OCR parameters extrapolated from Seahorse XFe96 Cell Mito Stress Test and normalized to protein content normalized to WT (n = 7 independent cultures), D) Representative immunoblots of primary cortical neurons homogenate from WT and AppNL-F neurons. Blots were probed with OXPHOS cocktail antibody and tubulin was used as a loading control (n = 7–9 independent cultures). E) Representative fluorescence and brightfield images show MitoPY1 fluorescence in WT and AppNL-F neurons. F) Traces of Mitochondrial MitoPY1 fluorescence upon AntA stimulus. G) Mitochondrial H2O2 levels quantification under basal conditions and upon Ant A (2μM) treatment (n = 35–49 cells, from 4 independent experiments). H) Extracellular acidification rate (ECAR) traces in WT and AppNL-F neurons after the sequential injection of Glucose (Gluc,10 mM), oligomycin (Oligo, 1μM) and 2-DeoxyGluocose (2-DG, 50 mM) (n = 6–7 independent cultures). I) Quantification of ECAR parameters extrapolated from the Seahorse XFe96 glycolytic stress test report and normalized to protein content normalized to WT (n = 6–7 independent cultures). J) Bar graph shows quantification of LDH assay absorbance normalized to protein content in WT or AppNL-F cultures; Lysis buffer was used as a positive control to elicit LDH release and Ant A (24 h, 0.5μM) was used to elicit mitochondrial stress (n = 4–7 independent cultures). K) Quantification of fold increase in absorbance of LDH between Ant A treated and DMSO treated WT and AppNL-F cells (n = 5–7). Data shown as mean±SEM. *p≤0.05, **p≤0.01.
Fig. 3
Fig. 3
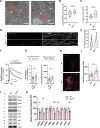
Characterization of ER to mitochondria juxtaposition in AppNL-F neurons. A) Representative electron micrographs pictures of WT or AppNL-F neurons showing mitochondria (red) and ER (green) in close proximity to each other forming MERCS. Scale bar = 250 nm scale. B) Violin plot shows quantification of number of MERCS per number of mitochondria per cell and C) violin plot shows % of mitochondria in contact with ER (4 independent cultures, 5 cells analyzed per condition). D) Confocal Z-stack rendering of SPLICS-GFP dots in axonal processes in WT and AppNL-F neurons. Pictures on the right display overlay of SPLICS-GFP and MAP2 staining. Scale bar = 10μm. E) Quantification number SLICS-GFP particles per 100μm of axonal process (n = 14–22, from 3 independent experiments). F) Rhod2 fluorescence recording of mitochondria Ca2+ transients upon IP3-generating agonists Ca2+ release; mean shown as solid line, dotted lines display±SEM. G) Quantification of cytosolic Ca2+ peak amplitude and of mitochondrial Ca2+ retention capacity. H) Representative confocal images of WT or AppNL-F neurons incubated with LipidTOX Red. I) Quantification of fluorescence LipidTOX Red per cell in WT or AppNL-F neurons (20-25 cells, from 4 different experiments). Scale bar = 10μm. J) Representative immunoblots of primary cortical neurons homogenate from WT and AppNL-F neurons. Blots were probed with antibodies against MERCS and mitochondrial proteins and tubulin was used as a loading control (n = 7–9 independent cultures). K) Bar graph shows amounts of protein analyzed once standardized to tubulin content in each sample. Data shown as mean±SEM. *p≤0.05, **p≤0.01, ***p≤0.001.
Fig. 4
Fig. 4
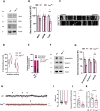
AppNL-F neurons present mitochondrial transport and synaptic dysfunction. A) Representative immunoblots of primary cortical neurons homogenate from WT and AppNL-F neurons. Blots were probed with antibodies against mitochondrial movement protein mediators and tubulin was used as a loading control (n = 5–7 independent cultures). B) Bar graph shows amounts of protein analyzed once standardized to tubulin content in each sample. C) Representative kymographs (xx, distance versus yy, time) of WT and AppNL-F neurons obtained from mitochondrial trafficking recording over 10 min. D) % of stationary mitochondria (vertical lines) versus % of moving mitochondria (diagonal lines). E) Direction of mitochondria from and to cell soma (n = 12–15 neurites from 3 independent cultures). F) Representative immunoblots of primary cortical neurons homogenate from WT and AppNL-F neurons. Blots were probed with antibodies against presynaptic terminal proteins and tubulin was used as a loading control (n = 4–7). G) Bar graph shows amounts of protein analyzed once standardized to tubulin content in each sample. H) Representative electrophysiological traces. Each black arrow-heads shows a mEPSCs. Quantification of I) resting membrane potential, J) frequency of mEPSCs, K) decay time constant (n = 16–20, from 3–4 independent cultures). Data shown as mean±SEM. *p≤0.05, **p≤0.01, ***p≤0.001.

Similar articles

Cited by

References

    1. Hardy J, Allsop D (1991) Amyloid deposition as the central event in the aetiology of Alzheimer’s disease. Trends Pharmacol Sci 12, 383–388. - PubMed
    1. Kametani F, Hasegawa M (2018) Reconsideration of amyloid hypothesis and tau hypothesis in Alzheimer’s disease. Front Neurosci 12, 25–25. - PMC - PubMed
    1. Selkoe DJ, Hardy J (2016) The amyloid hypothesis of Alzheimer’s disease at 25 years. EMBO Mol Med 8, 595–608. - PMC - PubMed
    1. LaFerla FM, Green KN (2012) Animal models of Alzheimer disease. Cold Spring Harb Perspect Med 2, a006320. - PMC - PubMed
    1. Saito T, Matsuba Y, Yamazaki N, Hashimoto S, Saido TC (2016) Calpain activation in Alzheimer’s model mice is an artifact of APP and presenilin overexpression. J Neurosci 36, 9933. - PMC - PubMed

Publication types

Substances