. 2022 Oct 12;96(19):e0126422.
doi: 10.1128/jvi.01264-22. Epub 2022 Sep 26.

ATF1 Restricts Human Herpesvirus 6A Replication via Beta Interferon Induction

Affiliations

ATF1 Restricts Human Herpesvirus 6A Replication via Beta Interferon Induction

Salma Aktar et al. J Virol. .

Abstract

The stimulus-induced cAMP response element (CRE)-binding protein (CREB) family of transcription factors bind to CREs to regulate diverse cellular responses, including proliferation, survival, and differentiation. Human herpesvirus 6A (HHV-6A), which belongs to the Betaherpesvirinae subfamily, is a lymphotropic herpesvirus frequently found in patients with neuroinflammatory diseases. Previous reports implicated the importance of CREs in the HHV-6A life cycle, although the effects of the binding of transcription factors to CREs in viral replication have not been fully elucidated. In this study, we analyzed the role of the CREB family of transcription factors during HHV-6A replication. We found that HHV-6A infection enhanced phosphorylation of the CREB family members CREB1 and activating transcription factor 1 (ATF1). Knockout (KO) of CREB1 or ATF1 enhanced viral gene expression and viral replication. The increase in viral yields in supernatants from ATF1-KO cells was greater than that in supernatants from CREB1-KO cells. Transcriptome sequencing (RNA-seq) analysis showed that sensors of the innate immune system were downregulated in ATF1-KO cells, and mRNAs of beta interferon (IFN-β) and IFN-regulated genes were reduced in these cells infected with HHV-6A. IFN-β treatment of ATF1-KO cells reduced progeny viral yields significantly, suggesting that the enhancement of viral replication was caused by a reduction of IFN-β. Taken together, our results suggest that ATF1 is activated during HHV-6A infection and restricts viral replication via IFN-β induction. IMPORTANCE Human herpesvirus 6A (HHV-6A) is a ubiquitous herpesvirus implicated in Alzheimer's disease, although its role in its pathogenesis has not been confirmed. Here, we showed that the transcription factor ATF1 restricts HHV-6A replication, mediated by IFN-β induction. Our study provides new insights into the role of ATF1 in innate viral immunity and reveals the importance of IFN-β for regulation of HHV-6A replication, which possibly impairs HHV-6A pathogenesis.

Keywords: ATF1; HHV-6; gene expression; herpesviruses; interferons; transcription factors.


Conflict of interest statement

The authors declare no conflict of interest.

Figures
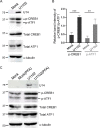
FIG 1
FIG 1
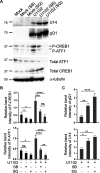
HHV-6A infection activates CREB1 and ATF1. (A) JJhan cells were mock infected or infected with U1102. At 72 h postinfection, cells were lysed and the extracts were immunoblotted using the indicated antibodies. (B) The intensities of p-CREB1 or p-ATF1 in each lane, normalized against α-tubulin, are shown as mean ± standard deviation from 3 independent experiments (***, P < 0.001; **, P < 0.01; unpaired Student’s t test). (C) JJhan cells were mock infected or infected with U1102. At 24 h postinfection, the cells were divided into two aliquots and either treated with 200 μg/mL phosphonoformic acid (PFA) or left untreated. After 48 h of PFA treatment, the cells were lysed and analyzed by immunoblotting. The experiments were repeated at least 3 times. Numbers at left of panels A and C are molecular masses in kilodaltons.
FIG 2
FIG 2
Effect of cAMP depletion on phosphorylation of CREB1 and ATF1 in HHV-6A-infected cells. (A) JJhan cells were infected with U1102 and mock treated or treated with either SB203580 (SB) or SQ22536 (SQ). After 72 h, infected cells were collected and analyzed by immunoblotting. Numbers at left are molecular masses in kilodaltons. (B and C) The intensities of p-CREB1 or p-ATF1 (B) and gQ1 and U14 (C) in each lane, normalized against α-tubulin, are shown as mean ± standard deviation from 3 independent experiments (****, P < 0.0001; ***, P < 0.001; **, P < 0.01; *, P < 0.05; Tukey’s test).
FIG 3
FIG 3
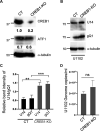
The role of CREB1 in HHV-6A-infected cells. (A) JJhan-Cas9 CT (CT) or JJhan-Cas9 CREB1-KO cells were harvested and analyzed by immunoblotting using the indicated antibodies. The intensities of CREB1 and ATF1, normalized against α-tubulin, are shown under each band. (B) JJhan-Cas9 CT or JJhan-Cas9 CREB1-KO cells were infected with U1102. At 72 h postinfection, cells were lysed and immunoblotted using the indicated antibodies. Numbers at left of panels A and B are molecular masses in kilodaltons. (C) The intensities of U14 or gQ1 in each lane, normalized against α-tubulin, are shown as mean ± standard deviation from 3 independent experiments (***, P < 0.001; **, P < 0.01; unpaired Student’s t test). (D) The genome copies of U1102 were quantified by qPCR upon extraction of DNA from the supernatant of U1102-infected JJhan-Cas9 CT or JJhan-Cas9 CREB1-KO cells at 72 h postinfection. Data are shown as mean ± standard deviation from 3 independent experiments (unpaired Student’s t test).
FIG 4
FIG 4
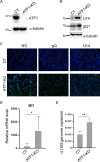
The role of ATF1 in HHV-6A-infected cells. (A) JJhan-Cas9 CT (CT) or JJhan-Cas9 ATF1-KO cells were harvested and analyzed by immunoblotting using the indicated antibodies. Numbers at left of panels A and B are molecular masses in kilodaltons. (B and C) JJhan-Cas9 CT or JJhan-Cas9 ATF1-KO cells were infected with U1102. At 72 h postinfection, the cells were immunoblotted (B) or assayed by immunofluorescence (C) using antibodies directed against the indicated virus proteins. (D) The RNA of U1102-infected JJhan-Cas9 CT or JJhan-Cas9 ATF1-KO cells was collected 72 h postinfection, and the level of the virus immediate early gene IE1 was quantified by RT-PCR. Data are shown as mean ± standard deviation from 3 independent experiments (*, P < 0.05; unpaired Student’s t test). (E) Genome copy number of U1102 was quantified by qPCR upon extraction of DNA from the supernatant of virus-infected JJhan-Cas9 CT or JJhan-Cas9 ATF1-KO cells. Data are shown as mean ± standard deviation from 3 independent experiments (**, P < 0.01; unpaired Student’s t test).
FIG 5
FIG 5
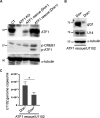
Exogenous expression of ATF1 in JJhan-Cas9 ATF1-KO cells restricts HHV-6A replication. (A) JJhan-Cas9 CT (CT), JJhan-Cas9 ATF1-KO, and JJhan-Cas9 ATF1-KO/rescue cells incubated with or without Dox for 24 h were analyzed by immunoblotting. Numbers at left of panels A and B are molecular masses in kilodaltons. (B and C) JJhan-Cas9 ATF1-KO/rescue cells were infected with U1102 in duplicate aliquots. At 24 h postinfection, the cells were either mock treated or treated with Dox. At 48 h posttreatment, these cells were analyzed using immunoblotting (B) with the indicated antibodies, while genome copy numbers were measured using qPCR (C) following DNA extraction from the supernatant of the infected cells. Data are shown as mean ± standard deviation from 3 independent experiments (*, P < 0.05; unpaired Student’s t test).
FIG 6
FIG 6
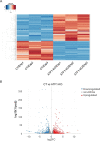
Gene expression signature of JJhan-Cas9 ATF1-KO cells infected with HHV-6A. JJhan-Cas9 CT (CT) or JJhan-Cas9 ATF1-KO cells infected with U1102 for 48 h were harvested to extract RNA, and gene expression was determined using RNA-seq. (A) Heatmap showing differentially expressed genes (DEGs) between JJhan-Cas9 CT (CT) and JJhan-Cas9 ATF1-KO cells determined using RNA-seq data. Normalized Z-score values were calculated for each differentially expressed gene (high, red; low, blue). The distribution of the expression level of the DEGs is shown on the color key legend (top left). (B) Volcano plot of the DEGs.
FIG 7
FIG 7
GO classifications of JJhan-Cas9 CT and JJhan-Cas9 ATF1-KO DEGs. The top 10 GO-enriched terms for the up- and downregulated genes in JJhan-Cas9 ATF1-KO cells compared to JJhan-Cas9 CT cells (CT) are shown in the bar graphs. p.adjust values of the GO terms are shown on the color key legend (bottom right).
FIG 8
FIG 8
ATF1 is required for expression of genes involved in innate immunity. JJhan-Cas9 CT (CT) or JJhan-Cas9 ATF1-KO cells were mock infected or infected with U1102. At 72 h postinfection, RNA was extracted from the cells. The expression of TLR3, TLR10, cGAS, CASP1, and CASP4 was quantified using qRT-PCR. Relative amounts of these mRNAs were normalized to β-actin. Data are shown as mean ± standard deviation from 3 independent experiments (*, P < 0.05; **, P < 0.01; Tukey’s test).
FIG 9
FIG 9
ATF1 is required for expression of IFN-β and IFN-regulated genes in HHV-6A-infected cells. JJhan-Cas9 CT (CT) or JJhan-Cas9 ATF1-KO cells were mock infected or infected with U1102. At 72 h postinfection, RNA was extracted from the cells. The expression of IFN-β, MX-1, and IFI-27 was quantified using qRT-PCR. Relative amounts of these mRNAs were normalized to β-actin. Data are shown as mean ± standard deviation from 3 independent experiments (*, P < 0.05; **, P < 0.01; ***, P < 0.001; Tukey’s test).
FIG 10
FIG 10
ATF1 is not required for expression of IFN-β and IFN-regulated genes in HSV-1-infected cells. JJhan-Cas9 CT (CT) or JJhan-Cas9 ATF1-KO cells were mock infected or infected with HSV-1. At 24 h postinfection, RNA was extracted from the cells. The expression of IFN-β, MX-1, and IFI-27 was quantified using qRT-PCR. Relative amounts of these mRNAs were normalized against β-actin. Data are shown as mean ± standard deviation from 3 independent experiments (*, P < 0.05; ***, P < 0.001; Tukey’s test).
FIG 11
FIG 11
The effects of IFN-β treatment on HHV-6A replication in JJhan-Cas9 ATF1-KO cells. JJhan-Cas9 CT (CT) or JJhan-Cas9 ATF1-KO cells were mock treated or treated with 0.02 ng/mL of IFN-β for 1 h. The cells were then infected with U1102. At 72 h postinfection, they were analyzed by immunoblotting using the indicated antibodies (A), or genome copy numbers were quantified using qPCR following DNA extraction from the supernatant of the infected cells (B). Data are shown as mean ± standard deviation from 3 independent experiments (*, P < 0.05; **, P < 0.01; Tukey’s test). Numbers at left of panel A are molecular masses in kilodaltons.

Similar articles

Cited by

References

    1. Aubin JT, Collandre H, Candotti D, Ingrand D, Rouzioux C, Burgard M, Richard S, Huraux JM, Agut H. 1991. Several groups among human herpesvirus-6 strains can be distinguished by Southern blotting and polymerase chain-reaction. J Clin Microbiol 29:367–372. 10.1128/jcm.29.2.367-372.1991. - DOI - PMC - PubMed
    1. Campadelli-Fiume G, Guerrini S, Liu X, Foa-Tomasi L. 1993. Monoclonal antibodies to glycoprotein B differentiate human herpesvirus 6 into two clusters, variants A and B. J Gen Virol 74:2257–2262. 10.1099/0022-1317-74-10-2257. - DOI - PubMed
    1. Wyatt LS, Balachandran N, Frenkel N. 1990. Variations in the replication and antigenic properties of human herpesvirus 6 strains. J Infect Dis 162:852–857. 10.1093/infdis/162.4.852. - DOI - PubMed
    1. Ablashi D, Agut H, Alvarez-Lafuente R, Clark DA, Dewhurst S, DiLuca D, Flamand L, Frenkel N, Gallo R, Gompels UA, Hollsberg P, Jacobson S, Luppi M, Lusso P, Malnati M, Medveczky P, Mori Y, Pellett PE, Pritchett JC, Yamanishi K, Yoshikawa T. 2014. Classification of HHV-6A and HHV-6B as distinct viruses. Arch Virol 159:863–870. 10.1007/s00705-013-1902-5. - DOI - PMC - PubMed
    1. Yamanishi K, Mori Y, Pellet PE. 2013. Human herpesviruses 6 and 7, p 2058–2079. In Knipe DM, Howley PM, Cohen JI, Griffin DE, Lamb RA, Martin MA, Racaniello VR, Roizman B (ed), Fields virology, 6th ed. Lippincott-Williams &Wilkins, Philadelphia, PA.

Publication types

MeSH terms

Substances