. 2022 Oct 10;40(10):1145-1160.e9.
doi: 10.1016/j.ccell.2022.08.016. Epub 2022 Sep 22.

Ablation of the endoplasmic reticulum stress kinase PERK induces paraptosis and type I interferon to promote anti-tumor T cell responses

Affiliations

Ablation of the endoplasmic reticulum stress kinase PERK induces paraptosis and type I interferon to promote anti-tumor T cell responses

Jessica K Mandula et al. Cancer Cell. .

Abstract

Activation of unfolded protein responses (UPRs) in cancer cells undergoing endoplasmic reticulum (ER) stress promotes survival. However, how UPR in tumor cells impacts anti-tumor immune responses remains poorly described. Here, we investigate the role of the UPR mediator pancreatic ER kinase (PKR)-like ER kinase (PERK) in cancer cells in the modulation of anti-tumor immunity. Deletion of PERK in cancer cells or pharmacological inhibition of PERK in melanoma-bearing mice incites robust activation of anti-tumor T cell immunity and attenuates tumor growth. PERK elimination in ER-stressed malignant cells triggers SEC61β-induced paraptosis, thereby promoting immunogenic cell death (ICD) and systemic anti-tumor responses. ICD induction in PERK-ablated tumors stimulates type I interferon production in dendritic cells (DCs), which primes CCR2-dependent tumor trafficking of common-monocytic precursors and their intra-tumor commitment into monocytic-lineage inflammatory Ly6C+CD103+ DCs. These findings identify how tumor cell-derived PERK promotes immune evasion and highlight the potential of PERK-targeting therapies in cancer immunotherapy.

Keywords: PERK; immunogenic cell death; tumor immunity; type I IFN; unfolded protein responses.


Conflict of interest statement

Declaration of interests The authors declare no competing interests.

Figures
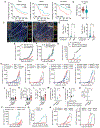
Figure 1:
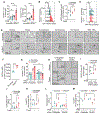
Figure 1:. PERK in melanoma cells limits anti-tumor T cell immunity
(A) Overall survival in melanoma patients from Skin Cutaneous Melanoma datasets (TCGA, Moffitt, and ICI treated) stratified by PERK mRNA signature scores calculated by GSVA. Samples were categorized based on a median split of the signature score: (TCGA: n= 228 above and n= 229 below; Moffitt n=59 above and n= 58 below; ICI treated n=35 above and n=34 below). (B) PERK signaling score was applied into ICI treated melanoma patients and categorized into Responders (R, n=19) or Non-Responders (NR, n=49) as annotated by the CRI iAtlas portal. Data are the median (gray dashed line) from the min to max and width is the population frequency at that interval. (C) Illustrative images by Automated Multispectral Imaging (400μm and 100μm) of 133 metastatic melanoma tumors showing SOX10 (Cyan), phospho-PERK (Orange), CD45 (Green), CD4 (Magenta), CD8 (Yellow) and DAPI (Blue). Samples were ranked as PERKhigh or PERKlow as in the Methods. (D) Proportion of intra-tumor CD4+ (left) and CD8+ (right) T cells in DAPI+ cells in the stratified groups of phospho-PERK in SOX10+ cells from (C). Data are the median (bold horizontal line) ± quartiles (light horizontal line) with n= 33 (Low) and 36 (High). (E-F) Tumor volume ± SEM in C57BL/6 mice bearing wildtype (WT), Scramble or PERKKO B16 (E, n=29/group), or SM1 (F, n=9/group) tumors. (G) Total tumor volume ± SEM in tamoxifen-treated Eif2ak3fl/+ or Eif2ak3fl/fl BrafV600E/+;Ptenfl/fl;Tyrosinase-CreERT2 mice vs. BrafV600E/+;Ptenfl/fl;Tyrosinase-CreERT2 mice (n=12/group). (H) Tumor volume ± SEM of B16, B16 Scramble, and B16 PERKKO cells (left), as well as SM1 counterparts (right) injected into C57BL/6 (Wild Type, WT) or Rag1−/− mice. n=8/group. (I) Tumor growth ± SEM in mice bearing B16 Scramble or B16 PERKKO tumors (left), or SM1 counterparts (right), treated with isotype, anti-CD4, or anti-CD8. n=5/group. (J-M) Percentage ± SEM of intra-tumor CD8+ T cells in CD45+ cells (J), and CD69+CD44+ (K), IFNγ+TNFα+ (L), and gp 100-reactive EGSRNQDWL-H-2Db-tetramer+ cells in intra-tumor CD8+ T cells (M) from WT, Scramble and PERKKO B16 tumors at day 17 post-injection. n=10-15/group. (N) Proportion (mean ± SEM) of EGSRNQDWL-H-2Db-tetramer+ intra-tumor CD8+ T cells from tamoxifen-exposed Eif2ak3fl/+ or Eif2ak3fl/fl BrafV600E/+;Ptenfl/fl;Tyrosinase-CreERT2 mice vs. BrafV600E/+;Ptenfl/fl;Tyrosinase-CreERT2 mice. n=3-8/group. (O) Proportion ± SEM of CD8+PD-1+ in CD45+ cells from WT, Scramble or PERKKO B16 tumors. (P) Tumor volume ± SEM in mice bearing Scramble or PERKKO B16 tumors and treated with isotype or anti-PD-1. n=4/group. (Q) Tamoxifen-exposed BrafV600E/+;Ptenfl/fl;Tyrosinase-CreERT2 mice carrying ~150 mm3 tumors were treated with vehicle or AMG44. Tumor volume normalized to initial treatment volume. n=9/group. (R) Tumor volume ± SEM in WT and Rag1−/− mice bearing B16 (left) or SM1 (right) tumors and treated after day 6 post-tumor injection with AMG44 (12.5 mg/kg). n=10/group. Statistics applied using one-way ANOVA (E – L, N, P – R), Student’s t-test (D, M, O), Mann-Whitney t-test (B), or log-rank test (A). *, p<0.05; **, p<0.01; ***, p < 0.001; ****, p < 0.0001. Please also see Figure S1.
Figure 2:
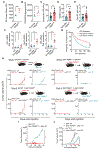
Figure 2:. PERK ablation sensitizes melanoma cells to ER stress-induced paraptosis
(A) Annexin V+ mean percentage ± SEM in Scramble and PERKKO B16 (left) or SM1 (right) tumors cultured for 24 hours with or without Thaps. n=3-7 of 3 independent repeats. (B) Representative histograms from 3 distinct repeats showing ER Tracker Green in Scramble and PERKKO B16 cells treated as in (A). (C) Mean fluorescence intensity (MFI) via flow cytometry ± SEM of NIAD4-bound protein aggregates in Scramble and PERKKO B16 cells treated as in (A). n=4-7/group of 3 independent repeats. (D) Representative histograms from 3 repeats for fluorescent click chemistry-based detection of O-propargyl-puromycin (OPP) incorporation in Scramble and PERKKO B16 cells treated as in (A). (E) Light microscopy morphology (100μm and 20X digital magnification) of Scramble and PERKKO B16 cells cultured in the presence of vehicle, Thaps, or Tunicamycin; in the absence of Glucose or Serum; or with 25% TES. (F) SEC61β (MFI ± SEM) in eGFP+ Scramble and PERKKO B16 tumors from mice. n=6/group. (G) Annexin V+ percentage ± SEM in Scramble and PERKKO B16 cells transfected with untargeted control or Sec61b siRNA and treated as in (A). n=3/group. (H) Light microscopy morphology in PERKKO B16 cells transfected with mock or Sec61b siRNA prior to Thaps exposure. (I) Percentage ± SEM of DiOC2 low cells in B16 cells transfected with untargeted or Atf4 siRNA and treated as in (A). n=4-5/group. (J) ATP in supernatants from Scramble or PERKKO B16 cells incubated or not with Thaps. Data are the normalized relative light units (nRLU) ± SEM of n=12-15/group. (K) ExoCRT fold change (MFI ± SEM) in Scramble or PERKKO B16 cells cultured as in (A). n=4-7/group. (L-M) Extracellular ATP (L) and ExoCRT (M) ± SEM in Scramble or PERKKO B16 cells carrying mock or Sec61b siRNA and cultured with or without Thaps. n=6-10/group (L); n=3-4/group (M). Statistics applied using one-way ANOVA (A, C, F, G, I – M) or Student’s t-test (F), *, p<0.05; **, p<0.01; ****, p < 0.0001. Please also see Figure S2.
Figure 3:
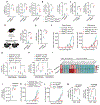
Figure 3:. PERK deletion in cancer cells provokes ICD-driven anti-tumor immunity
(A-B) ER Tracker Green (A) and CRANAD-labeled protein aggregates (B) by flow cytometry (MFI ± SEM) in CD45 cells from Scramble and PERKKO B16 tumors from mice. n=9/group. (C-D) ATP (C) and HMGB1 (D) (mean ± SEM) in supernatants from resected Scramble or PERKKO B16 tumors cultured for 24 hours. n=8-12/group (C); n=6-8/group (D). (E) ExoCRT (MFI ± SEM) in CD45 cells from freshly isolated Scramble or PERKKO B16 tumors. n=12/group. (F) Relative expression of Ifnb1, Isg15 and Ifit3 mRNA ± SEM in bulk wildtype, Scramble or PERKKO B16 tumors from mice. n=13-15/group. (G) Overall survival for Skin Cutaneous Melanoma patients (TCGA, PanCancer Atlas) stratified by the median ICD metagene signature score. Kaplan-Meier curves of overall survival for ICD high (above the median; n = 228) and low (below the median; n = 229). Gene signature calculation by GSVA. (H) Mice injected with WT SM1 tumors on the left flank for 10 days later, were implanted with WT (Group 1) or PERKKO (Group 2) SM1 cells on the right flank. Mice were injected with SM1 PERKKO cells on the left flank, followed by injection 10 days later with WT (Group 3) or PERKKO (Group 4) SM1 tumors on the right flank. Tumor growth ± SEM. n=10/group. (I) WT SM1 tumor growth ± SEM in naïve mice or mice that had rejected PERKKO SM1 tumors. n=10/group. (J) Volume ± SEM for SM1 (left flank; SM1 WT) and LLC (right flank; LLC WT) tumors in naïve mice and mice that previously rejected PERKKO SM1 tumors. n=5/group. Statistics applied by one-way ANOVA (F, I, J), Student’s t-test (A – E), or log-rank test (G). *, p<0.05; **, p<0.01; ***, p < 0.001; ****, p < 0.0001. Please also see Figure S3.
Figure 4:
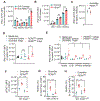
Figure 4:. PERK in cancer cells regulates accumulation of MoDCs
(A-B) Percentage of CD11b+Gr1+ (A) and CD11c+MHC-II+ (B) cells ± SEM in CD45+ cells in tumors from mice bearing wildtype (WT), Scramble or PERKKO B16 tumors for 17 days. n=9/group (A); n=15/group (B). (C) Volume ± SEM of Scramble and PERKKO B16 tumors implanted into ItgaxDTR/EGFP mice treated with vehicle or diphtheria toxin. n=8/group. (D) Percentage of CD44+CD69+ ± SEM in CD8+ Pmel T cells co-cultured for 48 hours with sorted CD11c+ cells from Scramble or PERKKO B16 tumors (ratio 1:1/4). n=3/group. (E) Proportion ± SEM of MoDCs, cDC1, and cDC2 in CD11c+MHC-II+ cells from WT, Scramble, or PERKKO B16 tumors. n=15/group. (F-G) MoDCs percentage ± SEM within CD11c+MHC-II+ cells in tumors from tamoxifen-treated Eif2ak3fl/+ or Eif2ak3fl/fl BrafV600E/+;Ptenfl/fl;Tyrosinase-CreERT2 mice vs. BrafV600E/+;Ptenfl/fl;Tyrosinase-CreERT2 mice (F) or from tamoxifen-exposed BrafV600E/+;Ptenfl/fl;Tyrosinase-CreERT2 mice treated with vehicle (Veh) or AMG44 (G). n=3-7/group (F); n=8/group (G). (H) Levels of CD80, CD86, or CD40 (MFI ± SEM) in cDC1, cDC2, and MoDCs from Scramble and PERKKO B16 tumors. n=8/group. (I) Representative histograms of eGFP in intra-tumor-MoDCs, cDC1 or cDC2 from B16-eGFP+ Scramble and B16-eGFP PERKKO-bearing mice. Representative of n=5/group. Statistics applied using one-way ANOVA (A – C, E, F) or Student’s t-test (D, G, H), *, p<0.05; ***, p < 0.001; ****, p < 0.0001. Please also see Figure S4.
Figure 5:
Figure 5:. PERK in tumor cells controls cMoP to MoDC ontogeny
(A) Percentage ± SEM of cMoPs (cKit/CD117+CSFR1/CD115LowCD135Ly6C+) in bone marrows (left), spleens (middle), and tumors (right) from mice implanted for 17 days with Scramble or PERKKO B16 tumors. n=7/group (left), n=8-10/group (middle), n=12-14 (right). (B) Percentage ± SEM of cMoPs within CD45+ cells in tumors from tamoxifen-exposed Eif2ak3fl/+ or Eif2ak3fl/fl BrafV600E/+;Ptenfl/fl;Tyrosinase-CreERT2 mice vs. BrafV600E/+;Ptenfl/fl;Tyrosinase-CreERT2 controls (left) or in tumors from tamoxifen-exposed BrafV600E/+;Ptenfl/fl;Tyrosinase-CreERT2 mice treated with vehicle or AMG44 (right). n=3-8/group (left), n=4-5/group (right). (C) Percentage ± SEM of MoDCs (CD11b+CD11c+MHC-II+Ly6C+CD103+) within cMoPs from tumors (left) and spleens (right) of mice bearing Scramble and PERKKO B16 tumors for 17 days. n=7-9/group (left), n=4-5/group (right). (D) Cell trace violet (CTV)-labeled splenic cKit+ cells were transferred into Scramble or PERKKO B16 tumors (left), and percentage of MoDCs ± SEM in CTV+ cells tested in tumors after 24 hours by flow cytometry (right). n=8-10/group (left), n=6/group (right). (E) Splenic cKit+ cells from Scramble or PERKKO B16-bearing mice were cultured for 48 hours with mGM-CSF and tested for MoDCs differentiation. Data show percentage of MoDCs ± SEM in cKit+ cells. (F-H) Mice received Sham Surgery or splenectomy and 14 days later, Scramble or PERKKO B16 tumors were injected on the opposite flank. A group of mice additionally received adoptive transfer (ACT) of splenic cKit+ cells on days 9 and 14 post-tumor injection (arrows). Tumor volume ± SEM (F), and percentage ± SEM of intra-tumor cMoPs (G) or MoDCs (H) were then tested. n=5/group. (I) Chemokine multiplex heatmap from Scramble or PERKKO B16 tumor homogenates from 5 mice/group. (J) CCR2 MFI ± SEM in intra-tumor cMoPs from Scramble and PERKKO B16 tumors. n=4/group. (K) Tumor growth ± SEM in mice bearing Scramble or PERKKO B16 tumors and treated with vehicle or BMS-CCR2-22 (0.5 mg/kg) daily starting since tumor inoculation. n=5/group. (L) Tumor volume ± SEM in Scramble or PERKKO B16 tumors injected into wildtype or Ccr2−/− mice. n=5/group. (M) Percentage ± SEM of intra-tumor cMoPs (in CD45+, left) and MoDCs (in CD11c+MHC-II+, right) in wildtype and Ccr2−/− mice bearing Scramble or PERKKO B16 tumors. n=4/group (left), n=8-10/group (right). Statistics were applied using one-way ANOVA (B left, F – H, K – M) or Student’s t-test (A, B right, C, D, E, I, J) *, p<0.05; **, p<0.01; ***, p < 0.001; ****, p < 0.0001. Please also see Figure S5.
Figure 6:
Figure 6:. Host-derived Type I IFN drives anti-tumor immune responses in PERKKO tumors
(A) Volcano plot indicating MoDC-linked transcripts from RNA-seq on cKit+ cells from control or PERKKO B16 tumors. Transcripts differentially (p < 0.05) elevated after PERK deletion are shown in red (log2 fold change > 1), and downregulated transcripts are in teal (log2 fold change < −1). n=4/group. (B) Selected RNA-seq transcripts of cKit+ cells from Scramble and PERKKO B16 tumors. Heatmap (top) showing differentially expressed type I IFNs-regulated transcripts (log2 transformed then z-score normalized). GSEA of IFN pathways from MSigDB (bottom). (C) Tumor volume ± SEM in mice bearing Scramble or PERKKO B16 tumors and treated with αIFNAR1 antibody or isotype (ISO). n=10/group. (D) Percentage ± SEM of cMoPs in tumor-CD45+ (left) and MoDCs in tumor-CD11c+MHC-II+ cells (right) from (C). n=4-13/group (left), n=7-9/group (right). (E) Tumor growth ± SEM in Scramble, PERKKO, Scramble Ifnb1KO and PERKKO;Ifnb1KO B16 tumors implanted into mice. n=5/group. (F) Volume ± SEM of Scramble or PERKKO B16 tumors injected into wildtype (WT) or Ifnar1−/− mice. n=7-10/group. (G) Percentage ± SEM of tumor-linked cMoPs (left) and MoDCs (right) in Scramble or PERKKO B16 tumors implanted into WT or Ifnar1−/− mice. n=4-7/group. (H) Proportion ± SEM of EGSRNQDWL-H-2Db-tetramer+ CD8+ T cells in tumors from WT or Ifnar1−/− mice injected with Scramble or PERKKO B16 tumors. n=4-7/group. (I) CCR2 (MFI ± SEM) in tumor-cMoPs from Scramble or PERKKO B16 tumors implanted into WT or Ifnar1−/− mice. n=4-5/group. Statistics applied using one-way ANOVA (C – I), *, p<0.05; **, p<0.01; ***, p<0.001; ****, p < 0.0001. Please also see Figure S6.
Figure 7:
Figure 7:. Type I IFN from DCs promotes migration and commitment of cMoPs into MoDCs in PERK-null tumors via STAT1
(A-B) IFNβ1-EYFP (MFI ± SEM) in Macrophages, MDSCs, cMoPs, and DCs (A), and cDC1, cDC2, or MoDCs (B) from Scramble or PERKKO B16 tumors from mice. n=3-4/group. (C) IFNβ1-EYFP (MFI ± SEM) in splenic MoDCs from Scramble or PERKKO B16 tumor-bearing mice. n=4/group. (D) IFNβ1-EYFP in splenic CD11c+ cells (MFI ± SEM) cultured with supernatants from Scramble or PERKKO B16 cells previously treated or not with Thaps, extensively washed, and cultured for 18 hours in regular media. n=6-9/group. (E) IFNβ1-EYFP MFI ± SEM in splenic CD11c+ cells exposed as in (D) and pretreated with EvB, PPADS or anti-HMGB1. n=6/group. (F) pSTAT1 (MFI ± SEM) in intra-tumor cMoPs from wildtype (WT) or Ifnar1−/− mice bearing Scramble or PERKKO B16 tumors. n=2-5/group. (G-H) Cell trace violet (CTV)-labeled splenic cKit+ cells from tumor-free mice were treated with vehicle or fludarabine (STAT1i, 100 μM) (G), or collected from WT or STAT1-null mice (H) and transferred into Scramble or PERKKO B16 tumors. Percentage of MoDCs in CTV+ cells tested in tumors 24 hours later. n=5-10/group (G); n=4-11/group (H). Statistics were applied using one-way ANOVA (E – H) or a Student’s t-test (A – D), *, p<0.05; **, p<0.01; ***, p < 0.001; ****, p < 0.0001. Please also see Figure S7.

Similar articles

Cited by

References

    1. Anders S, Pyl PT, and Huber W (2015). HTSeq--a Python framework to work with high-throughput sequencing data. Bioinformatics 31, 166–169. 10.1093/bioinformatics/btu638. - DOI - PMC - PubMed
    1. Atkins C, Liu Q, Minthorn E, Zhang SY, Figueroa DJ, Moss K, Stanley TB, Sanders B , Goetz A, Gaul N, et al. (2013). Characterization of a novel PERK kinase inhibitor with antitumor and antiangiogenic activity. Cancer Res. 73, 1993–2002. - PubMed
    1. Bezu L, Sauvat A, Humeau J, Gomes-da-Silva LC, Iribarren K, Forveille S, Garcia P, Zhao L, Liu P, Zitvogel L, et al. (2018). eIF2alpha phosphorylation is pathognomonic for immunogenic cell death. Cell Death Differ 25, 1375–1393. 10.1038/s41418-017-0044-9. - DOI - PMC - PubMed
    1. Bi M, Naczki C, Koritzinsky M, Fels D, Blais J, Hu N, Harding H, Novoa I, Varia M, Raleigh J, et al. (2005). ER stress-regulated translation increases tolerance to extreme hypoxia and promotes tumor growth. EMBO J. 24, 3470–3481. - PMC - PubMed
    1. Binnewies M, Roberts EW, Kersten K, Chan V, Fearon DF, Merad M, Coussens LM, Gabrilovich DI, Ostrand-Rosenberg S, Hedrick CC, et al. (2018). Understanding the tumor immune microenvironment (TIME) for effective therapy. Nat Med 24, 541–550. 10.1038/s41591-018-0014-x. - DOI - PMC - PubMed

Publication types