. 2022 Oct 20;82(20):3872-3884.e9.
doi: 10.1016/j.molcel.2022.08.029. Epub 2022 Sep 22.

Endogenous transcripts direct microRNA degradation in Drosophila, and this targeted degradation is required for proper embryonic development

Affiliations

Endogenous transcripts direct microRNA degradation in Drosophila, and this targeted degradation is required for proper embryonic development

Elena R Kingston et al. Mol Cell. .

Abstract

MicroRNAs (miRNAs) typically direct degradation of their mRNA targets. However, some targets have unusual miRNA-binding sites that direct degradation of cognate miRNAs. Although this target-directed miRNA degradation (TDMD) is thought to shape the levels of numerous miRNAs, relatively few sites that endogenously direct degradation have been identified. Here, we identify six sites, five in mRNAs and one in a noncoding RNA named Marge, which serve this purpose in Drosophila cells or embryos. These six sites direct miRNA degradation without collateral target degradation, helping explain the effectiveness of this miRNA-degradation pathway. Mutations that disrupt this pathway are lethal, with many flies dying as embryos. Concomitant derepression of miR-3 and its paralog miR-309 appears responsible for some of this lethality, whereas the loss of Marge-directed degradation of miR-310 miRNAs causes defects in embryonic cuticle development. Thus, TDMD is implicated in the viability of an animal and is required for its proper development.

Keywords: Drosophila embryonic development; Drosophila small RNAs; microRNAs; post-transcriptional gene regulation; target-directed miRNA degradation.


Conflict of interest statement

Declaration of interests D.P.B. is a member of Molecular Cell’s advisory board. E.R.K. has an immediate family member on Molecular Cell’s advisory board.

Figures

Figure 1.
Figure 1.. Embryonic Lethality and Dysregulation of miRNAs Upon Loss of dora, See also Figures S1, S2, and S3, and Tables S1A and S2
(A) Schematic of the Dora protein, showing regions of predicted disorder in light grey and plotting relative amino acid conservation below (Berezin et al., 2004). Also indicated are locations of the BC and Cullin boxes, which are predicted to interact with other components of the E3 ligase (Wang et al., 2013), and locations of the SWIM domain and the two mutations used in this study. (B) Hatching frequencies of embryos from crosses with either wild-type (WT) or dora heterozygous mothers (black and grey, respectively). Wild-type mothers, dora heterozygous mothers, and wild-type fathers had genotypes of WT/bal, dora/bal, and bal/Y, respectively, where ‘bal’ indicates the FM7c balancer, which is an engineered X chromosome that suppresses recombination, is recessive sterile, and contains a dominant phenotypic marker. Error bars indicate standard error (n = 3 sets of 300 embryos for each genotype; significance evaluated with a t-test). (C) Genotypes of early L1 larvae produced from crosses with dora heterozygous mothers, as in (B). Numbers quantify larvae from either the dora[A] or dora[B] cross that genotyped as either wild-type (bal/bal females or bal/Y males), heterozygous (dora/bal females), or mutant (dora/Y males) for Dora. (D) Changes in miRNA levels observed in 8–12 h dora[A] embryos compared to wild-type embryos, as determined by sRNA-seq. Each point shows the mean from two biological replicates, with red indicating miRNAs with statistically significant fold changes observed between mutant and wild-type embryos (FDR <0.01), blue indicating passenger strands of significantly up-regulated miRNAs, and magenta indicating an outlier not considered when calling Dora-sensitive miRNAs. (E and F) As in (D) but for 12–16 h and 16–20 h embryos, respectively. (G) Levels of miRNAs from the mir-3 primary transcript (schematic below) in wild-type (left) and dora[A] (right) embryos at 8–12 and 12–16 h. Points indicate values for each replicate, after normalizing to quantitative internal standards, and lines connect replicate averages. (H) As in (G), but for miRNAs from the mir-310 and mir-92 primary transcripts.
Figure 2.
Figure 2.. Transcripts that Direct miRNA Degradation in Drosophila Cells, See also Figure S4 and Table S3
(A) Pairing diagrams for trigger sites validated in S2 cells. For each site, the trigger sequence is on top (oriented 5′ to 3′), and the miRNA sequence is on the bottom (seed region in red). Vertical lines indicate Watson–Crick pairs, dots indicate G–U wobbles. (B and C) Northern blots probing for miR-12, miR-190, miR-7, and miR-277 following disruption of candidate trigger sites in wgn, zfh1, wnd, and h, respectively. Each RNA sample was from an independently derived clonal cell line (Table S3). Blots were also probed for miR-11, for use as a loading standard. For Dora-sensitive miRNAs, numbers below each band show miRNA levels relative to those in wild-type cells, after normalization to the loading standard. (D) Quantification of miR-9b levels, in wild-type, dora, and kah S2 cells, as determined by sRNA-seq (RPM, reads per million mapped to miRNAs). Each point represents results from a unique clonal cell line (Table S3). Significance is relative to wild-type samples, and was evaluated by ANOVA and the Tukey test (**, p < 0.01). (E) As in (D) but for miR-9c levels (***, p < 0.001). (F) As in (D) but for miR-999–3p in wild-type, dora, or ago1 S2 cells (***, p < 0.001; ****: p < 0.0001). (G) Distributions of transcript abundance (TPM, transcripts per million) for candidate triggers that either validated or failed to validate in S2 cells. Box-and-whisker plots show median, quartiles, and a range extending at most 1.5 times the inter-quartile range out from each hinge of average abundances, as measured by RNA-seq in wild-type S2 cells (n = 3). Significance was evaluated using a t-test, with Bonferroni adjustment to account for the seven other hypotheses that were considered.
Figure 3.
Figure 3.. Dominance of TDMD over miRNA-Directed Target Degradation, See also Figure S4 and Table S3
(A) Changes in mRNA levels observed after derepressing miR-190 in S2 cells. Shown are cumulative distributions of mean fold-changes observed for predicted targets (blue), top predicted targets (red), and a representative cohort of mRNAs not predicted to be targets but with a distribution of 3′ UTR lengths matching that of the predicted targets. Each genotype was represented by two independent clonal lines (Table S3). Significance was evaluated using the Kolmogorov-Smirnov test. (B) Levels of TDMD-triggering mRNAs after disrupting trigger sites. Plotted for each mRNA are mean abundancies (TPM) observed by RNA-seq after disrupting the site in that mRNA (self, purple) and after disrupting the site in one of the other four mRNAs (others, grey). Error bars show standard deviation of values from either two (self) or eight (others) independently derived clonal cell lines (Table S3). (C) Levels of TDMD-triggering mRNAs with and without Dora (WT and dora, respectively), as measured by RNA-seq. Error bars show standard deviation for TPM values from three independently derived clonal cell lines (Table S3). Significance of decreases observed upon loss of Dora were evaluated with a t-test (**, p < 0.01; *, p < 0.05).
Figure 4.
Figure 4.. CR43432-Directed Degradation of the miR-310 Family and its Requirement for Proper Embryonic Cuticle Development, See also Figure S5 and Table S1C
(A) Potential pairing between CR43432 (nucleotides 301 to 332 of the lncRNA) and each of the miR-310 family members, shown in the style of Figure 2A. Potential pairing to the miRNA 3′ regions occurred in two registers, one with a larger central loop bridging seed and 3′ pairing (left) and one with a smaller central loop (right). (B) Changes in levels of miRNAs from the mir-310 cluster upon disruption of the site in CR43432. Points show DESeq-determined fold-changes from two independently derived wild-type or mutant lines. Asterisks denote significant changes (*: p < 0.05, **: p < 0.01, ****: p < 0.0001; adjusted p values determined by DESeq). (C) Abundance of wild-type CR43432 during embryonic development, as determined by RNA-seq. Also shown is abundance of mutant CR43432 in CR43432 embryos at 8–12 and 12–16 h intervals. Points show TPM values for two independently derived lines (Table S3); lines connect replicate averages. (D and E) Changes in mRNA levels observed for 8–12 h (D) or 12–16 h (E) embryos after derepressing miR-310 family members by perturbing the site in CR43432. Otherwise, this panel is as in Figure 3A. (F) Quantification of denticles in the first four rows of the fourth, fifth, and sixth denticle belts (as counted from the posterior of the embryo) for both wild-type (WT) and CR43432 late-stage embryos. Error bars indicate standard error (n = 10, 15, and 15 embryos for belts 4, 5, and 6 of WT, respectively; n = 25, 27, or 21 embryos for belts 4, 5, and 6, of CR43432, respectively), significance determined with a t-test (*; p < 0.05, **; p < 0.01). (G) Size distributions of devitellinized embryonic cuticles prepared from wild-type and CR43432 late-stage embryos from two independently derived lines (Table S3). Areas for each mutant line and its paired wild-type control were normalized to the median area of the paired wild-type control. Box-and-whiskers show median, quartiles, and a range extending at most 1.5 times the inter-quartile range out from each hinge (significance evaluated with a t-test).
Figure 5:
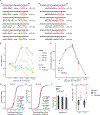
Figure 5:. Partial Rescue of Lethality Observed After Reducing Levels of the miR-3 family.
Counts of progeny observed from rescue crosses (dora[A]/FM7 females crossed to miR-3/CyO males) and control crosses (dora[A]/FM7 females crossed to WT/CyO males).

Similar articles

Cited by

References

    1. Agarwal V, Subtelny AO, Thiru P, Ulitsky I, and Bartel DP (2018). Predicting microRNA targeting efficacy in Drosophila. Genome biology 19, 152. 10.1186/s13059-018-1504-3 - DOI - PMC - PubMed
    1. Ameres SL, Horwich MD, Hung J-H, Xu J, Ghildiyal M, Weng Z, and Zamore PD (2010). Target RNA–directed trimming and tailing of small silencing RNAs. Science 328, 1534–1539. 10.1126/science.1187058 - DOI - PMC - PubMed
    1. Anders S, Pyl PT, and Huber W (2015). HTSeq—a Python framework to work with high-throughput sequencing data. Bioinformatics 31, 166–169. 10.1093/bioinformatics/btu638 - DOI - PMC - PubMed
    1. Aravin AA, Lagos-Quintana M, Yalcin A, Zavolan M, Marks D, Snyder B, Gaasterland T, Meyer J, and Tuschl T (2003). The small RNA profile during Drosophila melanogaster development. Dev cell 5, 337–350. 10.1016/S1534-5807(03)00228-4 - DOI - PubMed
    1. Baccarini A, Chauhan H, Gardner TJ, Jayaprakash AD, Sachidanandam R, and Brown BD (2011). Kinetic analysis reveals the fate of a microRNA following target regulation in mammalian cells. Current biology 21, 369–376. 10.1016/j.cub.2011.01.067 - DOI - PMC - PubMed

Publication types