. 2022 Sep;12(9):e1061.
doi: 10.1002/ctm2.1061.

PARK7 deficiency inhibits fatty acid β-oxidation via PTEN to delay liver regeneration after hepatectomy

Affiliations

PARK7 deficiency inhibits fatty acid β-oxidation via PTEN to delay liver regeneration after hepatectomy

Xiaoye Qu et al. Clin Transl Med. 2022 Sep.

Abstract

Transient regeneration-associated steatosis (TRAS) is a process of temporary hepatic lipid accumulation and is essential for liver regeneration by providing energy generated from fatty acid β-oxidation, but the regulatory mechanism underlying TRAS remains unknown. Parkinsonism-associated deglycase (Park7)/Dj1 is an important regulator involved in various liver diseases. In nonalcoholic fatty liver diseased mice, induced by a high-fat diet, Park7 deficiency improves hepatic steatosis, but its role in liver regeneration remains unknown METHODS: Park7 knockout (Park7-/- ), hepatocyte-specific Park7 knockout (Park7△hep ) and hepatocyte-specific Park7-Pten double knockout mice were subjected to 2/3 partial hepatectomy (PHx) RESULTS: Increased PARK7 expression was observed in the regenerating liver of mice at 36 and 48 h after PHx. Park7-/- and Park7△hep mice showed delayed liver regeneration and enhanced TRAS after PHx. PPARa, a key regulator of β-oxidation, and carnitine palmitoyltransferase 1a (CPT1a), a rate-limiting enzyme of β-oxidation, had substantially decreased expression in the regenerating liver of Park7△hep mice. Increased phosphatase and tensin homolog (PTEN) expression was observed in the liver of Park7△hep mice, which might contribute to delayed liver regeneration in these mice because genomic depletion or pharmacological inhibition of PTEN restored the delayed liver regeneration by reversing the downregulation of PPARa and CPT1a and in turn accelerating the utilization of TRAS in the regenerating liver of Park7△hep mice CONCLUSION: Park7/Dj1 is a novel regulator of PTEN-dependent fatty acid β-oxidation, and increasing Park7 expression might be a promising strategy to promote liver regeneration.

Keywords: Park7/Dj1; hepatocyte-specific knockout; liver regeneration; transient regeneration-associated steatosis.


Conflict of interest statement

The authors declare that they have no known competing financial interests or personal relationships that could have appeared to influence the work reported in this manuscript.

Figures

FIGURE 1
FIGURE 1
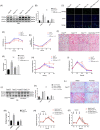
Park7 deficiency delays liver regeneration post‐2/3 partial hepatectomy (PHx). Wild‐type and Park7−/− mice were subjected to PHx. (A) Immunohistochemistry of Ki67 at indicated time points after PHx was performed. (B) Percentages of Ki67 positive hepatocytes were calculated (n = 4–6 mice/group). (C) Immunoblot of PCNA/CCND1 at indicated time points after PHx was performed (n = 4–6 mice/group). β‐Actin was used as a loading control. (D) PCNA/CCND1 expression was quantified. Representative of three experiments. (E) Liver‐to‐body weight ratios were calculated at indicated time points (n = 4–6 mice/group). (F) Mitotic counts were calculated at indicated time points (n = 4–6 mice/group). Data are shown as mean ± SEM. *p < .05; **p < .01; ***p < .001. Scale bar: 100 μm
FIGURE 2
FIGURE 2
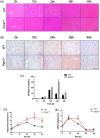
Park7‐deficient mice show enhanced transient regeneration–associated steatosis (TRAS) post‐2/3 partial hepatectomy (PHx). Wild‐type and Park7−/− mice were subjected to PHx. (A) Haematoxylin and eosin staining was performed at indicated time points after PHx. (B) Oil Red O staining was performed at indicated time points after PHx. (C) The quantitative analysis of Oil Red O staining according to the percentages of positive areas (n = 4–6 mice/group). (D) Hepatic triglycerides were evaluated at indicated time points after PHx (n = 4–6 mice/group). (E) Hepatic non‐esterified fatty acids were evaluated at indicated time points after PHx (n = 4–6 mice/group). Data are shown as mean ± SEM. *p < .05; **p < .01; ***p < .001. Scale bar: 100 μm
FIGURE 3
FIGURE 3
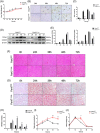
Hepatocyte‐specific Park7 depletion is sufficient to delay liver regeneration and enhance transient regeneration–associated steatosis (TRAS) post‐2/3 partial hepatectomy (PHx). Park7fl/fl and Park7△hep mice were subjected to PHx. (A) Liver‐to‐body weight ratios were calculated at indicated time points after PHx (n = 4–6 mice/group). (B) Immunohistochemistry of Ki67 at indicated time points after PHx was performed. (C) Percentages of Ki67 positive hepatocytes were calculated (n = 4–6 mice/group). (D) Immunoblot of PCNA/CCND1 at indicated time points after PHx was performed (n = 4–6 mice/group). β‐Actin was used as a loading control. (E) PCNA/CCND1 expression was quantified. Representative of three experiments. (F) Haematoxylin and eosin (HE) staining was performed at indicated time points after PHx. (G) Oil Red O staining was performed at indicated time points after PHx. (H) The areas of positive staining were quantified (n = 4–6 mice/group). (I) Hepatic triglycerides were evaluated at indicated time points after PHx (n = 4–6 mice/group). (J) Hepatic non‐esterified fatty acids were evaluated at the indicated times after PHx (n = 4–6 mice/group). Data are shown as mean ± SEM. *p < .05; **p < .01; ***p < .001. Scale bar: 100 μm
FIGURE 4
FIGURE 4
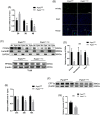
Park7 deficiency suppresses hepatic PPARa and carnitine palmitoyltransferase 1a (CPT1a) expression post‐2/3 partial hepatectomy (PHx). Park7fl/fl and Park7△hep mice were subjected to PHx. (A) mRNA expression of Ppara at the indicated times post‐PHx was determined by quantitative polymerase chain reaction (qPCR) (n = 3–4 mice/group). (B) Immunofluorescent staining of PPARa at 36‐h post‐PHx. Nuclei were counterstained with DAPI. (C) Immunoblot of nuclear, cytosolic and total PPARa at 36 h after PHx (n = 4–6 mice/group). β‐Actin, LaminB1 and GAPDH were used as loading controls for total protein, a nuclear protein and cytoplasmic protein, respectively. (D) PPARa expression was quantified. Representative of three experiments. (E) mRNA expression of CPT1a at the indicated times post‐PHx was determined by qPCR (n = 3–4 mice/group). (F) Immunoblot of CPT1a at 36‐h post‐PHx was performed (n = 4–6 mice/group). β‐Actin was used as a loading control. (G) CPT1a expression was quantified. Representative of three experiments. Data are shown as mean ± SEM. *p < .05; **p < .01; ***p < .001. Scale bar: 100 μm
FIGURE 5
FIGURE 5
Pten deficiency rescues the delayed liver regeneration post‐2/3 partial hepatectomy (PHx) in Park7 △hep mice. Park7fl/fl , Park7△hep , Pten△hep and Park7‐Pten △hep‐DKO mice were subjected to PHx. (A) Immunoblot of hepatic PARK7 and phosphatase and tensin homolog (PTEN) before or after PHx was performed (n = 4–6 mice/group). β‐Actin was used as a loading control. (B) PARK7 and PTEN expression was quantified. Representative of three experiments. (C) Liver‐to‐body weight ratios were calculated at indicated time points after PHx (n = 4–6 mice/group). (D) Immunoblot of PCNA/CCND1 at indicated time points after PHx was performed (n = 4–6 mice/group). β‐Actin was used as a loading control. (E) PCNA/CCND1 expression was quantified. Representative of three experiments. (F) Immunohistochemistry of hepatic Ki67 signals at 36 h after PHx was performed. (G) Percentages of Ki67 positive hepatocytes were calculated (n = 4–6 mice/group). Data are shown as mean ± SEM. *p < .05; **p < .01; ***p < .001. Scale bar: 100 μm
FIGURE 6
FIGURE 6
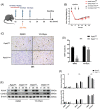
Phosphatase and tensin homolog (PTEN) inhibition rescues the delayed liver regeneration post‐2/3 partial hepatectomy (PHx) in Park7△hep mice. Park7fl/fl and Park7△hep mice were subjected to PHx. (A) The VO‐Ohpic treatment regimen is graphically illustrated. (B) Liver‐to‐body weight ratios were calculated at indicated time points after PHx (n = 4–6 mice/group). (C) Immunohistochemistry of hepatic Ki67 at 36 h after PHx was performed. (D) Percentages of Ki67 positive hepatocytes were calculated (n = 4–6 mice/group). (E) Immunoblot of PCNA/CCND1 at indicated time points post‐PHx was performed (n = 4–6 mice/group). β‐Actin was used as a loading control. (F) PCNA/CCND1 expression was quantified. Representative of three experiments. Data are shown as mean ± SEM. *p < .05; **p < .01; ***p < .001. Scale bar: 100 μm
FIGURE 7
FIGURE 7
Pten deficiency and inhibition enhance β‐oxidation and decrease transient regeneration–associated steatosis (TRAS) post‐2/3 partial hepatectomy (PHx). Parkinsonism‐associated deglycase (Park7)fl/fl , Park7△hep , Pten△hep and Park7‐Pten △hep‐DKO mice were subjected to PHx. (A) Immunoblot of hepatic peroxisome proliferator‐activated receptor‐a (PPARa) and carnitine palmitoyltransferase 1a (CPT1a) at 36‐h post‐PHx was performed (n = 4–6 mice/group). β‐Actin was used as a loading control. (B) PPARa and CPT1a expression was quantified. Representative of three experiments. (C) Immunofluorescent staining of hepatic PPARa at 36‐h post‐PHx. Nuclei were counterstained with DAPI. (D) Biochemical detection of intracellular NAD+/NADH ratios in Park7fl/fl , Park7△hep , Pten△hep and Park7‐Pten △hep‐DKO mice at indicated times after PHx (n = 3–4 mice/group). (E) Biochemical detection of hepatic ATP levels at the indicated times post‐2/3 PHx (n = 3–4 mice/group). (F) Oil Red O staining of hepatic lipid accumulation was performed at 36‐h post‐PHx. (G) The areas of positive staining were quantified (n = 4–6 mice/group). (H and I) Hepatic triglycerides (TG) (H) and non‐esterified fatty acids (NEFA) (I) in Park7fl/fl , Park7△hep , Pten△hep , Park7‐Pten △hep‐DKO mice were measured at indicated time points after PHx (n = 3–4 mice/group). (J) Immunoblot of hepatic PPARa and CPT1a at 36 h after PHx was performed in Park7fl/fl and Park7△hep mice with or without VO‐Ohpic treatment (n = 4–6 mice/group). β‐Actin was used as a loading control. (K) PPARa and CPT1a expression were quantified. Representative of three experiments. (L) Oil Red O staining of liver tissues was performed at 36 h after PHx in Park7fl/fl and Park7△hep mice with or without VO‐Ohpic treatment. (M) The areas of positive staining were quantified (n = 4–6 mice/group). (N and O) Hepatic TG (N) and NEFA (O) were measured at indicated time points after PHx in Park7fl/fl and Park7△hep mice with or without VO‐Ohpic treatment (n = 3–4 mice/group). Data are shown as mean ± SEM. *p < .05; **p < .01; *** p < .001. Scale bar: 100 μm
FIGURE 8
FIGURE 8
Hepatocyte growth factor (HGF)/epidermal growth factor (EGF)‐activated erythroid 2–related factor 2 (NRF2) plays a key role in regulating Park7 expression post–partial hepatectomy (PHx). (A) mRNA levels of HGF and epidermal growth factor (HB)‐EGF at the indicated times post‐PHx were determined by quantitative polymerase chain reaction (qPCR) (n = 3–4 mice/group). (B) Immunoblot of PARK7 in AML12 cells incubated with HGF or EGF (50 ng/ml) for 12 and 24 h was performed (n = 3 replicates/group). β‐Actin was used as a loading control. (C) PARK7 expression was quantified. Representative of three experiments. (D) Immunoblot of nuclear NRF2 at 36 and 48‐h post‐PHx was performed (n = 4–6 mice/group). LambinB1 was used as a loading control. (E) NRF2 expression was quantified. Representative of three experiments. (F) ChIP–PCR analysis of NRF2 binding to the Park7 promoter. Protein‐bound chromatin was prepared from AML12 and immunoprecipitated with NRF2 antibody, and then the immunoprecipitated DNA was analysed by PCR. Neg, negative control without DNA template. (G) Localization of NRF2‐binding sites on mouse Park7. (H) mRNA expression of Park7 in AML12 cells treated with HGF or EGF (50 ng/ml) for 24 h between NS‐siRNA and Nrf2‐siRNA groups (n = 3 replicates/group). (I) Immunoblot of PARK7 in AML12 cells treated with HGF or EGF between NS‐siRNA and Nrf2‐siRNA groups (n = 3 replicates/group). β‐Actin was used as a loading control. (J) PARK7 expression was quantified. Representative of three experiments. Data are shown as mean ± SEM. *p < .05; **p < .01; *** p < .001

Similar articles

Cited by

References

    1. Fausto N, Campbell JS, Riehle KJ. Liver regeneration. Hepatology. 2006;43:S45‐S53. - PubMed
    1. Miyaoka Y, Miyajima A. To divide or not to divide: revisiting liver regeneration. Cell Div. 2013;8:8. - PMC - PubMed
    1. Rudnick DA, Davidson NO. Functional relationships between lipid metabolism and liver regeneration. Int J Hepatol. 2012;2012:549241. - PMC - PubMed
    1. Holecek M. Nutritional modulation of liver regeneration by carbohydrates, lipids, and amino acids: a review. Nutrition. 1999;15:784‐788. - PubMed
    1. Gazit V, Weymann A, Hartman E, et al. Liver regeneration is impaired in lipodystrophic fatty liver dystrophy mice. Hepatology. 2010;52:2109‐2117. - PMC - PubMed