. 2022 Sep 23:11:e79771.
doi: 10.7554/eLife.79771.

A feed-forward pathway drives LRRK2 kinase membrane recruitment and activation

Affiliations

A feed-forward pathway drives LRRK2 kinase membrane recruitment and activation

Edmundo G Vides et al. Elife. .

Abstract

Activating mutations in the leucine-rich repeat kinase 2 (LRRK2) cause Parkinson's disease, and previously we showed that activated LRRK2 phosphorylates a subset of Rab GTPases (Steger et al., 2017). Moreover, Golgi-associated Rab29 can recruit LRRK2 to the surface of the Golgi and activate it there for both auto- and Rab substrate phosphorylation. Here, we define the precise Rab29 binding region of the LRRK2 Armadillo domain between residues 360-450 and show that this domain, termed 'site #1,' can also bind additional LRRK2 substrates, Rab8A and Rab10. Moreover, we identify a distinct, N-terminal, higher-affinity interaction interface between LRRK2 phosphorylated Rab8 and Rab10 termed 'site #2' that can retain LRRK2 on membranes in cells to catalyze multiple, subsequent phosphorylation events. Kinase inhibitor washout experiments demonstrate that rapid recovery of kinase activity in cells depends on the ability of LRRK2 to associate with phosphorylated Rab proteins, and phosphorylated Rab8A stimulates LRRK2 phosphorylation of Rab10 in vitro. Reconstitution of purified LRRK2 recruitment onto planar lipid bilayers decorated with Rab10 protein demonstrates cooperative association of only active LRRK2 with phospho-Rab10-containing membrane surfaces. These experiments reveal a feed-forward pathway that provides spatial control and membrane activation of LRRK2 kinase activity.

Keywords: LRRK2 kinase; Parkinson's disease; Rab GTPase; biochemistry; cell biology; chemical biology; feed-forward pathway; human; membrane microdomain.


Conflict of interest statement

EV, AA, CC, PL, EP, CL, JS, ES, HD, DA No competing interests declared, SP Senior editor, eLife

Figures

Figure 1.
Figure 1.. Rab29 binds to the C-terminal portion of the LRRK2 Armadillo domain.
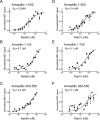
Microscale thermophoresis of full-length (residues 1–552), labeled LRRK2 Armadillo domain with His-Rab29 (A) or with His-Rab7 (B). (C, D) Microscale thermophoresis of labeled LRRK2 Armadillo domain residues 1–159 (C) or 350–550 (D) with Rab29. Purified Rab29 was serially diluted and then NHS-RED-labeled-LRRK2 Armadillo (final concentration 100 nM) was added. Graphs show mean and SEM from three independent measurements, each from a different set of protein preparations. Data are summarized in Table 1.
Figure 2.
Figure 2.. Rab8A and Rab10 bind to the LRRK2 Armadillo domain.
(A–C) Microscale thermophoresis of labeled, LRRK2 Armadillo domain fragments comprised of residues 1–552, 1–159, or 350–550 with Rab8A Q67L as indicated. (C–E) Microscale thermophoresis for Rab10 Q68L (1–181) with indicated LRRK2 Armadillo fragments, as in (A). Purified Rab proteins were serially diluted and then NHS-RED-labeled LRRK2 Armadillo domain (final concentration 100 nM) was added. Graphs show mean and SEM from three independent measurements, each from a different set of protein preparations. Data are summarized in Table 1.
Figure 3.
Figure 3.. Characterization of critical LRRK2 residues mediating binding to Rab29.
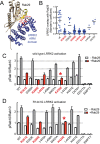
(A). Predicted interactions between Rab29 and the LRRK2 Armadillo domain using AlphaFold docking (Jumper et al., 2021), ColabFold (Mirdita et al., 2022), and the AlphaFold2_advanced.ipynb notebook default settings. Residues identified in red show key contacts between LRRK2 and Rab29; orange and yellow coloring indicates the Switch I and Switch II domains of Rab29. (B) The wild-type and indicated mutants of full length of GFP-LRRK2 were co-expressed with HA-Rab29 in HeLa cells. 24 hr post transfection, cells were fixed and localization assessed by confocal microscopy. LRRK2 overlap with Rab29 is presented as a Mander’s coefficient determined using CellProfiler software (McQuin et al., 2018). (C, D) Wild-type and indicated mutants of full length of GFP-LRRK2 (C) or GFP-LRRK2 R1441G (D) were co-expressed with HA-Rab29 in HEK293T cells. 24 hr post transfection, cells were lysed and extracts immunoblotted with the indicated antibodies. Shown are the averages and standard deviations of duplicate determinations; red asterisks indicate preferred mutant.
Figure 3—figure supplement 1.
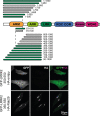
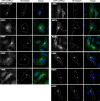
Figure 3—figure supplement 1.. Top: Fragments of GFP-LRRK2 that were co-expressed with HA-Rab29 in HeLa cells.
24 hr post transfection, cells were fixed and localization assessed by confocal microscopy. Fragments that co-localized with Rab29 at the Golgi are shown in green and those that failed to co-localize in gray. The smallest fragment of LRRK2 that co-localized with Rab29 encompassed residues 350–550 (shown below). Magnification bar, 20 µm.
Figure 3—figure supplement 2.
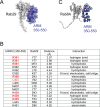
Figure 3—figure supplement 2.. Residues predicted to be critical for Rab29 interaction with part of the LRRK2 Armadillo domain and comparison with an AlphaFold model for the complex with Rab8A.
(A) AlphaFold model of a complex of Rab29 (gray) bound to the 350–550 fragment of LRRK2 (purple) as in Figure 3A. (B) Table of site #1 residues predicted to lie within the interface of LRRK2 and Rab29. Highlighted in red are residues that when mutated suppress interaction of LRRK2 with Rab29 and inhibit Rab29-mediated LRRK2 activation in cells. (C) AlphaFold model of a complex of Rab8A (gray) bound to the 350–550 fragment of LRRK2 (navy); red residues are R361, R399, L403, and K439.
Figure 3—figure supplement 3.
Figure 3—figure supplement 3.. Examples of micrographs used to create Figure 3B.
Mutants (indicated) of full-length GFP-LRRK2 were co-expressed with HA-Rab29 in HeLa cells. 24 hr post transfection, cells were fixed and localization assessed by confocal microscopy. Magnification bars, 20 µm.
Figure 3—figure supplement 4.
Figure 3—figure supplement 4.. Immunoblots used to obtain Figure 3C and D.
Wild-type and indicated mutants of full length of GFP-LRRK2 (A) or R1441G LRRK2 (B) were co-expressed with HA-Rab29 in HEK293T cells. 24 hr post transfection, cells were fixed and samples analyzed for immunoblotting. Each membrane was probed with anti-pRab10 (rabbit), anti-Rab10 (mouse), and anti-HA (rat) antibodies. pRab10 and Rab10 signals were detected using 800 (anti-rabbit) and 680 (anti-mouse) channels in LI-COR, whereas the HA (showing Rab29 expression) was developed using ECL (anti-rat). Numbers at the left of each gel represent the mobility of molecular weight markers in kilodaltons.
Figure 4.
Figure 4.. PhosphoRab8A and phosphoRab10 bind with high affinity to the N-terminal portion of the LRRK2 Armadillo domain.
(A–F) Microscale thermophoresis of labeled, indicated, LRRK2 Armadillo fragments with His-phosphoRab8A Q67L (A–C) or with His phosphoRab10 Q68L 1–181 (pRab10; D–F). Purified Rab proteins were phosphorylated with Mst3 kinase at 27°C for 2 hr and then serially diluted; NHS-RED-labeled Armadillo (final concentration 100 nM) was then added. Graphs show mean and SEM from three independent measurements, each from a different set of protein preparations.
Figure 5.
Figure 5.. Identification of a basic patch at the N-terminus of LRRK2 that is needed for phosphoRab interaction.
(A) Electrostatic surface potential of LRRK2 Armadillo domain residues 1–552 modeled using Chimera 2 software (Pettersen et al., 2004); blue indicates a positively charged surface. LRRK2 K17 and K18 are indicated. (B) AlphaFold (Jumper et al., 2021) structure of putative, active LRRK2 with residues that mediate Rab29 binding shown in red (site #1) and the K17/K18 residues that are required for phosphoRab10 binding (site #2) shown in magenta; the kinase domain is shown in blue. (C, D) Microscale thermophoresis of labeled, full-length LRRK2 K17A or K18A Armadillo 1–552 with His phosphoRab10 Q68L 1–181. Purified Rab10 protein was phosphorylated with Mst3 kinase at 27°C for 2 hr and then serially diluted; NHS-RED-labeled Armadillo (final concentration 100 nM) was then added. Graphs show mean and SEM from three independent measurements, each from a different set of protein preparations.
Figure 6.
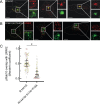
Figure 6.. LRRK2 K17 and K18 are critical for pRab10 interaction in cells.
(A) FLAG-LRRK2 R1441G (red) was transfected into HeLa cells plated on collagen-coated coverslips and co-localized with endogenous wild-type pRab10 (green). Cells on coverslips were dipped in liquid nitrogen to deplete cytosol and enhance membrane-bound signal. Insets show enlargements of boxed areas representing peri-centriolar LRRK2 and pRab10. (B) FLAG-LRRK2 R1441G/K17A/K18A (red) was transfected into HeLa cells plated on collagen-coated coverslips and stained and localized with pRab10 (green) as in (A). Scale bars, 10µm. (C) Quantification of pRab10 overlap with LRRK2 by Mander’s coefficient. Error bars represent SEM of means from three different experiments (represented by colored dots), each with >40 cells per condition. Significance was determined by t-test, *p=0.0108.
Figure 7.
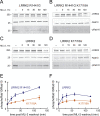
Figure 7.. LRRK2 K17 and K18 increase endogenous pRab10 recovery after LRRK2 inhibitor washout.
(A–D) FLAG-LRRK2 R1441G, FLAG-LRRK2 R1441G/K17A/K18A, LRRK2, or LRRK2 K17A/K18A was transfected into HeLa cells. 48 hr post transfection, cells were treated with 200 nM of MLi-2 for 1 hr. The MLi-2 was then removed by multiple washes and incubated for the indicated times prior to cell lysis. Whole-cell extracts (20 µg) were subjected to quantitative immunoblot analysis using anti-LRRK2, anti-Rab10, and anti-pRab10 antibodies. Numbers at the left of the gels represent the mobilities of molecular weight markers in kilodaltons. (E, F) Quantification of pRab10/total Rab10 fold change and normalized to no MLi2 control. Error bars represent mean ± SD from two different experiments per condition.
Figure 8.
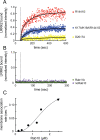
Figure 8.. Feed-forward pathway for Rab10 phosphorylation is dependent on LRRK2 kinase activity.
(A) Fluorescence intensity traces of individual, single molecules of 7 nM CF633-labeled FLAG-LRRK2 R1441G on a substrate-supported lipid bilayer decorated with lipid-anchored GFP-Rab10 Q68L-His across 600 s of live total internal reflection (TIRF) microscopy. Red, R1441G; blue, K17A/K18A/R1441G; yellow, D2017A. (B) Reactions were carried out as in (A) except Rab10 was omitted (purple) or Rab10 was replaced with Rab11 (green). Dashed lines in (A) and (B) represent time of addition of fluorescently labeled LRRK2 at 60 s; shown are representative experiments carried out at least three times for each condition. Fluorescence intensity was fitted by a nonlinear regression curve for two-phase association. Fold change was calculated by dividing the average fluorescence intensity at steady state and subtracting background fluorescence intensity average determined from 60 s prior to LRRK2 addition. (C) Rate of membrane association of LRRK2 as a function of Rab10 concentration. This curve was fitted by a nonlinear regression fit using PRISM software (MathWorks) to determine a Hill coefficient. Data are from two independent experiments plotted together.
Figure 8—figure supplement 1.
Figure 8—figure supplement 1.. Quantitative analysis of total internal reflection (TIRF) images of LRRK2 recruitment on planar lipid bilayers.
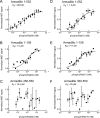
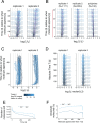
(A) Ridge plot showing the distribution of the fluorescence intensity of CF633-labeled LRRK2 molecules (or complexes) as a function of the time elapsed since the molecule first appeared on the surface. Two replicates of LRRK2 are shown. For each molecule, the fluorescence intensity It at each time point t was normalized with respect to its initial intensity I0 during the first frame when the molecule first appeared on the surface. The intensity distributions are shown in log scale (x axis). Intensity distributions were computed using the average intensity of each molecule over 25 s increments. Purple data points and error bars below each distribution show its mean and standard deviation. For each time point t, all the molecules with a fluorescence lifetime greater than t were used to compute the distribution. The number of such molecules at each time point is shown in panel (E). (B) Same ridge plot as in (A) showing the evolution of the fluorescence intensity with greater temporal resolution during the first 30 s after a molecule appeared on the surface. Here, the intensity distributions were computed using the average intensity of each molecule over 1.5 s increments. Only molecules with a fluorescence lifetime larger than 30 s were included in this ridge plot (N = 1171, 2334, and 106) molecules respectively for the three conditions shown (left to right). (C) Individual fluorescence intensity over time for the 30 molecules with the longest fluorescence lifetimes as in (A). (D) Ridge plot showing the distribution of the initial fluorescence intensity I0 of individual CF633-labeled LRRK2 molecules or complexes when they first appeared on the surface as a function of the time elapsed since the first molecule was detected (referred to as the absolute time T). These initial intensities were normalized to the median initial intensity of all molecules. (E) Inverse cumulative distribution of the fluorescence lifetime of individual molecules. (F) Percentage of molecules that were ‘ultrabright’ when they first appeared on the surface as a function of the absolute time T at which they appeared. Ultrabright refers to molecules with an initial intensity greater than 21.5 fold the median initial intensity across all molecules (log2[I0/median(I0)] > 1.5).
Figure 8—figure supplement 2.
Figure 8—figure supplement 2.. The LRRK2 Armadillo domain can bind phosphorylated Rab10 and unphosphorylated Rab8A simultaneously.
GST-Rab8A Q67L was immobilized on glutathione agarose, then LRRK2 Armadillo (or buffer) was added; beads were washed and His-phosphoRab10 Q68L was then added. Bead-bound material (triplicates shown) was eluted with reduced glutathione and analyzed by immunoblotting. Input, 50% of that used in each binding reaction. PhosphoRab10 (5% of input) was detected only in ARM domain-containing samples, consistent with the KD values.
Figure 9.
Figure 9.. PhosphoRab8A activates LRRK2 phosphorylation of Rab10 in solution.
(A) Immunoblot analysis of the kinetics of LRRK2 G2019S phosphorylation of Rab10 with and without additional pRab8. Upper gel: GFP-Rab10 Q68L His substrate. Lower gel: His-Sumo-Rab10 wild-type full-length substrate. Indicated reactions contained 200 nM MLi-2. pRab8A was detected with anti-phosphoRab8A antibody. (B) Same as panel (A) with K18A-LRRK2-R1441G and His-Sumo-Rab10 wild-type full-length as substrate. PhosphoRab8A was detected with total Rab8 antibody. (C) Kinetics of phosphoRab10 production as in (A). Shown are the combined means of independent, quadruplicate determinations ± SEM, as indicated. (D) PhosphoRab10 production as in (B). Shown are the combined means of independent duplicate determinations,± SEM, as indicated. Background signal in the presence of pRab8A is likely due to trace MST3 contamination that is not sensitive to MLi-2 inhibition and was subtracted. pRab8 preparation was by method #1 for (A), upper gel, and (B), and method #2 was used in panel (A), lower gel.
Figure 10.
Figure 10.. A model for LRRK2 membrane recruitment.
LRRK2 can interact with non-phosphorylated Rab GTPases via site #1. Once membrane bound, it can generate phosphoRabs that can now engage site #2. Rab binding to both sites increases the avidity of LRRK2 for membranes and retains LRRK2 on the membrane surface to phosphorylate more Rab substrates. We have shown that LRRK2 binding to phosphoRabs also activates the kinase, likely by altering its oligomeric state.

Similar articles

Cited by

References

    1. Adhikari A, Vides E, Pfeffer SR. Reconstitution of LRRK2 membrane recruitment onto planar lipid bilayers V1. Protocols.io. 2022 doi: 10.17504/protocols.io.x54v9y7qzg3e/v1. - DOI
    1. Alessi DR, Sammler E. Lrrk2 kinase in parkinson’s disease. Science. 2018;360:36–37. doi: 10.1126/science.aar5683. - DOI - PubMed
    1. Ashkenazy H, Abadi S, Martz E, Chay O, Mayrose I, Pupko T, Ben-Tal N. ConSurf 2016: an improved methodology to estimate and visualize evolutionary conservation in macromolecules. Nucleic Acids Research. 2016;44:W344–W350. doi: 10.1093/nar/gkw408. - DOI - PMC - PubMed
    1. Barbero P, Bittova L, Pfeffer SR. Visualization of rab9-mediated vesicle transport from endosomes to the trans-Golgi in living cells. The Journal of Cell Biology. 2002;156:511–518. doi: 10.1083/jcb.200109030. - DOI - PMC - PubMed
    1. Berger Z, Smith KA, Lavoie MJ. Membrane localization of LRRK2 is associated with increased formation of the highly active LRRK2 dimer and changes in its phosphorylation. Biochemistry. 2010;49:5511–5523. doi: 10.1021/bi100157u. - DOI - PMC - PubMed

Publication types

MeSH terms

Substances