Metabolic Adaptation as Potential Target in Papillary Renal Cell Carcinomas Based on Their In Situ Metabolic Characteristics
- PMID: 36142502
- PMCID: PMC9503093
- DOI: 10.3390/ijms231810587
Metabolic Adaptation as Potential Target in Papillary Renal Cell Carcinomas Based on Their In Situ Metabolic Characteristics
Abstract
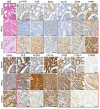
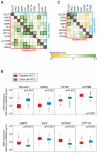
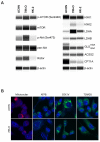
Metabolic characteristics of kidney cancers have mainly been obtained from the most frequent clear cell renal cell carcinoma (CCRCC) studies. Moreover, the bioenergetic perturbances that affect metabolic adaptation possibilities of papillary renal cell carcinoma (PRCC) have not yet been detailed. Therefore, our study aimed to analyze the in situ metabolic features of PRCC vs. CCRCC tissues and compared the metabolic characteristics of PRCC, CCRCC, and normal tubular epithelial cell lines. The protein and mRNA expressions of the molecular elements in mammalian target of rapamycin (mTOR) and additional metabolic pathways were analyzed in human PRCC cases compared to CCRCC. The metabolic protein expression pattern, metabolite content, mTOR, and metabolic inhibitor sensitivity of renal carcinoma cell lines were also studied and compared with tubular epithelial cells, as "normal" control. We observed higher protein expressions of the "alternative bioenergetic pathway" elements, in correlation with the possible higher glutamine and acetate consumption in PRCC cells instead of higher glycolytic and mTOR activity in CCRCCs. Increased expression of certain metabolic pathway markers correlates with the detected differences in metabolite ratios, as well. The lower lactate/pyruvate, lactate/malate, and higher pyruvate/citrate intracellular metabolite ratios in PRCC compared to CCRCC cell lines suggest that ACHN (PRCC) have lower Warburg glycolytic capacity, less pronounced pyruvate to lactate producing activity and shifted OXPHOS phenotype. However, both studied renal carcinoma cell lines showed higher mTOR activity than tubular epithelial cells cultured in vitro, the metabolite ratio, the enzyme expression profiles, and the higher mitochondrial content also suggest increased importance of mitochondrial functions, including mitochondrial OXPHOS in PRCCs. Additionally, PRCC cells showed significant mTOR inhibitor sensitivity and the used metabolic inhibitors increased the effect of rapamycin in combined treatments. Our study revealed in situ metabolic differences in mTOR and metabolic protein expression patterns of human PRCC and CCRCC tissues as well as in cell lines. These underline the importance in the development of specific new treatment strategies, new mTOR inhibitors, and other anti-metabolic drug combinations in PRCC therapy.
Keywords: in situ expression and in vitro studies; mTOR; metabolism; papillary renal cell carcinoma.
Conflict of interest statement
The authors declare that the research was conducted in the absence of any commercial or financial relationships that could be construed as a potential conflict of interest.
Figures


Similar articles
-
Characterization of papillary and clear cell renal cell carcinoma through imaging mass cytometry reveals distinct immunologic profiles.Front Immunol. 2023 Aug 11;14:1182581. doi: 10.3389/fimmu.2023.1182581. eCollection 2023. Front Immunol. 2023. PMID: 37638025 Free PMC article.
-
Papillary renal cell carcinoma and clear cell renal cell carcinoma: Differentiation of distinct histological types with contrast - enhanced ultrasonography.Eur J Radiol. 2015 Oct;84(10):1849-56. doi: 10.1016/j.ejrad.2015.06.017. Epub 2015 Jun 25. Eur J Radiol. 2015. PMID: 26149528
-
Diagnostic and prognostic tissuemarkers in clear cell and papillary renal cell carcinoma.Cancer Biomark. 2010;7(6):261-8. doi: 10.3233/CBM-2010-0195. Cancer Biomark. 2010. PMID: 21694464 Review.
-
MR characteristics of mucinous tubular and spindle cell carcinoma (MTSCC) of the kidney: comparison with clear cell and papillary subtypes of renal cell carcinoma.Abdom Radiol (NY). 2021 Nov;46(11):5250-5259. doi: 10.1007/s00261-021-03227-0. Epub 2021 Aug 2. Abdom Radiol (NY). 2021. PMID: 34338814
-
Recent advances in the systemic treatment of metastatic papillary renal cancer.Expert Rev Anticancer Ther. 2009 Mar;9(3):373-9. doi: 10.1586/14737140.9.3.373. Expert Rev Anticancer Ther. 2009. PMID: 19275514 Review.
Cited by
-
mTOR hyperactivity and RICTOR amplification as targets for personalized treatments in malignancies.Pathol Oncol Res. 2024 Mar 7;30:1611643. doi: 10.3389/pore.2024.1611643. eCollection 2024. Pathol Oncol Res. 2024. PMID: 38515456 Free PMC article. Review.
-
Novel RICTOR amplification harbouring entities: FISH validation of RICTOR amplification in tumour tissue after next-generation sequencing.Sci Rep. 2023 Nov 10;13(1):19610. doi: 10.1038/s41598-023-46927-x. Sci Rep. 2023. PMID: 37949943 Free PMC article.
-
Folate induces stemness and increases oxygen consumption under glucose deprivation by notch-1 pathway activation in colorectal cancer cell.Mol Cell Biochem. 2025 Jan;480(1):505-519. doi: 10.1007/s11010-024-04987-1. Epub 2024 Mar 27. Mol Cell Biochem. 2025. PMID: 38536555
-
Endoplasmic Reticulum Stress in Renal Cell Carcinoma.Int J Mol Sci. 2023 Mar 3;24(5):4914. doi: 10.3390/ijms24054914. Int J Mol Sci. 2023. PMID: 36902344 Free PMC article. Review.
References
-
- Linehan W.M., Schmidt L.S., Crooks D.R., Wei D., Srinivasan R., Lang M., Ricketts C.J. The Metabolic Basis of Kidney Cancer. Cancer Discov. 2019;9:1006–1021. doi: 10.1158/2159-8290.CD-18-1354. - DOI - PubMed
-
- Tong W.H., Sourbier C., Kovtunovych G., Jeong S.Y., Vira M., Ghosh M., Romero V.V., Sougrat R., Vaulont S., Viollet B., et al. The glycolytic shift in fumarate-hydratase-deficient kidney cancer lowers AMPK levels, increases anabolic propensities and lowers cellular iron levels. Cancer Cell. 2011;20:315–327. doi: 10.1016/j.ccr.2011.07.018. - DOI - PMC - PubMed
MeSH terms
Substances
Grants and funding
- ÚNKP_18-3-III-SE-24/New National Excellence Program of the Ministry of Human Capacities
- NKFI-FK-128404/National Research, Development and Innovation Office
- STIA-KFI-2020/Semmelweis Scientific and Innovation Fund
- National Bionics Program, ED_17-1-2017-0009/National Research, Development and Innovation Fund of Hungary
- FKIP/Higher Education Excellence Program at Semmelweis University
LinkOut - more resources
Full Text Sources
Medical
Miscellaneous

