Pharmacological Inhibition of Inositol Hexakisphosphate Kinase 1 Protects Mice against Obesity-Induced Bone Loss
- PMID: 36138736
- PMCID: PMC9495776
- DOI: 10.3390/biology11091257
Pharmacological Inhibition of Inositol Hexakisphosphate Kinase 1 Protects Mice against Obesity-Induced Bone Loss
Abstract
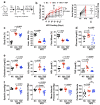
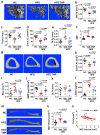
Obesity and type II diabetes mellitus (T2DM) are prominent risk factors for secondary osteoporosis due to the negative impacts of hyperglycemia and excessive body fat on bone metabolism. While the armamentarium of anti-diabetic drugs is expanding, their negative or unknown impacts on bone metabolism limits effectiveness. The inactivation of inositol hexakisphosphate kinase 1 (IP6K1) protects mice from high-fat-diet (HFD)-induced obesity (DIO) and insulin resistance by enhancing thermogenic energy expenditure, but the role of this kinase and the consequences of its inhibition on bone metabolism are unknown. To determine if IP6K1 inhibition in obese mice affords protection against obesity-induced metabolic derangements and bone loss, we maintained 2-month-old mice on a normal chow control diet or HFD under thermal neutral conditions for 100 d. Beginning on day 40, HFD-fed mice were divided into two groups and administered daily injections of vehicle or the pan-IP6K inhibitor TNP [N2-(m-Trifluorobenzyl), N6-(p-nitrobenzyl) purine]. HFD-fed mice developed obesity, hyperglycemia, hyperlipidemia, and secondary osteoporosis, while TNP administration protected mice against HFD-induced metabolic and lipid derangements and preserved bone mass, mineral density, and trabecular microarchitecture, which correlated with reduced serum leptin levels, reduced marrow adiposity, and preservation of marrow resident skeletal stem/progenitor cells (SSPCs). TNP also exhibited hypotensive activity, an unrealized benefit of the drug, and its prolonged administration had no adverse impacts on spermatogenesis. Together, these data indicate that the inhibition of IP6K1 using selective inhibitors, such as TNP, may provide an effective strategy to manage obesity and T2DM due to its bone sparing effects.
Keywords: anti-obesity drugs; diet; high fat; inositol hexakisphosphate kinase 1; mesenchymal stem cells; obesity; osteoporosis; skeletal; stem cells.
Conflict of interest statement
The authors declare no conflict of interest.
Figures


Similar articles
-
TNP [N2-(m-Trifluorobenzyl), N6-(p-nitrobenzyl)purine] ameliorates diet induced obesity and insulin resistance via inhibition of the IP6K1 pathway.Mol Metab. 2016 Aug 21;5(10):903-917. doi: 10.1016/j.molmet.2016.08.008. eCollection 2016 Oct. Mol Metab. 2016. PMID: 27689003 Free PMC article.
-
Targeting the Inositol Pyrophosphate Biosynthetic Enzymes in Metabolic Diseases.Molecules. 2020 Mar 19;25(6):1403. doi: 10.3390/molecules25061403. Molecules. 2020. PMID: 32204420 Free PMC article. Review.
-
IP6K1 Reduces Mesenchymal Stem/Stromal Cell Fitness and Potentiates High Fat Diet-Induced Skeletal Involution.Stem Cells. 2017 Aug;35(8):1973-1983. doi: 10.1002/stem.2645. Epub 2017 Jun 15. Stem Cells. 2017. PMID: 28577302 Free PMC article.
-
Synthesis and characterization of novel isoform-selective IP6K1 inhibitors.Bioorg Med Chem Lett. 2019 Oct 1;29(19):126628. doi: 10.1016/j.bmcl.2019.126628. Epub 2019 Aug 20. Bioorg Med Chem Lett. 2019. PMID: 31445853 Free PMC article.
-
Adipocyte-specific deletion of Ip6k1 reduces diet-induced obesity by enhancing AMPK-mediated thermogenesis.J Clin Invest. 2016 Nov 1;126(11):4273-4288. doi: 10.1172/JCI85510. Epub 2016 Oct 4. J Clin Invest. 2016. PMID: 27701146 Free PMC article.
Cited by
-
Novel role for alpha-2-macroglobulin (A2M) as a disease modifying protein in senile osteoporosis.Front Cell Dev Biol. 2023 Oct 30;11:1294438. doi: 10.3389/fcell.2023.1294438. eCollection 2023. Front Cell Dev Biol. 2023. PMID: 37965574 Free PMC article.
-
The IP6K Inhibitor LI-2242 Ameliorates Diet-Induced Obesity, Hyperglycemia, and Hepatic Steatosis in Mice by Improving Cell Metabolism and Insulin Signaling.Biomolecules. 2023 May 20;13(5):868. doi: 10.3390/biom13050868. Biomolecules. 2023. PMID: 37238737 Free PMC article.
-
Insights into the roles of inositol hexakisphosphate kinase 1 (IP6K1) in mammalian cellular processes.J Biol Chem. 2024 Apr;300(4):107116. doi: 10.1016/j.jbc.2024.107116. Epub 2024 Feb 24. J Biol Chem. 2024. PMID: 38403246 Free PMC article. Review.
References
Grants and funding
LinkOut - more resources
Full Text Sources

