

Complement downregulation promotes an inflammatory signature that renders colorectal cancer susceptible to immunotherapy
- PMID: 36137652
- PMCID: PMC9511657
- DOI: 10.1136/jitc-2022-004717
Complement downregulation promotes an inflammatory signature that renders colorectal cancer susceptible to immunotherapy
Abstract
Background and aims: The role of inflammatory immune responses in colorectal cancer (CRC) development and response to therapy is a matter of intense debate. While inflammation is a known driver of CRC, inflammatory immune infiltrates are a positive prognostic factor in CRC and predispose to response to immune checkpoint blockade (ICB) therapy. Unfortunately, over 85% of CRC cases are primarily unresponsive to ICB due to the absence of an immune infiltrate, and even the cases that show an initial immune infiltration can become refractory to ICB. The identification of therapy supportive immune responses in the field has been partially hindered by the sparsity of suitable mouse models to recapitulate the human disease. In this study, we aimed to understand how the dysregulation of the complement anaphylatoxin C3a receptor (C3aR), observed in subsets of patients with CRC, affects the immune responses, the development of CRC, and response to ICB therapy.
Methods: We use a comprehensive approach encompassing analysis of publicly available human CRC datasets, inflammation-driven and newly generated spontaneous mouse models of CRC, and multiplatform high-dimensional analysis of immune responses using microbiota sequencing, RNA sequencing, and mass cytometry.
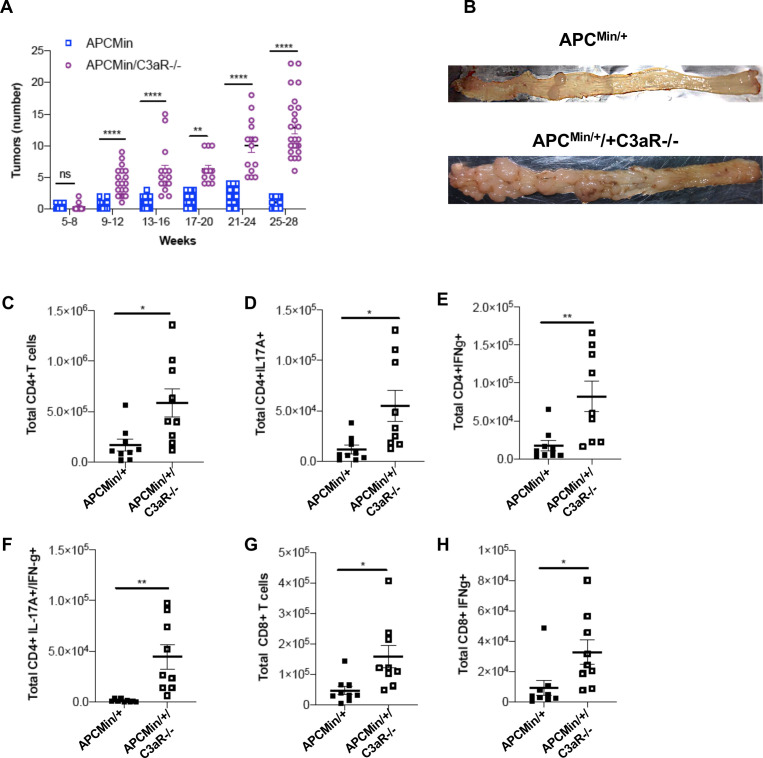
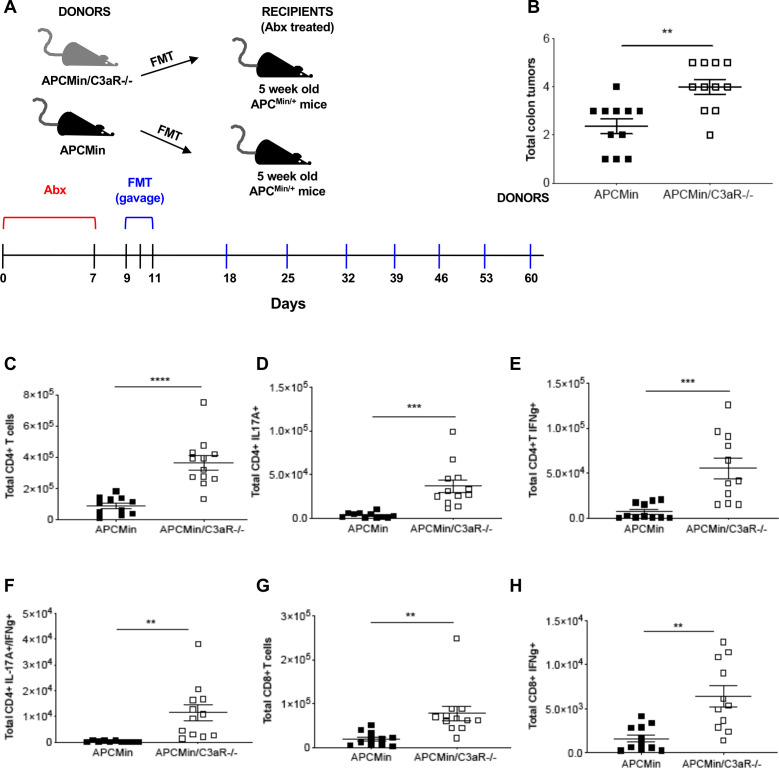
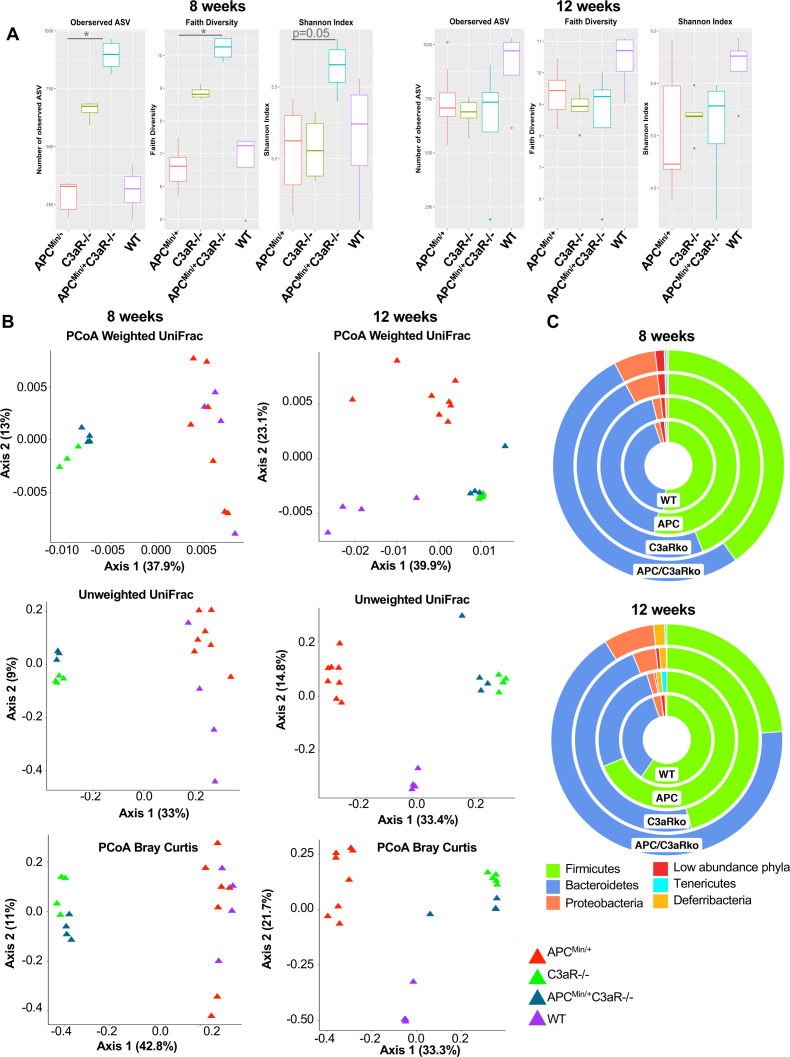
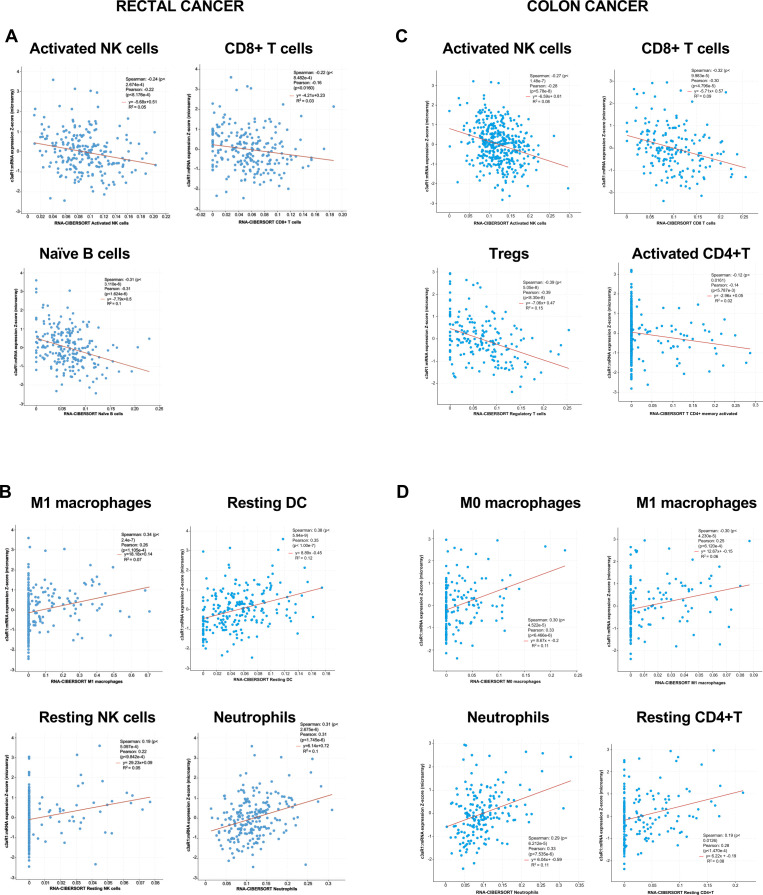
Results: We found that patients' regulation of the complement C3aR is associated with epigenetic modifications. Specifically, downregulation of C3ar1 in human CRC promotes a tumor microenvironment characterized by the accumulation of innate and adaptive immune cells that support antitumor immunity. In addition, in vivo studies in our newly generated mouse model revealed that the lack of C3a in the colon activates a microbiota-mediated proinflammatory program which promotes the development of tumors with an immune signature that renders them responsive to the ICB therapy.
Conclusions: Our findings reveal that C3aR may act as a previously unrecognized checkpoint to enhance antitumor immunity in CRC. C3aR can thus be exploited to overcome ICB resistance in a larger group of patients with CRC.
Keywords: Gastrointestinal Neoplasms; Immunity, Innate; Immunotherapy.
© Author(s) (or their employer(s)) 2022. Re-use permitted under CC BY-NC. No commercial re-use. See rights and permissions. Published by BMJ.
Conflict of interest statement
Competing interests: None declared.
Figures


Similar articles
-
Dendritic cell paucity in mismatch repair-proficient colorectal cancer liver metastases limits immune checkpoint blockade efficacy.Proc Natl Acad Sci U S A. 2021 Nov 9;118(45):e2105323118. doi: 10.1073/pnas.2105323118. Proc Natl Acad Sci U S A. 2021. PMID: 34725151 Free PMC article.
-
Targeting PLCG2 Suppresses Tumor Progression, Orchestrates the Tumor Immune Microenvironment and Potentiates Immune Checkpoint Blockade Therapy for Colorectal Cancer.Int J Biol Sci. 2024 Oct 14;20(14):5548-5575. doi: 10.7150/ijbs.98200. eCollection 2024. Int J Biol Sci. 2024. PMID: 39494327 Free PMC article.
-
Modeling resistance of colorectal peritoneal metastases to immune checkpoint blockade in humanized mice.J Immunother Cancer. 2022 Dec;10(12):e005345. doi: 10.1136/jitc-2022-005345. J Immunother Cancer. 2022. PMID: 36543378 Free PMC article.
-
Advancing immune checkpoint blockade in colorectal cancer therapy with nanotechnology.Front Immunol. 2022 Oct 20;13:1027124. doi: 10.3389/fimmu.2022.1027124. eCollection 2022. Front Immunol. 2022. PMID: 36341334 Free PMC article. Review.
-
The Role of m6A Epigenetic Modification in the Treatment of Colorectal Cancer Immune Checkpoint Inhibitors.Front Immunol. 2022 Jan 6;12:802049. doi: 10.3389/fimmu.2021.802049. eCollection 2021. Front Immunol. 2022. PMID: 35069586 Free PMC article. Review.
Cited by
-
State-of-the-art cytometry in the search of novel biomarkers in digestive cancers.Front Oncol. 2024 May 29;14:1407580. doi: 10.3389/fonc.2024.1407580. eCollection 2024. Front Oncol. 2024. PMID: 38868532 Free PMC article. Review.
-
Effect of colorectal cancer stem cells on the development and metastasis of colorectal cancer.World J Gastrointest Oncol. 2024 Nov 15;16(11):4354-4368. doi: 10.4251/wjgo.v16.i11.4354. World J Gastrointest Oncol. 2024. PMID: 39554751 Free PMC article. Review.
-
Complement: you gutsy thing!Trends Immunol. 2024 Apr;45(4):228-230. doi: 10.1016/j.it.2024.03.003. Epub 2024 Mar 26. Trends Immunol. 2024. PMID: 38538487
-
The role of intestinal flora on tumorigenesis, progression, and the efficacy of PD-1/PD-L1 antibodies in colorectal cancer.Cancer Biol Med. 2023 Dec 23;21(1):65-82. doi: 10.20892/j.issn.2095-3941.2023.0376. Cancer Biol Med. 2023. PMID: 38148328 Free PMC article. Review.
-
Improving radiotherapy in immunosuppressive microenvironments by targeting complement receptor C5aR1.J Clin Invest. 2023 Dec 1;133(23):e168277. doi: 10.1172/JCI168277. J Clin Invest. 2023. PMID: 37824211 Free PMC article.
References
Publication types
MeSH terms
Substances
Grants and funding
LinkOut - more resources
Full Text Sources
Medical
Miscellaneous