Review
. 2021 Jan 18;3(7):1789-1812.
doi: 10.1039/d0na00941e. eCollection 2021 Apr 6.

Folding and self-assembly of short intrinsically disordered peptides and protein regions

Affiliations
Review

Folding and self-assembly of short intrinsically disordered peptides and protein regions

Pablo G Argudo et al. Nanoscale Adv. .

Abstract

Proteins and peptide fragments are highly relevant building blocks in self-assembly for nanostructures with plenty of applications. Intrinsically disordered proteins (IDPs) and protein regions (IDRs) are defined by the absence of a well-defined secondary structure, yet IDPs/IDRs show a significant biological activity. Experimental techniques and computational modelling procedures for the characterization of IDPs/IDRs are discussed. Directed self-assembly of IDPs/IDRs allows reaching a large variety of nanostructures. Hybrid materials based on the derivatives of IDPs/IDRs show a promising performance as alternative biocides and nanodrugs. Cell mimicking, in vivo compartmentalization, and bone regeneration are demonstrated for IDPs/IDRs in biotechnological applications. The exciting possibilities of IDPs/IDRs in nanotechnology with relevant biological applications are shown.


Conflict of interest statement

There are no conflicts to declare.

Figures
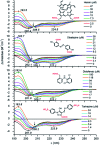
Fig. 1
Fig. 1. UV-Vis IDP LL-37 disorder-to-helix transitions under the addition of various organic compounds. Reprinted with permission from Zsila et al. Copyright 2019 Elsevier B.V.
Fig. 2
Fig. 2. IDP-based self-assembly behaviour. (A) Structure. IDP segment fused to different hydrophobic sequences and hydrophobicity plots of each final amphiphilic protein. (B) Cryo-TEM images of 6.5 μM (top) and 0.4 μM (bottom) IDP-2Yx2A micelles in PBS, pH 5.7. (C) comparison of DLS and cryo-TEM diameters obtained at different concentrations. Reprinted with permission from Klass et al. Copyright 2019 American Chemical Society.
Fig. 3
Fig. 3. R3 peptide (A) TEM (up) and AFM (low) images of self-assembled fibril structures in the presence of heparin. (B) High-resolution AFM images of flat multistranded ribbons in the absence of heparin. (C) Structural illustration of protofilaments. The distance between β-sheets is 1.3 nm with an off-set of ca. 0.4–0.6 nm corresponding to the peptide residues on both sides of the β-sheet. Reprinted with permission from Adamcik et al. Copyright 2016 Wiley-VCH Verlag GmbH & Co.
Fig. 4
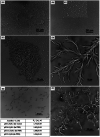
Fig. 4. Optical microscopic images of an amylin fractal observed in PBS buffer at pH 6.5 ± 0.1 (A) at ∼10 μM concentration, (B) at ∼0.1 μM concentration, and (B*) inset showing the presence of different morphologies (C) at ∼1 μM concentration; in PBS buffer at ∼1 μM concentration (D) at pH 11.5 ± 0.1 and (E) at pH 2.5 ± 0.1; and (F) amylin fractal observed in DI water at ∼1 μM concentration at pH 6.5 ± 0.1. The table in the figure contains the df for the morphologies obtained with an optical microscope shown in (c)–(f). Reprinted with permission from Khatun et al. Copyright 2020 The Royal Society of Chemistry.
Fig. 5
Fig. 5. CD spectra of peptides (A) T118-H1.0, (B) pT118-H1.0, (C) T140-H1.0 and (D) pT140-H1.0 in aqueous solution (dotted line) and in 90% TFE (black line) at pH 5.5 and 25 °C. Reprinted with permission from Chaves-Arquero et al. Copyright 2020 Wiley-VCH Verlag GmbH &Co.
Fig. 6
Fig. 6. (A) DEER distance distributions obtained for the peptide, peptoid, and DS-peptoid octamers. (B) Low temperature CW EPR of the trimer series overlaid with the mono-labeled peptide and 3CP free radical. Insets: zoom in of the high-field region. Reprinted with permission from Kaminker et al. Copyright 2018 The Royal Society of Chemistry.
Fig. 7
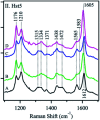
Fig. 7. UVRR spectra of Hst-5 in the absence of added metals (A, black) and after the addition of Zn2+ (B, green), Cu2+ (C, blue), or a mixture of Zn2+ and Cu2+ (D, pink). Reprinted with permission from McCastlin et al. Copyright 2019 Springer Nature.
Fig. 8
Fig. 8. FT-IR analysis of the secondary structure of TdLEA3. (A) Amide I region in the hydrated (D2O, blue) and in the dry (black) state. (B) Amide I region at different relative humidities (RH). Reprinted with permission from Koubaa et al. Copyright 2019 Springer Nature.
Fig. 9
Fig. 9. SAXS analysis of Hst5 in the absence and presence of ZnCl2. (A) Comparison of the intensity function normalised by concentration for 0.9 mg mL−1 Hst5, in 20 mM MES-buffer, pH 6.7, 150 mM NaCl and 4 mM ZnCl2. (B) SAXS data shown as a dimensionless Kratky plot. (C) Plot of the intra-peptide distance distribution determined by indirect Fourier transform, for Hst5, with either NaCl (purple curves) or ZnCl2 (red curves). (D and E) Concentration dependent SAXS-measurements of Hst5 in the presence of ZnCl2, showing the intensity curve normalised with protein concentration and the corresponding Kratky plot. Reprinted with permission from Cragnell et al. Copyright 2019 MDPI.
Fig. 10
Fig. 10. p53 61-residue N-terminal TAD (A) calculated (lines) and experimental (gray bars) paramagnetic relaxation enhancement effects induced by paramagnetic spin labeling at residues 28 (top row) and 39 (bottom row) and (B) residues 7 (top row) and 61 (bottom row). (C) Secondary chemical shift analysis for Cα atoms and (D) C′ atoms. Calculations were performed using independent control (red) and folding (green) simulations. Reprinted with permission from Lui et al. Copyright 2019 American Chemical Society.
Fig. 11
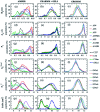
Fig. 11. Aβ16–22 Dimer normalized distributions of the radius of gyration (Rg), the end-to-end distance (dee), the order parameter (P2), the intermolecular backbone H-bonds (NhbondC), the intermolecular side chain−side chain contacts (NscC), and the solvent accessible surface area (SASA). Reprinted with permission from Man et al. Copyright 2019 American Chemical Society.
Fig. 12
Fig. 12. Normalized force field scores (lower the better) for short peptides, folded proteins, and disordered proteins. OPLS and OPLSIDPSFF represent the original OPLS-AA/L and the new force field, respectively. DISP means the disp-TIP4PD solvent model. Reprinted with permission from Yang et al. Copyright 2019 American Chemical Society.
Fig. 13
Fig. 13. In vivo stability and tissue incorporation of POPs: (a) 125I radiolabelled E1-H5-25% POP subcutaneous injections were significantly more stable than their E1 counterparts, with just 5% of the injected dose (ID) degraded at 120 h; 200 μl 250 μM injections; p < 0.05 for all data points after 0 h, determined by two-tailed t-tests (n = 6 mice); data represent mean ± s.e.m. (b) Whereas ELPs diffuse into the subcutaneous space, POP deposits were externally apparent, retaining the shape and volume of the initial injection up to dissection and ex vivo analysis. (c) Representative CT-SPECT images of the deposits confirm the increased diffusivity of ELPs and the increased stability of POPs. (d) POPs were injected into BL/6 mice and explanted for analysis over 21 days. Representative images are shown with arrows pointing at externally evident vascularization. Scale bars: 5 mm. (e) POPs rapidly integrated into the subcutaneous environment with sufficient strength to endure moderate extension less than 24 h after injection. (f) There is a high initial cell incorporation with some change over the observed time periods; for *, p < 0.05 determined by ANOVA with Tukey post-hoc (day 1 n = 3, days 3–21 n = 4); data presented as 10–90% box plots. (g) Flow cytometry for cells involved in innate immunity reveals subsequent spikes in neutrophils, inflammatory monocytes, and macrophages, with a loss in all haematopoietic cells (CD45+) by day 21; for *, p < 0.05 determined by ANOVA with Tukey post-hoc (day 1 n = 3, days 3–21 n = 4); data represent mean ± s.e.m. (h) Population of haematopoietic-derived cells (CD45+) in time. (i) The loss in inflammation corresponds to an increase in vascularization, quantified by the number of visible capillaries in histological sections; for *, p < 0.05 as determined by ANOVA with Tukey post-hoc (n = 3); data represent mean ± s.e.m. (j) An example tissue slice 10 days post injection shows an area of particularly high vascularization density (scale bar: 100 μm). Reprinted with permission from Roberts et al. Copyright 2018 Springer Nature.

Similar articles

Cited by

References

    1. Okesola B. O. Mata A. Chem. Soc. Rev. 2018;47:3721–3736. doi: 10.1039/C8CS00121A. - DOI - PubMed
    1. Méndez-Ardoy A. Granja J. R. Montenegro J. Nanoscale Horiz. 2018;3:391–396. doi: 10.1039/C8NH00009C. - DOI - PubMed
    1. Gong Z. Liu X. Dong J. Zhang W. Jiang Y. Zhang J. Feng W. Chen K. Bai J. Nanoscale. 2019;11:15479–15486. doi: 10.1039/C9NR02874A. - DOI - PubMed
    1. Li S. Zou Q. Li Y. Yuan C. Xing R. Yan X. J. Am. Chem. Soc. 2018;140:10794–10802. doi: 10.1021/jacs.8b04912. - DOI - PubMed
    1. Li S. Xing R. Chang R. Zou Q. Yan X. Curr. Opin. Colloid Interface Sci. 2018;35:17–25. doi: 10.1016/j.cocis.2017.12.004. - DOI