. 2022:2:838458.
doi: 10.3389/fddev.2022.838458. Epub 2022 May 9.

Localized PD-1 Blockade in a Mouse Model of Renal Cell Carcinoma

Affiliations

Localized PD-1 Blockade in a Mouse Model of Renal Cell Carcinoma

Ngoc B Pham et al. Front Drug Deliv. 2022.

Abstract

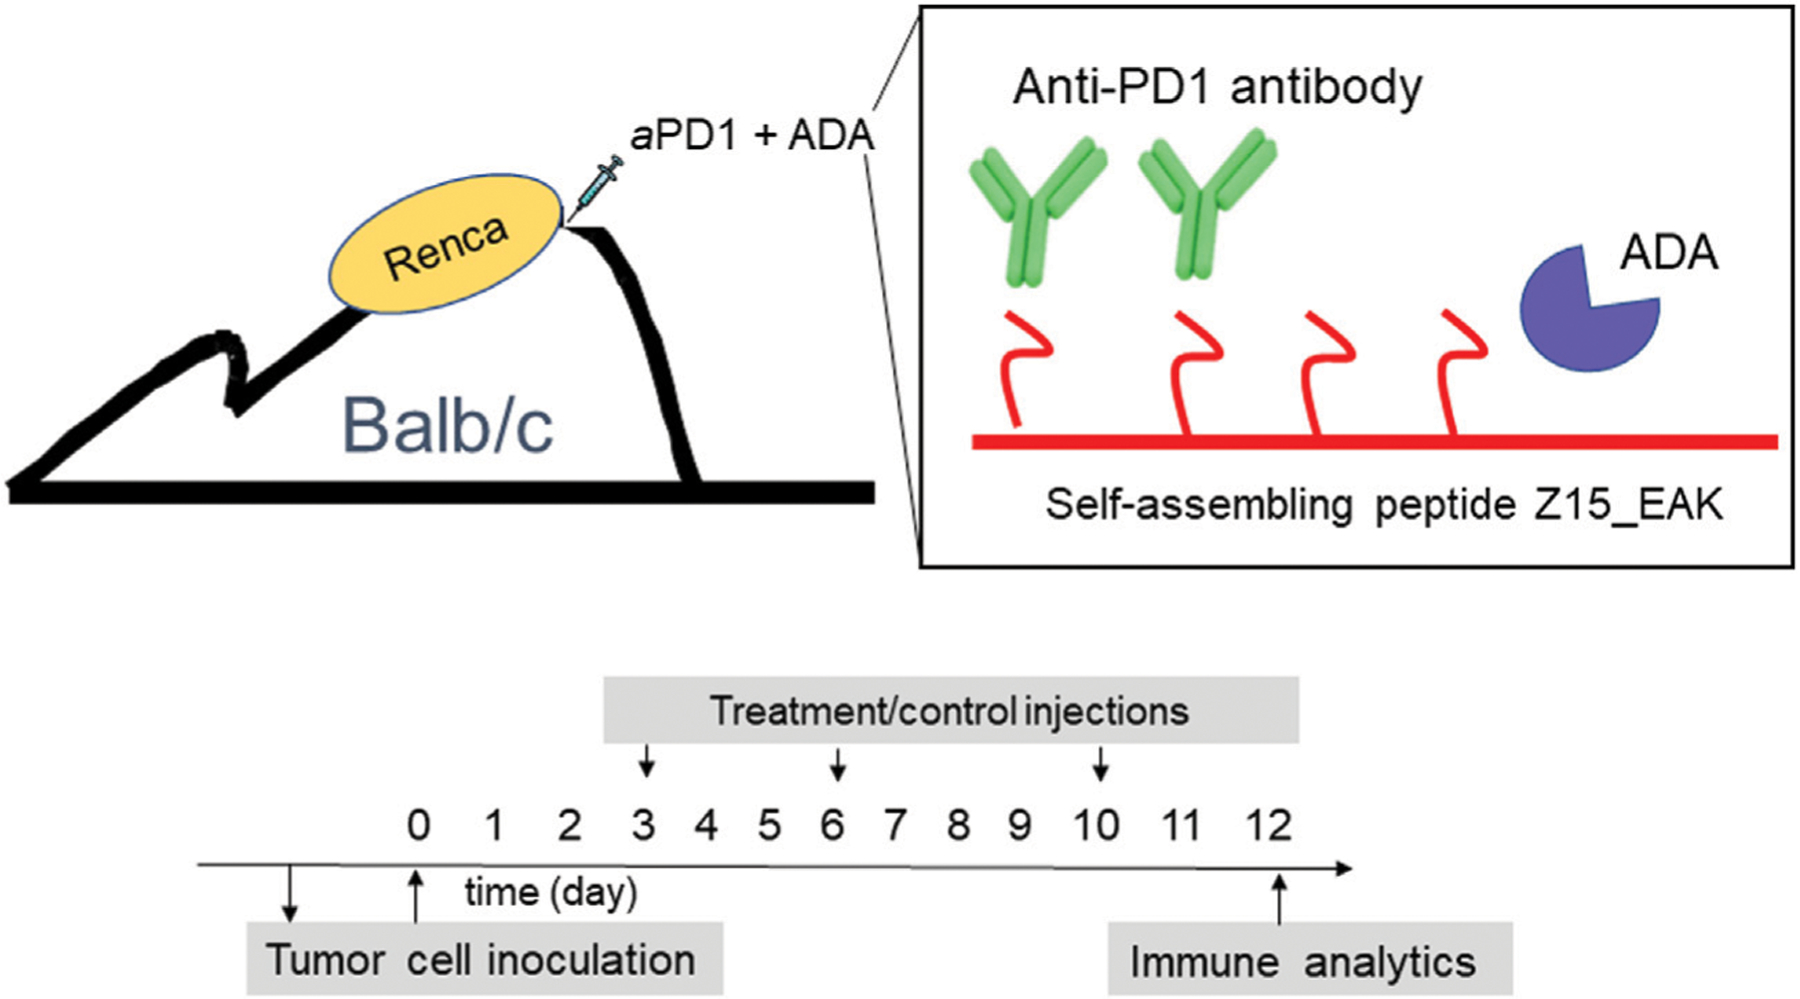
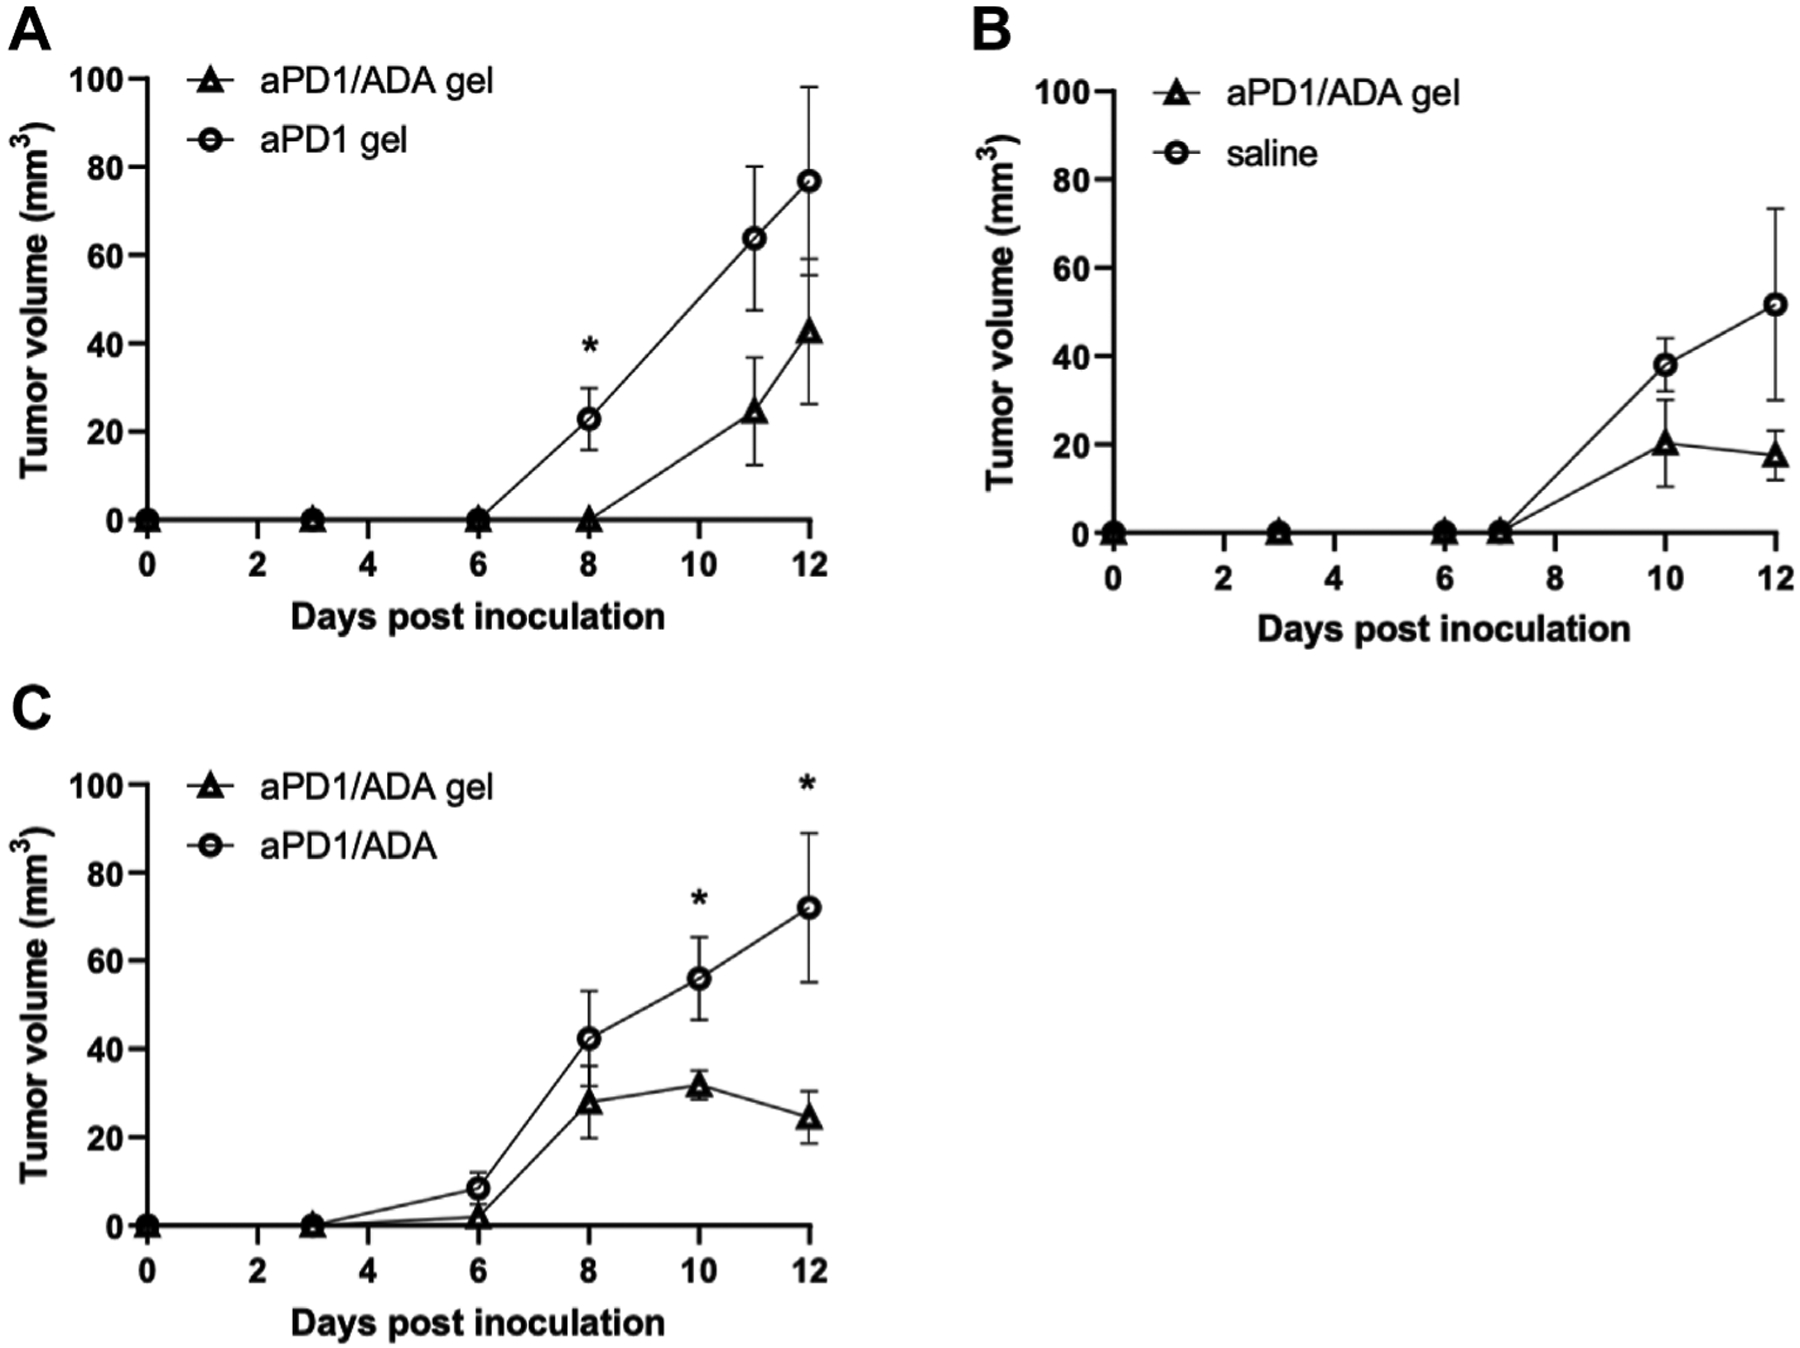
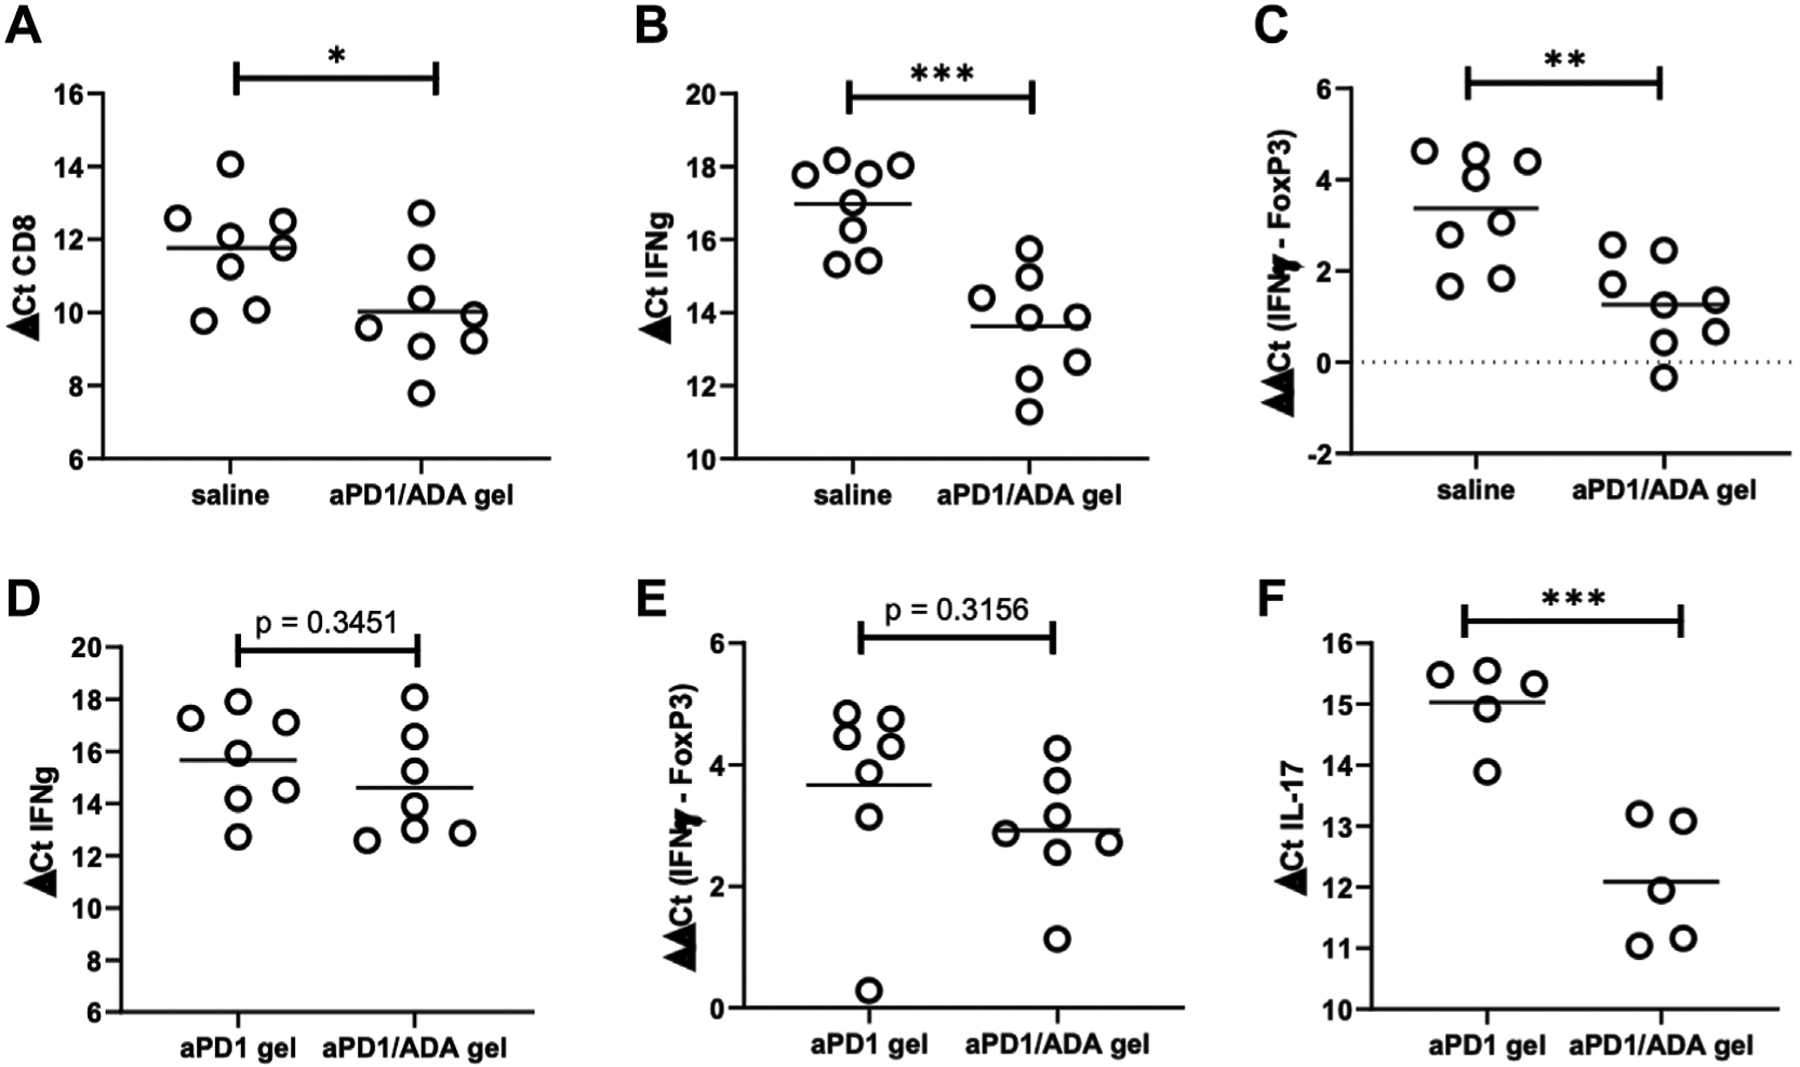
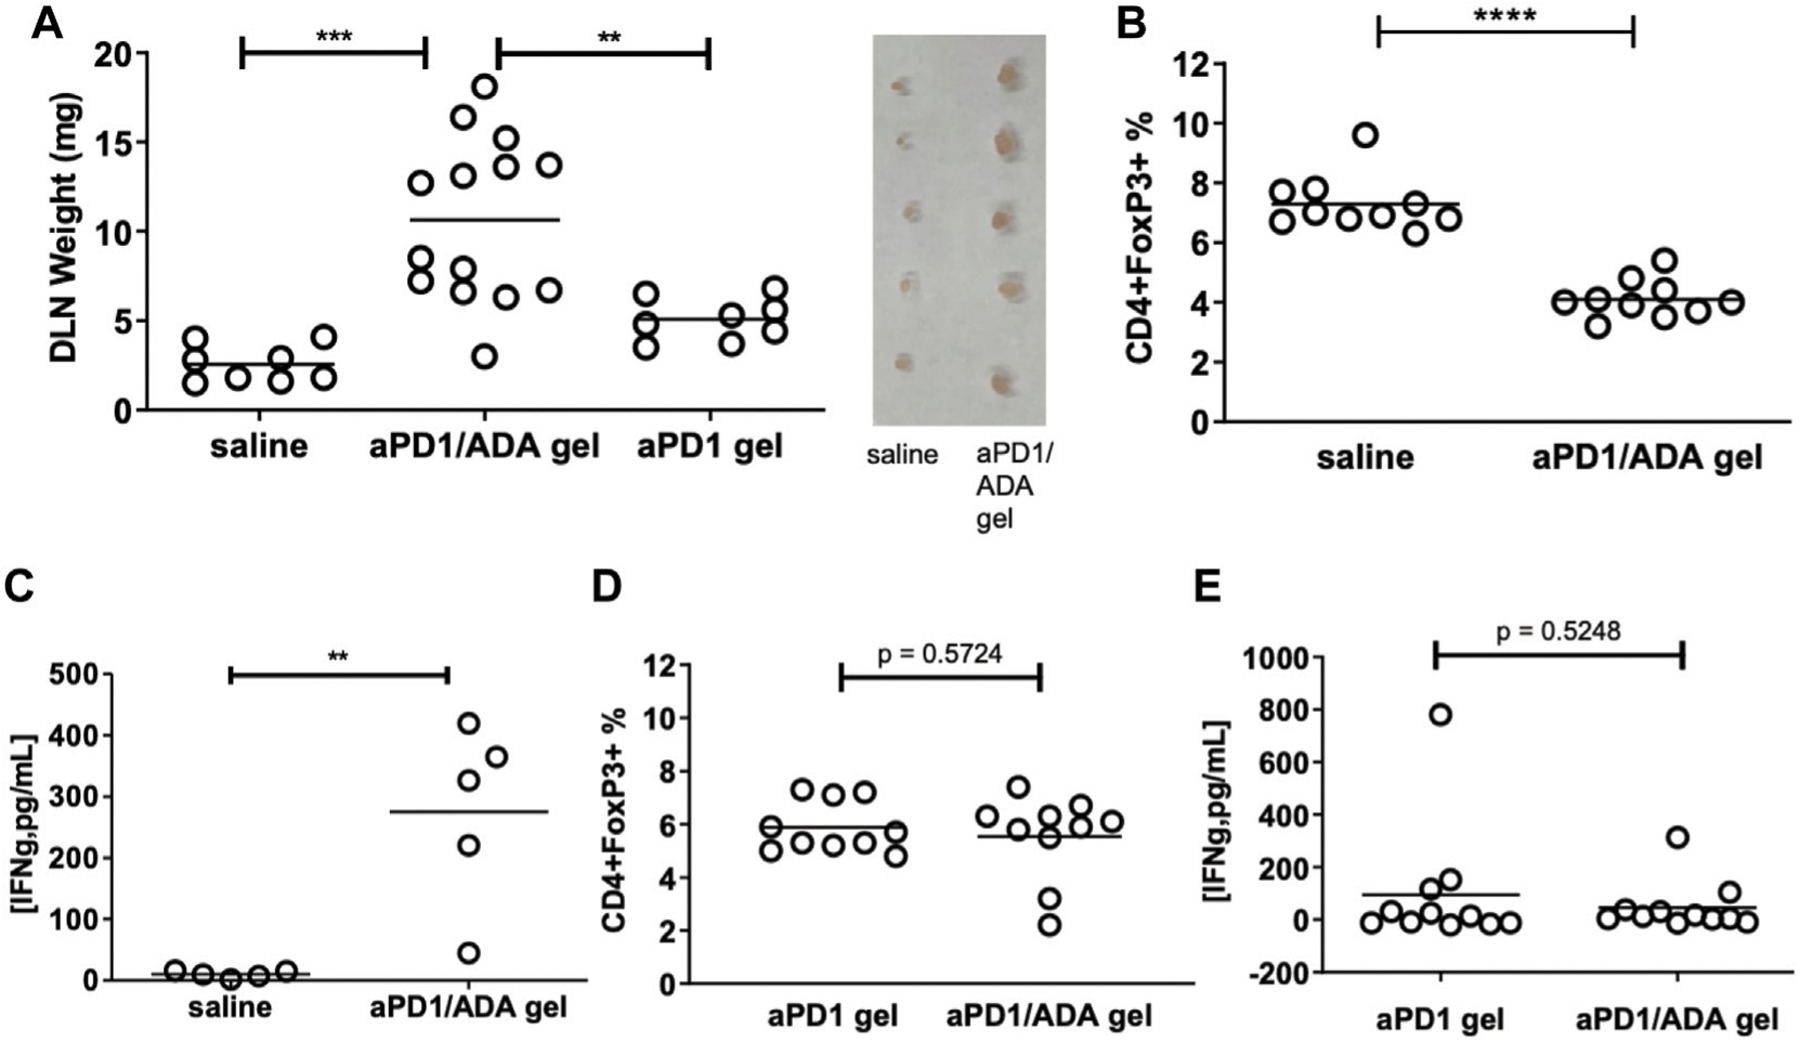
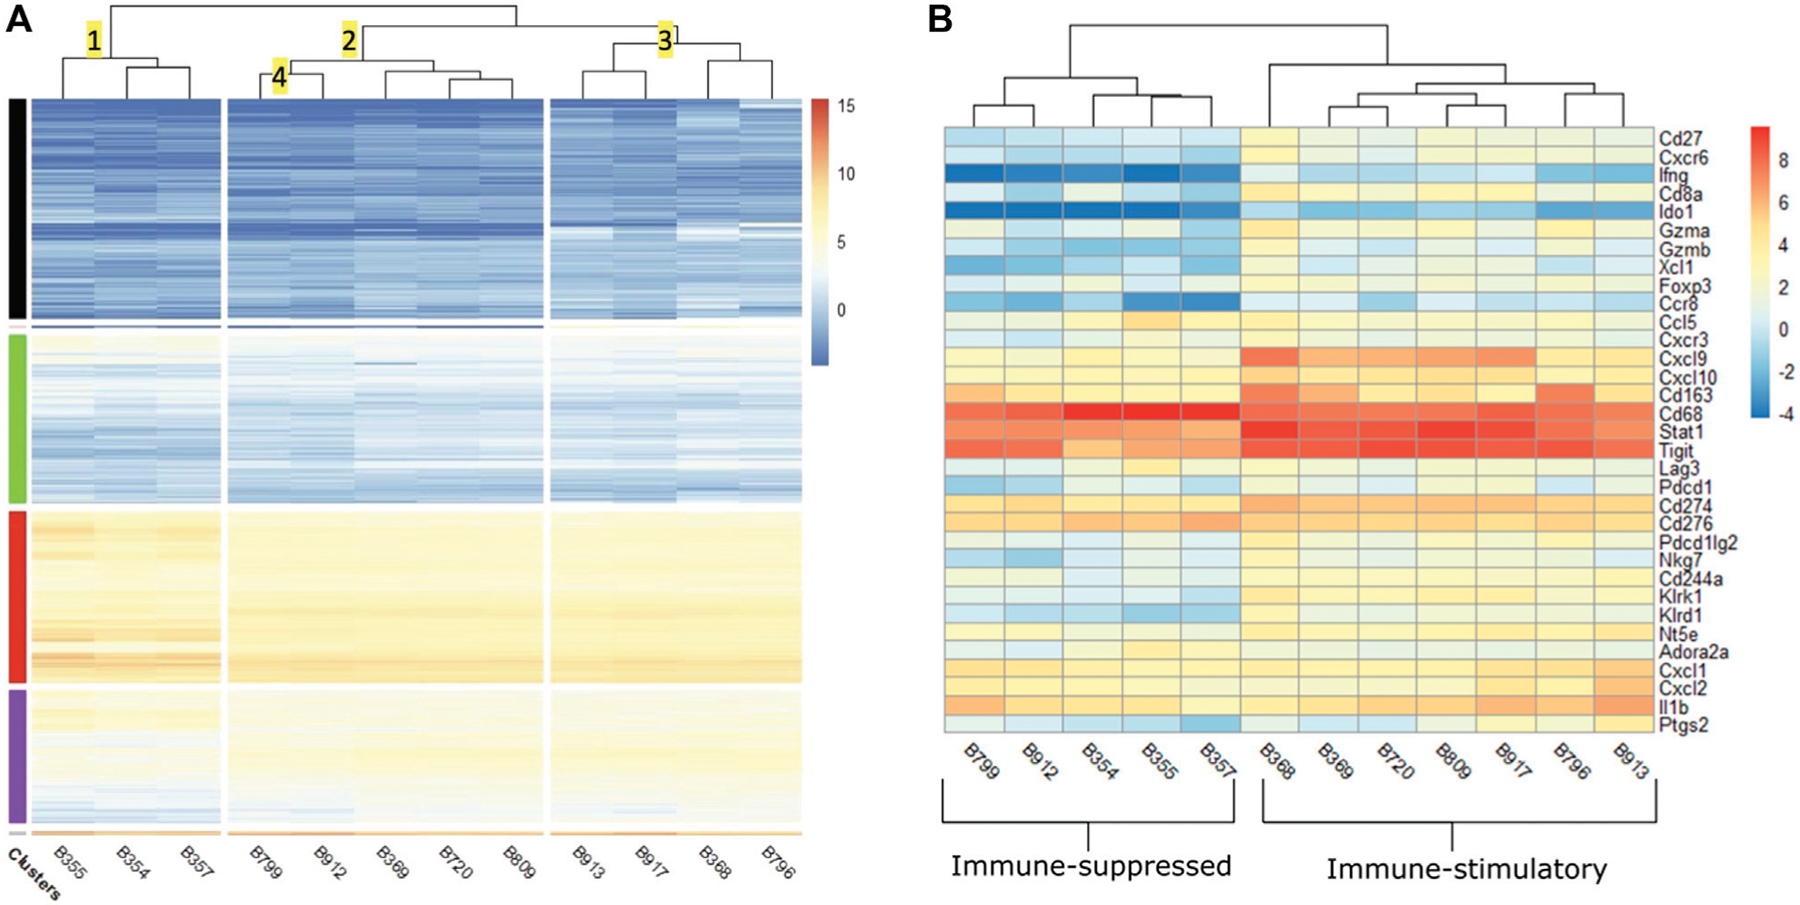
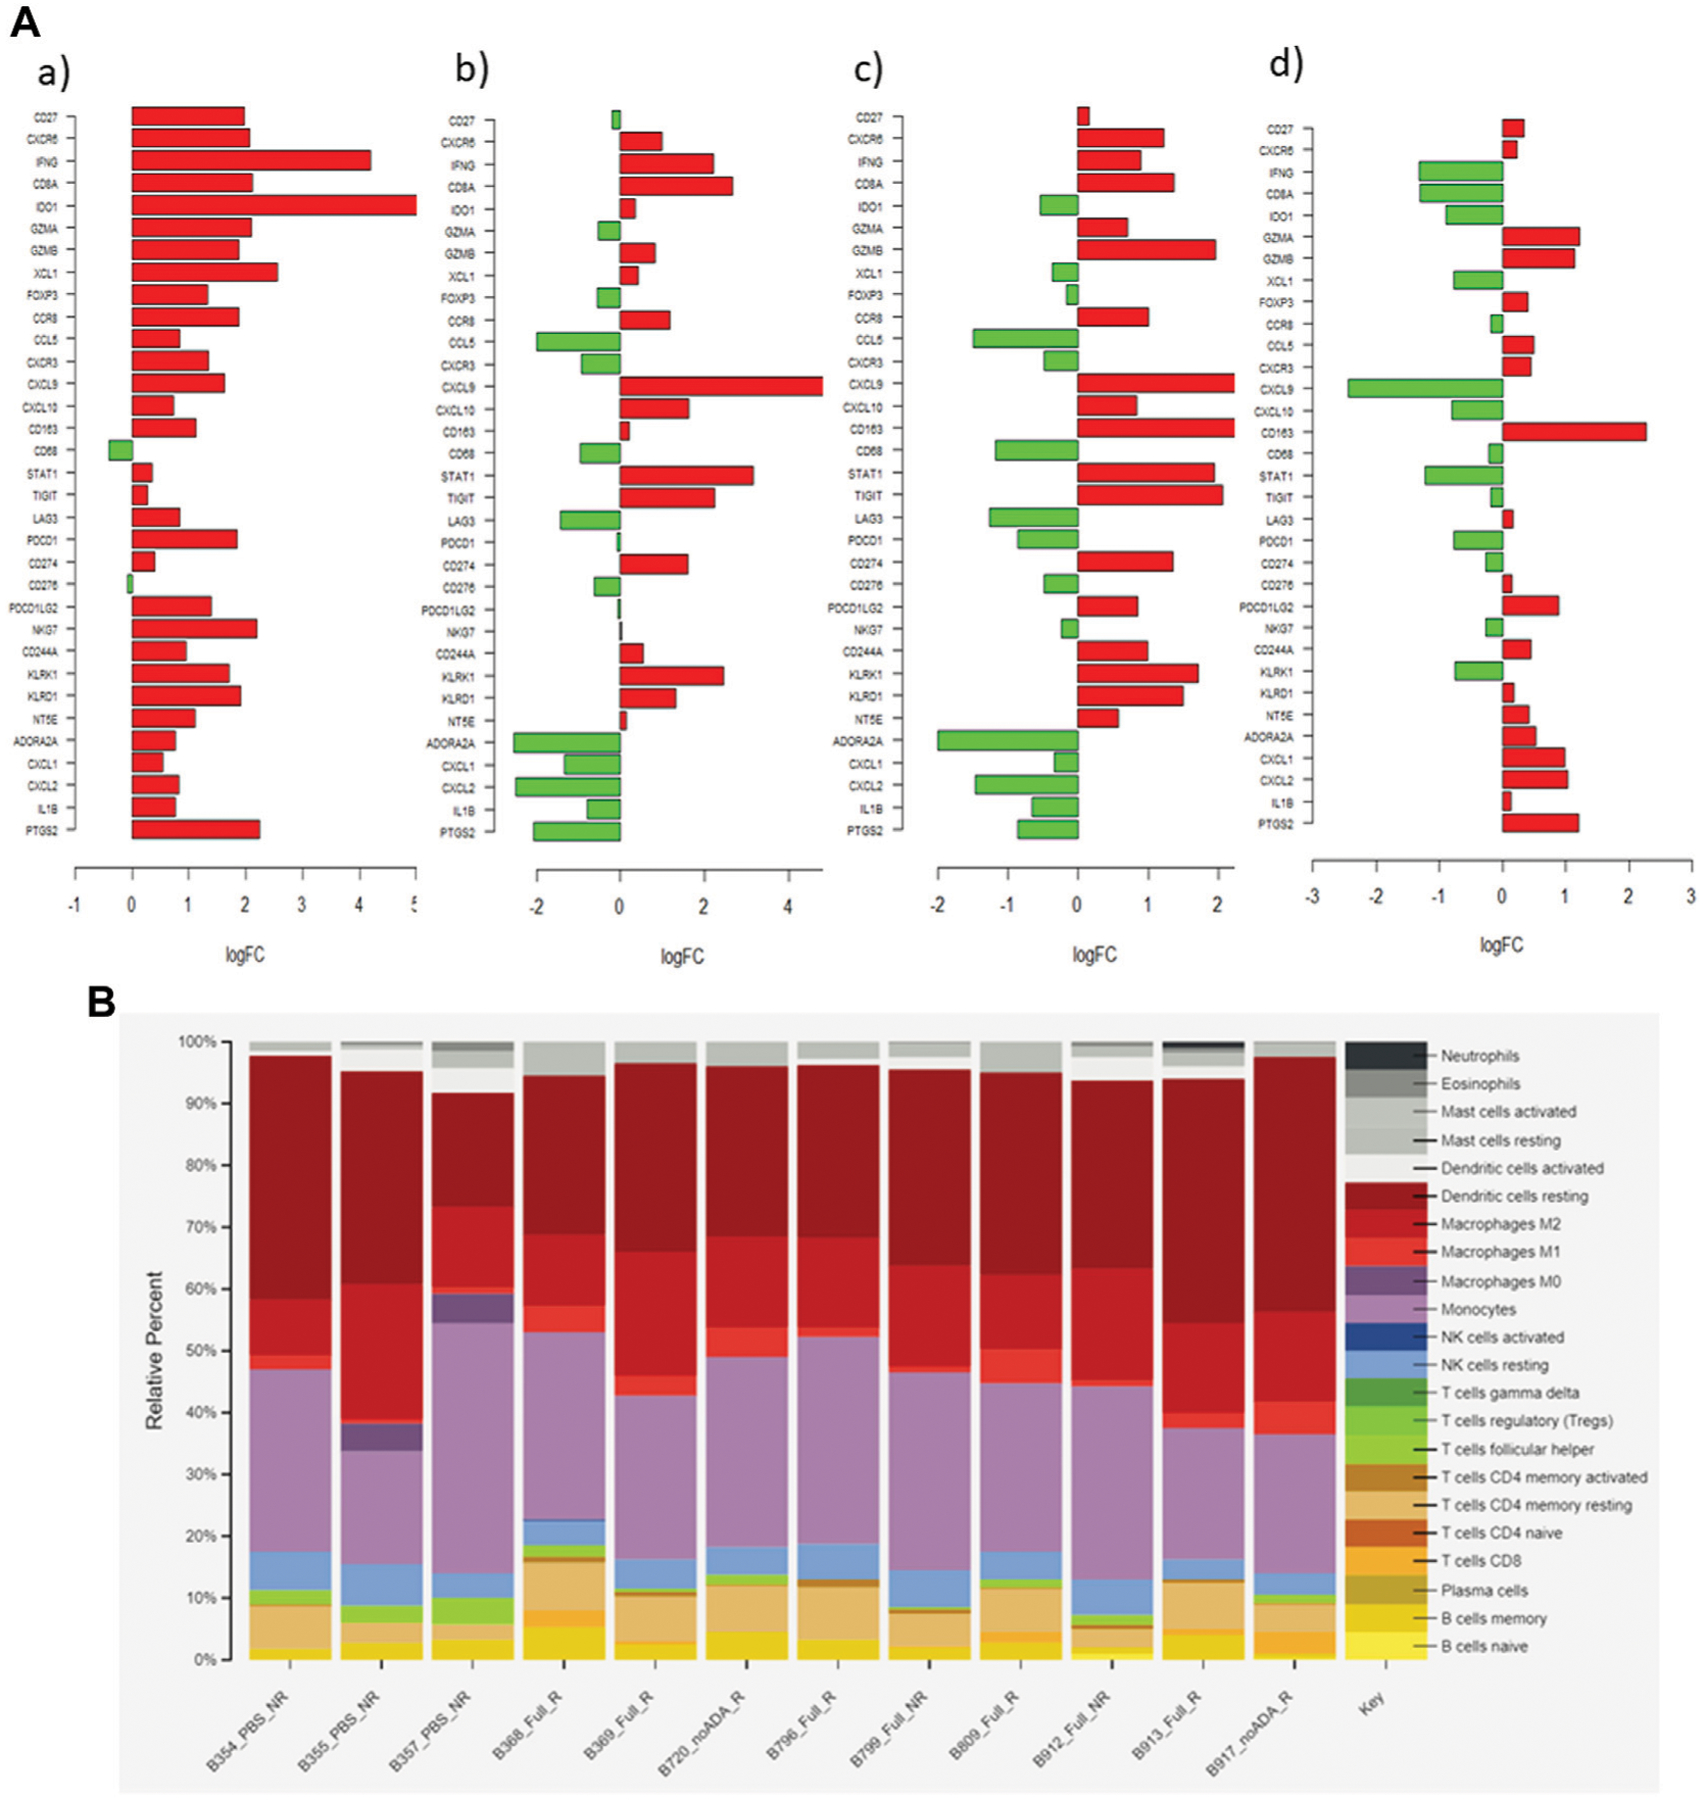
Herein we report the impact of localized delivery of an anti-mouse PD-1-specific monoclonal antibody (aPD1) on Renca tumors in the resulting T cell responses and changes in broader immune gene expression profiles. Renca is a BALB/c mice syngeneic tumor that has been used to model human renal cell carcinoma In this study, T cell subsets were examined in tumors and draining lymph nodes of mice treated with localized PD-1 with and without the addition of adenosine deaminase (ADA), an enzyme that catabolizes adenosine (ADO), identified as an immune checkpoint in several types of human cancers. The biologics, aPD1, or aPD1 with adenosine deaminase (aPD1/ADA), were formulated with the self-assembling peptides Z15_EAK to enhance retention near the tumor inoculation site. We found that both aPD1 and aPD1/ADA skewed the local immune milieu towards an immune stimulatory phenotype by reducing Tregs, increasing CD8 T cell infiltration, and upregulating IFNɣ. Analysis of tumor specimens using bulk RNA-Seq confirmed the impact of the localized aPD1 treatment and revealed differential gene expressions elicited by the loco-regional treatment. The effects of ADA and Z15_EAK were limited to tumor growth delay and lymph node enlargement. These results support the notion of expanding the use of locoregional PD-1 blockade in solid tumors.

Keywords: EAK16-II; RENCA; hydrogel; immune checkpoint blockade; peritumoral delivery; self-assembling peptides.


Conflict of interest statement

Conflict of Interest: The authors declare that the research was conducted in the absence of any commercial or financial relationships that could be construed as a potential conflict of interest.

Figures

FIGURE 1 |
FIGURE 1 |
Schematic representations of aPD1/ADA formulated in Z15_EAK gel and dosing strategy. In vitro cultivated Renca cells (2 × 10^6) was first injected into the subcutaneous space on the dorsum in a BALB/c mouse to establish an in vivo tumor passage. The established tumor was collected after 2 weeks and processed into a single cell suspension using a GentleMACS Tumor Dissociation reagent kit and a GentleMACS Dissociator. In vivo-passaged cells were then subcutaneously inoculated into the dorsum of another set of BALB/c mice. Treatments were administered subcutaneously in the tumoral region starting on day 3 post-inoculation. A total of three injections were given two and 3 days apart. Mice were sacrified 2 days after the last dose for ex vivo analyses.
FIGURE 2 |
FIGURE 2 |
Tumor growth profiles in independent cohorts of mice. Experiments comparing (A) aPD1/ADA gel vs. aPD1 gel (B7; n = 5), (B) aPD1/ADA gel vs. saline (B3; n = 5), and (C) aPD1/ADA gel vs. aPD1/ADA in saline (B8; n = 5). Tumor volumes were calculated using the equation 0.52*(largest dimension*smallest dimension2) (Yu et al., 2018). In analysis of early time points, prior to the dimensions could be accurately measured using caliper, very small palpable tumors were assigned 0.5 mm*0.5 mm while small palpable ones 1 mm*1 mm. The unpaired t-test was used to determine the significance of difference in volumes at each time point (α = 0.05).
FIGURE 3 |
FIGURE 3 |
Expressions of CD8, IFNg, and FoxP3 in tumors recovered from two cohorts (B3 and B9) comparing aPD1/ADA gel and saline injections (a third cohort had poor RNA quality (RIN <7) and therefore excluded). RT-qPCR analyses were performed for (A) CD8a, (B) IFNɣ, and (C) IFNɣ relative to FoxP3 (ddCt IFNɣ-FoxP3); lower dCt indicates higher expression; Expressions of the same genes from two other cohorts (B5 and B7) comparing aPD1/ADA gel and aPD1 gel-treated tumors resulted in insignificant differences in (D) IFNɣ and (E) IFNɣ relative to FoxP3, but significant difference in (F) IL-17. RNA were extracted from tumors processed into single cell suspensions using Miltenyi dissociation kits in a GentleMACS. Expressions of the genes were probed with TaqMan primers and normalized to actin. Purities of the RNA were determined using Agilent Nano RNA chip. Significance was determined using unpaired two-tailed t-test with *p < 0.05, **p < 0.01, ***p < 0.001, ****p < 0.0001.
FIGURE 4 |
FIGURE 4 |
Impact of multiplexed aPD1 and ADA on T cells in tumors and dLN. aPD1/ADA gels were injected into the peri-tumoral region around Renca tumors established subcutaneously in BALB/c mice; (A) draining lymph nodes (dLN) isolated 12 days after tumor inoculation and weighted on the same day; insert shows lymph nodes (side-by-side) isolated from mice treated with aPD1/ADA gel or saline; (B) Flow cytometric analyses of CD4+FoxP3+ Tregs in dLN collected from mice treated with three doses of saline or aPD1/ADA gel (unpaired two-tailed t-test p < 0.0001); (C) Production of IFNɣ from cultured cells derived from dLN in mice treated with aPD1/ADA gel or saline (p < 0.01). (D) CD4+FoxP3+ frequencies in dLN recovered from mice treated with aPD1 gel or aPD1/ADA gel. (E) IFNɣ released in dLN-derived cells cultured from specimens isolated from mice treated with aPD1 gel or aPD1/ADA gel *p < 0.05, **p < 0.01, ***p < 0.001, ****p < 0.0001.
FIGURE 5 |
FIGURE 5 |
(A) Heatmap of log2 counts per million (logCPM) of the top 10,000 differentially expressed genes across 12 tumors. Samples (x-axis) are hierarchically clustered based on similarity of gene expression. The color scale indicates the intensity of intrinsic expression (logCPM). IST: immune-stimulatory, ISU: immune-suppressed, PBS: phosphate buffer saline. Tumors injected with saline classified as ISU are B355, B354, B357. Tumors received aPD1 gel classified as IST are B720, B917. aPD1/ADA gel treated tumors classified as IST are B369, B809, B913, B368, B796 and those classified as ISU are B799, B912. (B) Heatmap of logCPM of a subset of 33 immune and adenosine pathway signature genes. The color scale indicates the intensity of intrinsic expression (logCPM).
FIGURE 6 |
FIGURE 6 |
(A) Bar graph showing log2 fold-change (logFC) of 33 relevant genes in each pairwise comparison (a) ISU vs. IST (b) saline vs. aPD1/ADA gel (c) saline vs. aPD1 gel (d) aPD1 gel vs. aPD1/ADA gel. Positive logFC value (red) indicates an upregulation of gene in the latter group, while downregulation denotes the opposite. (B) CIBERSORTx and signature matrix LM22 delineation of immune cell subsets emerged from the samples’ responsiveness to the treatments.

Similar articles

Cited by

References

    1. Bai S, Wu Y, Yan Y, Kang H, Zhang J, Ma W, et al. (2020). The Effect of CCL5 on the Immune Cells Infiltration and the Prognosis of Patients with Kidney Renal Clear Cell Carcinoma. Int. J. Med. Sci 17 (18), 2917–2925. doi:10.7150/ijms.51126 - DOI - PMC - PubMed
    1. Blay J, White TD, and Hoskin DW (1997). The Extracellular Fluid of Solid Carcinomas Contains Immunosuppressive Concentrations of Adenosine. Cancer Res. 57 (13), 2602–2605. - PubMed
    1. Böttcher JP, Bonavita E, Chakravarty P, Blees H, Cabeza-Cabrerizo M, Sammicheli S, et al. (2018). NK Cells Stimulate Recruitment of cDC1 into the Tumor Microenvironment Promoting Cancer Immune Control. Cell 172 (5), 1022–1037. e1014. doi:10.1016/j.cell.2018.01.004 - DOI - PMC - PubMed
    1. Chao Y, Liang C, Tao H, Du Y, Wu D, Dong Z, et al. (2020). Localized Cocktail Chemoimmunotherapy after In Situ Gelation to Trigger Robust Systemic Antitumor Immune Responses. Sci. Adv 6 (10), eaaz4204. doi:10.1126/sciadv.aaz4204 - DOI - PMC - PubMed
    1. Chauvin J-M, Pagliano O, Fourcade J, Sun Z, Wang H, Sander C, et al. (2015). TIGIT and PD-1 Impair Tumor Antigen-Specific CD8+ T Cells in Melanoma Patients. J. Clin. Invest 125 (5), 2046–2058. doi:10.1172/JCI80445 - DOI - PMC - PubMed

LinkOut - more resources