. 2023 Aug;39(4):1413-1431.
doi: 10.1007/s10565-022-09767-5. Epub 2022 Sep 22.

CCL24/CCR3 axis plays a central role in angiotensin II-induced heart failure by stimulating M2 macrophage polarization and fibroblast activation

Affiliations

CCL24/CCR3 axis plays a central role in angiotensin II-induced heart failure by stimulating M2 macrophage polarization and fibroblast activation

Zhen Wang et al. Cell Biol Toxicol. 2023 Aug.

Abstract

Aims: We aimed to investigate the effect and mechanism of pleiotropic chemokine CCL24 in heart failure.

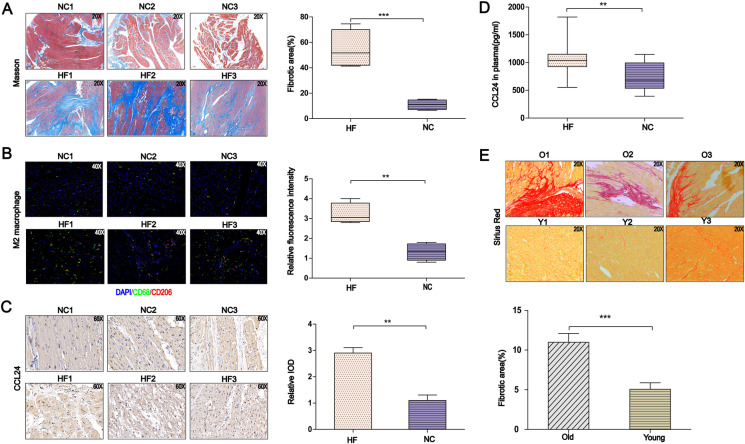
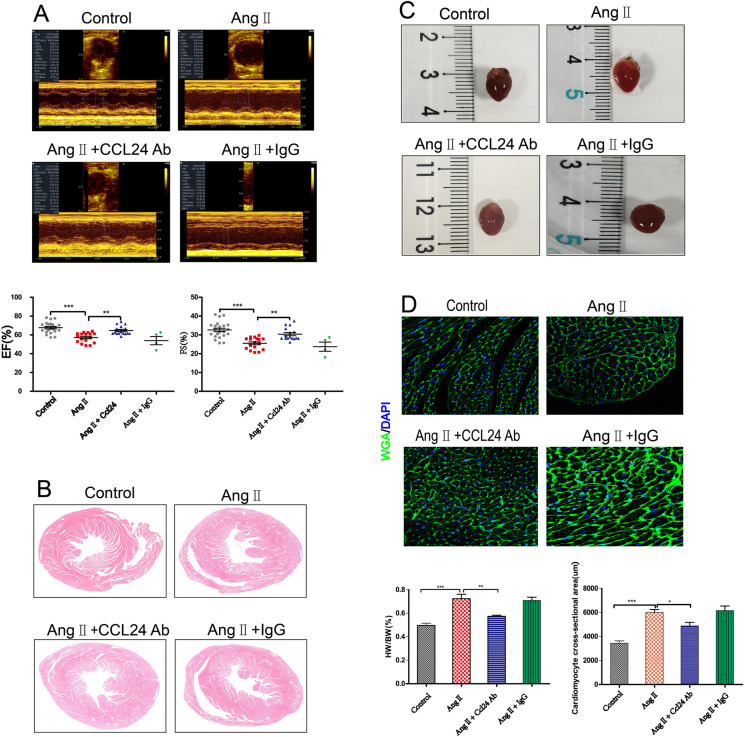
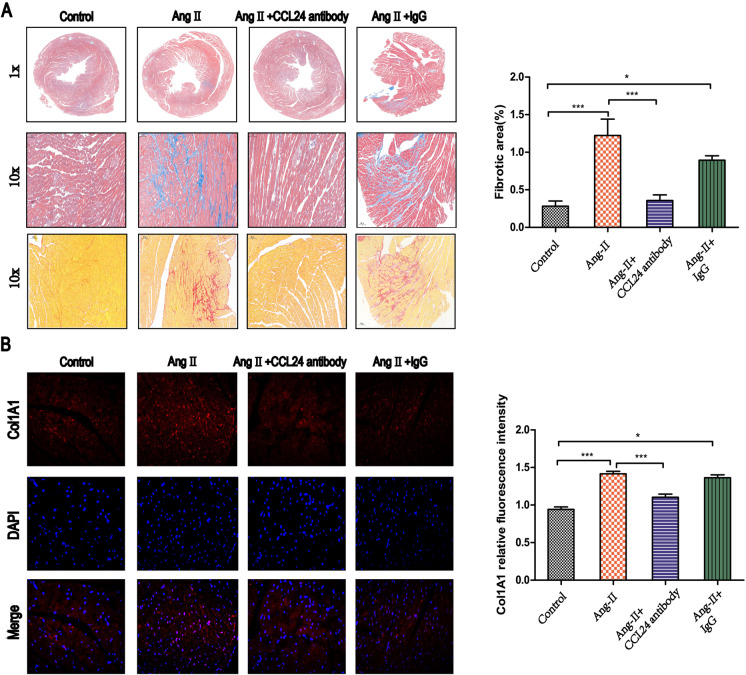
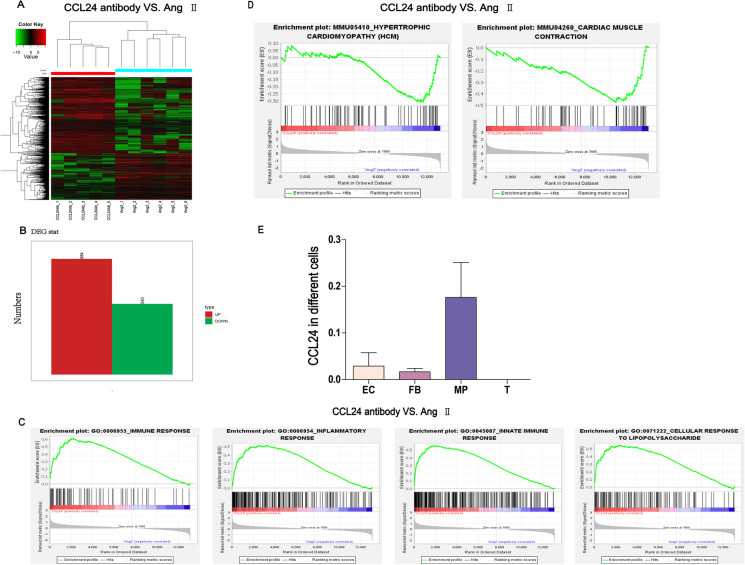
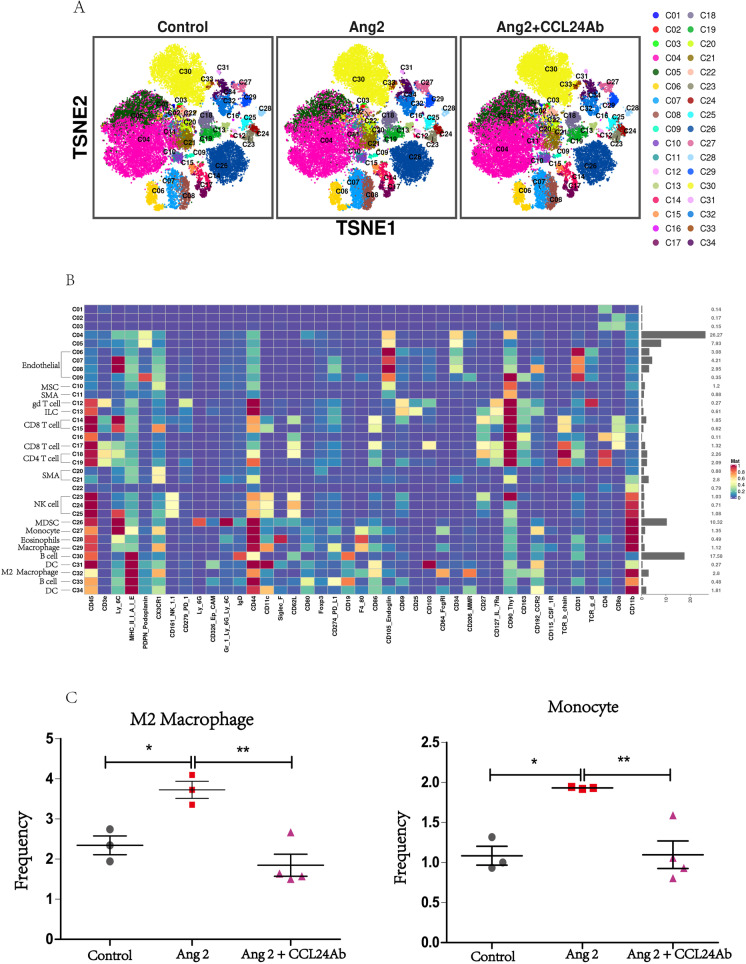
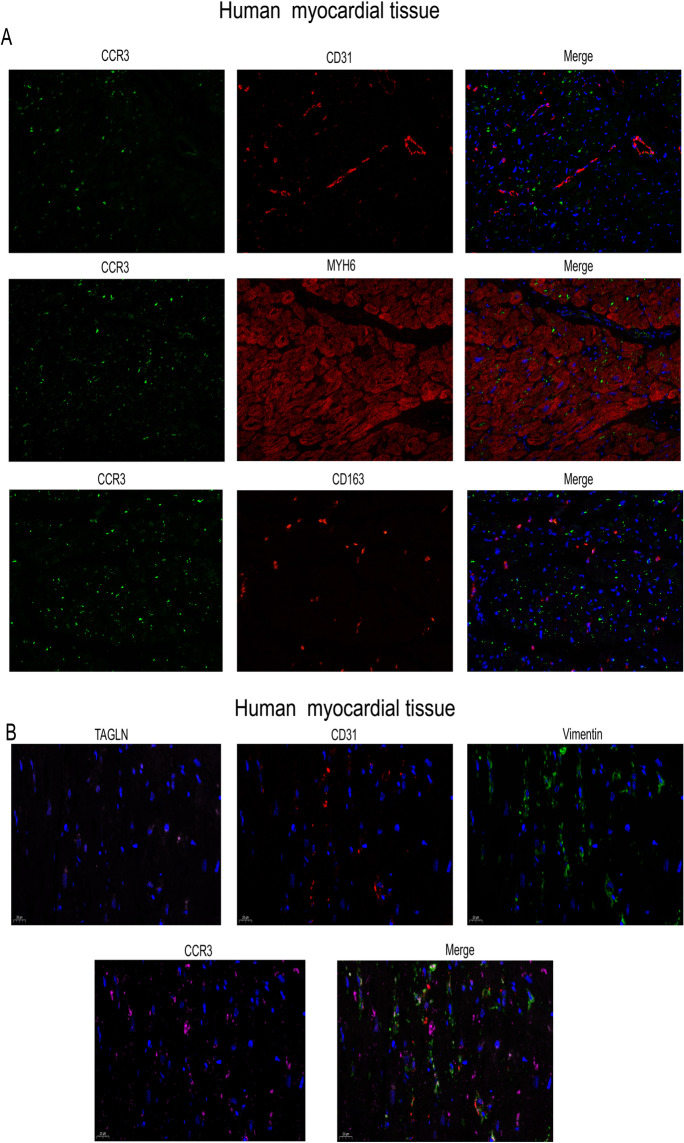
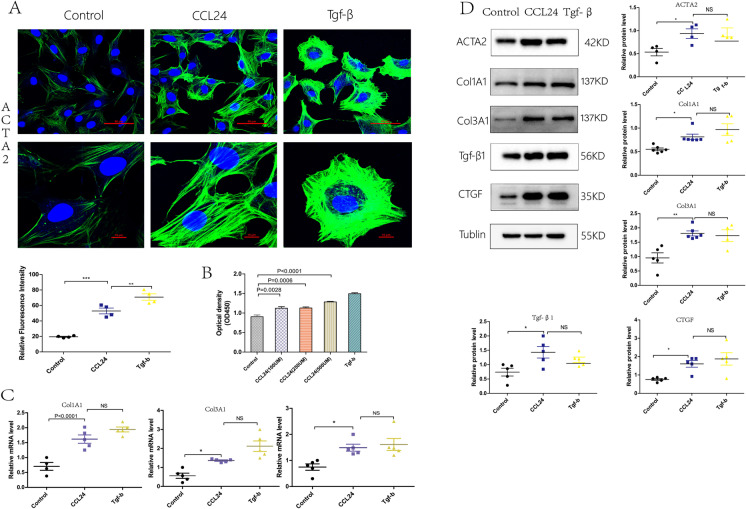
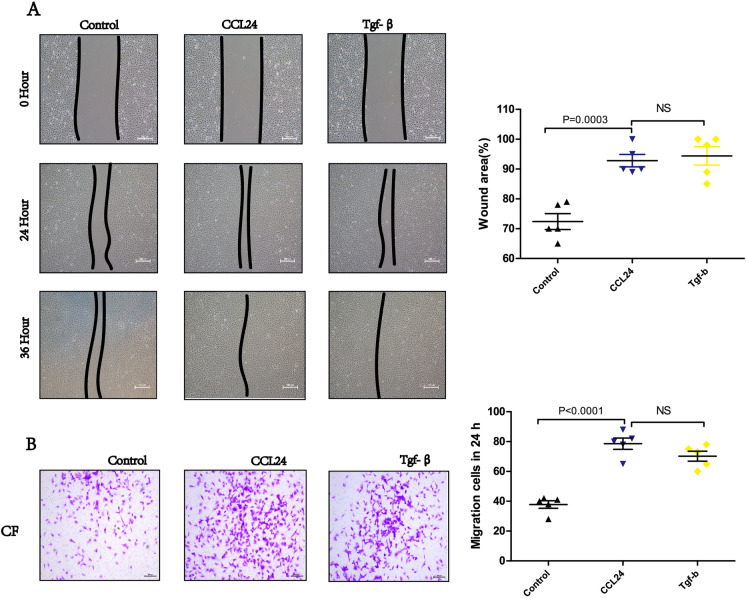
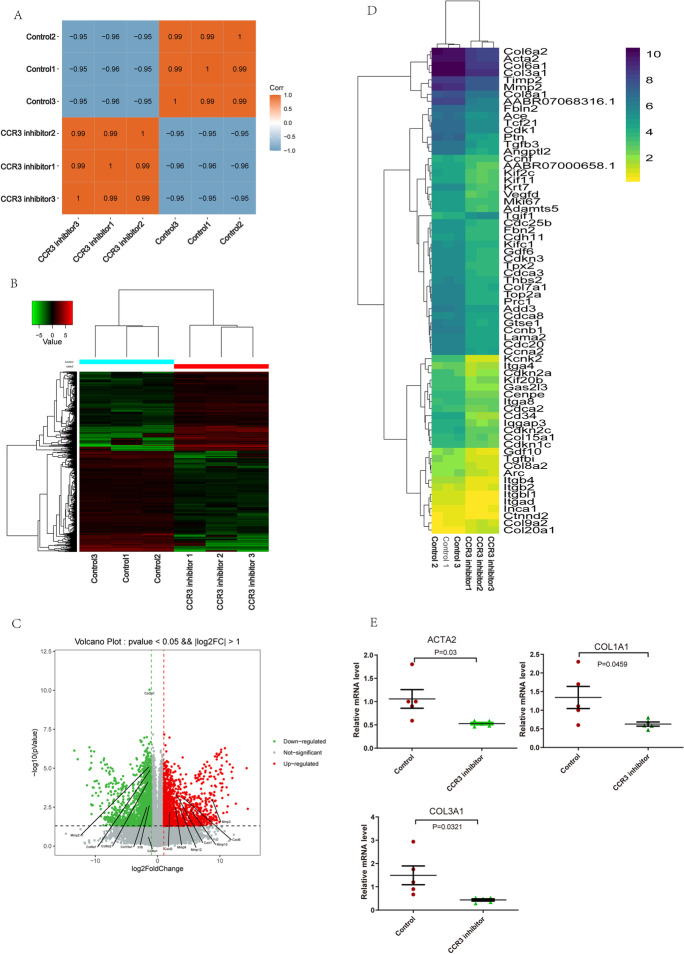
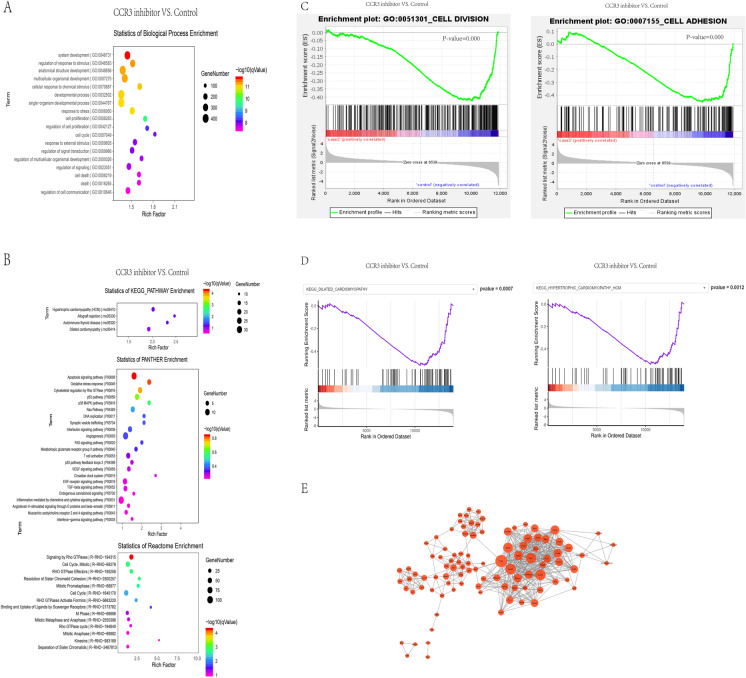
Methods and results: Compared with normal donators, the expression of CCL24 and number of cardiac M2 macrophages in heart were higher in heart failure patients, the same as plasma CCL24. Treatment with CCL24 antibody hindered Ang II (1500 ng/kg/min)-induced cardiac adverse remodeling through preventing cardiac hypertrophy and fibrosis. RNA-seq showed that CCL24/CCR3 axis was involved in immune and inflammatory responses. Single-cell analysis of cytometry by time of flight (CyTOF) revealed that CCL24 antibody decreased the M2 macrophage and monocyte polarization during Ang II stimulation. Immunofluorescence co-localization analysis confirmed the expression of CCR3 in macrophage and fibroblasts. Then, in vitro experiments confirmed that CCL24/CCR3 axis was also involved in cardiac primary fibroblast activation through its G protein-coupled receptor function.

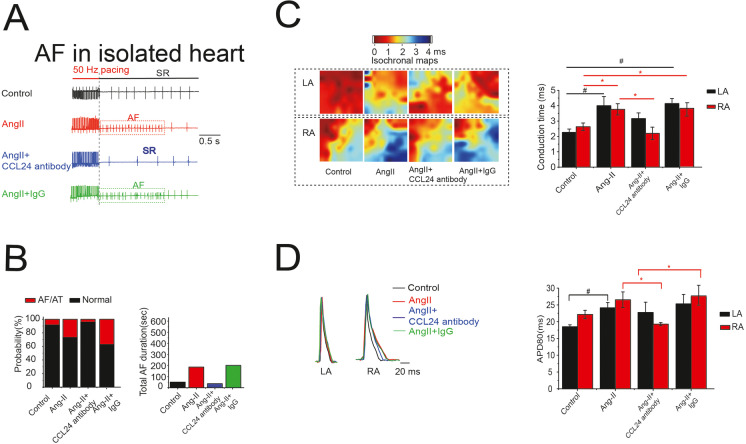
Conclusion: CCL24/CCR3 axis plays a crucial part in cardiac remodeling by stimulating M2 macrophage polarization and cardiac fibroblast activation. Cardiac M2 macrophages, CCL24 and circulation CCL24 increased in heart failure patients. Treatment with CCL24 Ab hindered Ang II induced cardiac structural dysfunction and electrical remodeling. In CCL24 Ab group RNA-seq found that it was related to immune responses and hypertrophic cardiomyopathy, CytoF revealed M2 macrophages and monocytes decreased obviously. In vitro,CCL24 promoted activation and migration of cardiac fibroblast.

Keywords: CCL24; Cardiac fibroblast; Heart failure; M2 macrophage.


Conflict of interest statement

The authors declare no competing interests.

Figures

Fig. 1
Fig. 1
Correlation between CCL24/CCR3 axis and heart failure. A Masson’s trichrome staining of myocardial fibrosis in heart failure patient and donor cardiac tissue, scale bar in panel B is 200 μm. The data are represented as the means ± SEM (n = 5; unpaired Student’s t test; P < 0.0001: normal patient group vs. heart failure patient group). B Immunofluorescence staining of M2 macrophage in the heart tissue of heart failure and donor patients, scale bar in panel A is 500 μm. C Immunohistochemical staining of CCL24 in the heart tissue of heart failure and donor patients, scale bar in panel A is 500 μm. D The level of CCL24 in the plasma of heart failure patient and healthy donor. The data are represented as the means ± SEM (n = 14; unpaired Student’s t test; P < 0.05). E Sirius red staining of myocardial fibrosis in old (up) and young (down) mice, scale bar in panel D is 50 μm. The data are represented as the means ± SEM (n = 3; unpaired Student’s t test; P = 0.0014)
Fig. 2
Fig. 2
Treatment of CCL24 blocking antibody hindered angiotensin II–induced cardiac electrical remodeling. A Atrial electrogram recordings in response to burst pacing in Langendorff-perfused mice hearts. B Number of mice (of a total of 6 in each group) in which AF and/or atrial flutter could be reproducibly induced by right atrial (RA) burst pacing. (n = 6; P = 0.038 by Fisher’s exact test) and AF duration time induced by atrial burst pacing in mice. High-resolution optical mapping to measure conduction velocity in Langendorff-perfused mice hearts. D The APD80 of atrial in Langendorff-perfused mice hearts
Fig. 3
Fig. 3
Treatment of CCL24 blocking antibody hindered angiotensin II–induced heart failure and cardiac hypertrophy. A M-mode echocardiography of left ventricular chamber and the measurement of ejection fraction (EF %) and fractional shortening (FS %). The data are represented as the means ± SEM (n = 16; one-way ANOVA; P < 0.05). B Hematoxylin and eosin staining of heart section. Scale bar in panel A is 1000 μm. C Representative heart size, and heart weight to body weight (HW/BW) ratio. The data are represented as the means ± SEM (n = 6; one-way ANOVA; P < 0.05). D TRITC-labelled wheat germ agglutinin staining of heart tissue sections, and quantification of cardiac-myocyte cross-sectional area (50 cells counted per heart). Scale bar in panel C is 50 μm. The data are represented as the means ± SEM (n = 6; one-way ANOVA; P < 0.0001)
Fig. 4
Fig. 4
Treatment of CCL24 blocking antibody hindered angiotensin II–induced cardiac fibrosis. A Masson’s trichrome staining and Sirius red staining of myocardial fibrosis in heart tissues in mice. Scale bar in panel A lower part is 50 μm; scale bar in panel A upper part is 1000 μm; scale bar in panel A middle part is 200 μm. B Immunofluorescence of COL1A1 in heart tissue in mice. Scale bar in panel B is 20 μm. The data are represented as the means ± SEM (n = 6; one-way ANOVA; P < 0.05)
Fig. 5
Fig. 5
Data analysis of transcriptional profiling. A Heatmap of the differentially expressed genes. B The bar plot figure of the differentially expressed genes. C Gene set enrichment analysis (GSEA)–GO function enrichment plots of representative gene sets: CCL24 Ab + Ang II group was related to immune response, inflammatory response, innate immune response, celluar response to LPS. D Gene set enrichment analysis (GSEA)–pathway enrichment plots of representative gene sets: CCL24 Ab + Ang II group was negatively related to hypertrophic cardiomyopathy (HCM) and cardiac muscle contraction. E The mRNA expression of CCL24 in different cells
Fig. 6
Fig. 6
CytoF revealed the immune status in the mice heart. A The distribution and frequency of different immune cells in the heart. B The heatmap of different immune cells in the heart. C The proportion and frequency of M2 macrophages and monocytes in different groups. The data are represented as the means ± SEM (n = 3; one-way ANOVA; P < 0.05)
Fig. 7
Fig. 7
Immunofluorescence co-localization of CCR3 receptor. A Immunofluorescence co-localization of CCR3 receptor with endothelial cell, cardiomyocytes, and macrophage cell. B Immunofluorescence co-localization of CCR3 receptor with smooth muscle cell, endothelial cell, and fibroblast cell
Fig. 8
Fig. 8
CCL24 promoted primary cardiac fibroblast activation. A Immunofluorescence of ACTA2 in heart tissues in mice. Scale bar in panel A upper part is 50 μm; scale bar in panel A lower part is 10 μm. B CCK8 counting assay of the proliferation of cardiac primary fibroblast. The data are represented as the means ± SEM (one-way ANOVA; P = 0.0028: control group vs. CCL24 100UM group, P = 0.0006: control group vs. CCL24 250UM group, P < 0.0001: control group vs. CCL24 500UM group). C Quantitative real-time polymerase chain reaction analysis of the mRNA levels of ACTA2, COL1A1 and COL3A1 in cardiac primary fibroblast with different stimulations. The data are represented as the means ± SEM (unpaired Student’s t test; P < 0.05: control group vs. CCL24 group). D Western blot analysis of ACTA2, COL1A1, COL3A1, Tgf-β, and CCN2 protein in in cardiac primary fibroblast under different stimulation. The data are represented as the means ± SEM (unpaired Student’s t test; P < 0.05: control group vs. CCL24 group)
Fig. 9
Fig. 9
CCL24 promoted the migration of primary cardiac fibroblast. A Monolayer wound healing experiment of primary cardiac fibroblast under different stimulation. Scale bar in panel A is 100 μm. The data are represented as the means ± SEM (unpaired Student’s t test; P = 0.0003: control group vs. CCL24 100UM group). B Boyden chamber cell migration assay of primary cardiac fibroblast under different stimulation. Scale bar in panel B part is 200 μm. The data are represented as the means ± SEM (unpaired Student’s t test; P < 0.0001: control group vs. CCL24 100UM group)
Fig. 10
Fig. 10
Data analysis of transcriptional profiling. A, B, C Transcriptome analysis was performed ground on the RNA-seq data. D Heatmap of the cardiac fibroblast activation related expressed genes. E Quantitative real-time polymerase chain reaction analysis of the mRNA levels of ACTA2, COL1A1, and COL3A1 in cardiac primary fibroblast under CCR3 inhibitor stimulation. These data are represented as the means ± SEM (unpaired Student’s t test; P < 0.05)
Fig. 11
Fig. 11
Bioinformatics analysis of differentially expressed genes. A The top 30 enrichment of the biological process results are listed. B The enriched signaling pathways from KEGG pathway, panther enrichment, reactome enrichment analysis. C Gene set enrichment analysis (GSEA)–GO function enrichment plots of representative gene sets from CCR3 inhibitor group and Control group: negative regulation of cell division, negative regulation of cell adhesion. D Gene set enrichment analysis (GSEA)–pathway enrichment plots of representative gene sets from CCR3 inhibitor group and control group: negative regulation of dilated cardiac cardiomyopathy (DCM) pathway, negative regulation of hypertrophic cardiomyopathy (HCM) pathway. E The PPI analysis of the differentially expressed genes

Similar articles

Cited by

References

    1. Aukrust P, et al. Elevated circulating levels of C-C chemokines in patients with congestive heart failure. Circulation. 1998;97(12):1136–1143. doi: 10.1161/01.CIR.97.12.1136. - DOI - PubMed
    1. Buechler MB, et al. Cross-tissue organization of the fibroblast lineage. Nature. 2021;593(7860):575–579. doi: 10.1038/s41586-021-03549-5. - DOI - PubMed
    1. Caidahl K, et al. Homeostatic chemokines and prognosis in patients with acute coronary syndromes. J Am Coll Cardiol. 2019;74(6):774–782. doi: 10.1016/j.jacc.2019.06.030. - DOI - PubMed
    1. Curley D, et al. Molecular imaging of cardiac remodelling after myocardial infarction. Basic Res Cardiol. 2018;113(2):10. doi: 10.1007/s00395-018-0668-z. - DOI - PMC - PubMed
    1. Damås JK, et al. Myocardial expression of CC- and CXC-chemokines and their receptors in human end-stage heart failure. Cardiovasc Res. 2000;47(4):778–787. doi: 10.1016/S0008-6363(00)00142-5. - DOI - PubMed

Publication types