Exposure to phenanthrene affects oocyte meiosis by inducing mitochondrial dysfunction and endoplasmic reticulum stress
- PMID: 36125441
- PMCID: PMC9816937
- DOI: 10.1111/cpr.13335
Exposure to phenanthrene affects oocyte meiosis by inducing mitochondrial dysfunction and endoplasmic reticulum stress
Abstract
Objectives: Phenanthrene (PHE) is one of the most abundant polycyclic aromatic hydrocarbons (PAHs), which is a widespread environmental contaminant. Various studies showed that PHE has adverse impacts on animals and human health. It has been shown that PHE exposure induced follicular atresia and endocrine dyscrasia in female mice. However, the potential mechanism regarding how PHE affects female reproductive system especially the oocyte quality has not been elucidated.
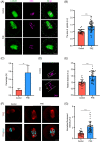
Methods and results: In this study, we set up PHE exposure model and found that PHE exposure compromised oocytes maturation competence by inhibiting spindle assembly and chromosomes alignment. Moreover, PHE exposure induced mitochondrial dysfunction and endoplasmic reticulum (ER) stress, leading to increased reactive oxygen species (ROS) and aberrant calcium levels in cytoplasm, eventually induced oxidative stress and DNA damage in oocytes. Furthermore, we found that oral administration of PHE caused the occurrence of oxidative stress and apoptosis in female ovary. In addition, the oocyte exhibited aberrant spindle morphology and failure of actin cap formation in metaphase II oocytes.
Conclusions: Taken together, our study demonstrated that mitochondrial dysfunction and ER stress-induced oxidative stress and DNA damage are the major cause of poor oocyte quality after PHE exposure.
© 2022 The Authors. Cell Proliferation published by Beijing Institute for Stem Cell and Regenerative Medicine and John Wiley & Sons Ltd.
Conflict of interest statement
The authors declare that they have no known competing financial interests or personal relationships that could have appeared to influence the work reported in this article.
Figures


Similar articles
-
Copper oxide nanoparticles impairs oocyte meiosis maturation by inducing mitochondrial dysfunction and oxidative stress.Food Chem Toxicol. 2024 Mar;185:114441. doi: 10.1016/j.fct.2024.114441. Epub 2024 Jan 11. Food Chem Toxicol. 2024. PMID: 38218586
-
Gossypol exposure induces mitochondrial dysfunction and oxidative stress during mouse oocyte in vitro maturation.Chem Biol Interact. 2021 Oct 1;348:109642. doi: 10.1016/j.cbi.2021.109642. Epub 2021 Sep 9. Chem Biol Interact. 2021. PMID: 34509492
-
In vitro acute exposure to DEHP affects oocyte meiotic maturation, energy and oxidative stress parameters in a large animal model.PLoS One. 2011;6(11):e27452. doi: 10.1371/journal.pone.0027452. Epub 2011 Nov 4. PLoS One. 2011. PMID: 22076161 Free PMC article.
-
Impact of stress on oocyte quality and reproductive outcome.J Biomed Sci. 2016 Mar 29;23:36. doi: 10.1186/s12929-016-0253-4. J Biomed Sci. 2016. PMID: 27026099 Free PMC article. Review.
-
Symposium review: Reduction in oocyte developmental competence by stress is associated with alterations in mitochondrial function.J Dairy Sci. 2018 Apr;101(4):3642-3654. doi: 10.3168/jds.2017-13389. Epub 2018 Feb 1. J Dairy Sci. 2018. PMID: 29395145 Review.
Cited by
-
Supplementation with Eupatilin during In Vitro Maturation Improves Porcine Oocyte Developmental Competence by Regulating Oxidative Stress and Endoplasmic Reticulum Stress.Animals (Basel). 2024 Jan 30;14(3):449. doi: 10.3390/ani14030449. Animals (Basel). 2024. PMID: 38338092 Free PMC article.
-
Endoplasmic reticulum stress related IncRNA signature predicts the prognosis and immune response evaluation of uterine corpus endometrial carcinoma.Front Oncol. 2023 Jan 4;12:1064223. doi: 10.3389/fonc.2022.1064223. eCollection 2022. Front Oncol. 2023. PMID: 36686816 Free PMC article.
-
Air pollutants as modulators of mitochondrial quality control in cardiovascular disease.Physiol Rep. 2024 Nov;12(22):e70118. doi: 10.14814/phy2.70118. Physiol Rep. 2024. PMID: 39562150 Free PMC article. Review.
-
Calcium signaling in oocyte quality and functionality and its application.Front Endocrinol (Lausanne). 2024 Aug 16;15:1411000. doi: 10.3389/fendo.2024.1411000. eCollection 2024. Front Endocrinol (Lausanne). 2024. PMID: 39220364 Free PMC article. Review.
References
-
- Yin S, Tang M, Chen F, Li T, Liu W. Environmental exposure to polycyclic aromatic hydrocarbons (PAHs): the correlation with and impact on reproductive hormones in umbilical cord serum. Environ Pollut. 2017;220(Pt B):1429‐1437. - PubMed
-
- Martorell I, Perello G, Marti‐Cid R, Castell V, Llobet JM, Domingo JL. Polycyclic aromatic hydrocarbons (PAH) in foods and estimated PAH intake by the population of Catalonia, Spain: temporal trend. Environ Int. 2010;36(5):424‐432. - PubMed
-
- Pufulete M, Battershill J, Boobis A, Fielder R. Approaches to carcinogenic risk assessment for polycyclic aromatic hydrocarbons: a UK perspective. Regul Toxicol Pharmacol. 2004;40(1):54‐66. - PubMed
-
- Yu Y, Wang X, Wang B, et al. Polycyclic aromatic hydrocarbon residues in human milk, placenta, and umbilical cord blood in Beijing, China. Environ Sci Technol. 2011;45(23):10235‐10242. - PubMed
-
- Chen BH, Chen YC. Formation of polycyclic aromatic hydrocarbons in the smoke from heated model lipids and food lipids. J Agric Food Chem. 2001;49(11):5238‐5243. - PubMed
MeSH terms
Substances
Grants and funding
- LZ22C010003/Key project of Zhejiang Provincial Natural Science Foundation
- 2021R52043/Scientific and Technological Innovation Leading Talents Project of Zhejiang Provincial "High-level Talents Special Support Plan"
- 2020FR033/Zhejiang A&F University Talent Initiative Project
- 2021C02068-4/Zhejiang Science and Technology Major Program on Agricultural New Variety Breeding
LinkOut - more resources
Full Text Sources
Miscellaneous

