. 2022 Oct 14;50(18):10230-10248.
doi: 10.1093/nar/gkac778.

Super-enhancer-controlled positive feedback loop BRD4/ERα-RET-ERα promotes ERα-positive breast cancer

Affiliations

Super-enhancer-controlled positive feedback loop BRD4/ERα-RET-ERα promotes ERα-positive breast cancer

Zao-Zao Zheng et al. Nucleic Acids Res. .

Abstract

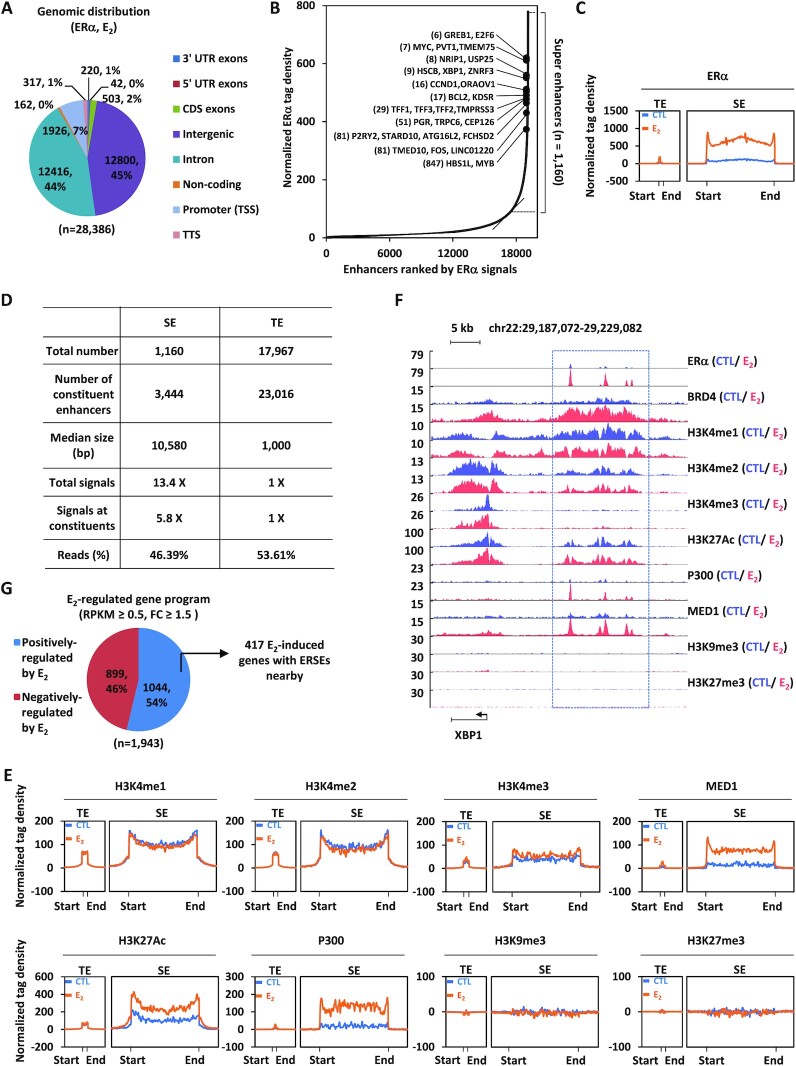
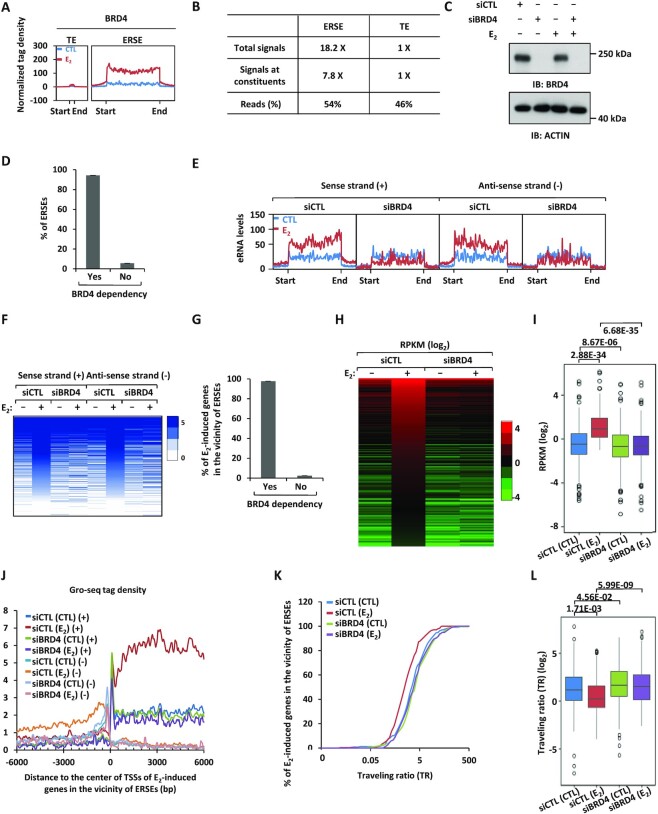
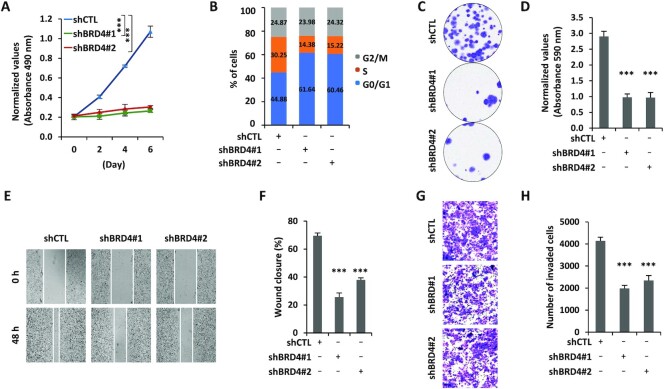
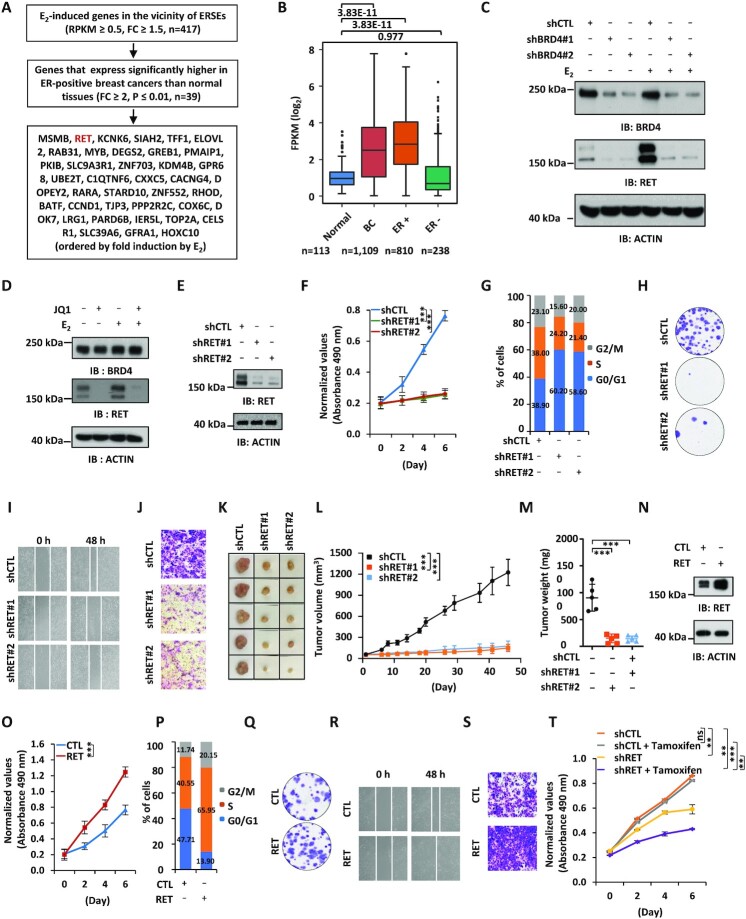
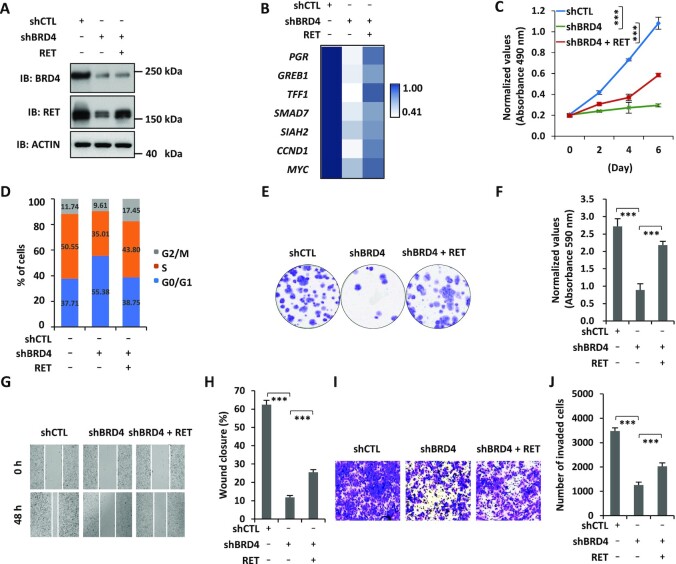
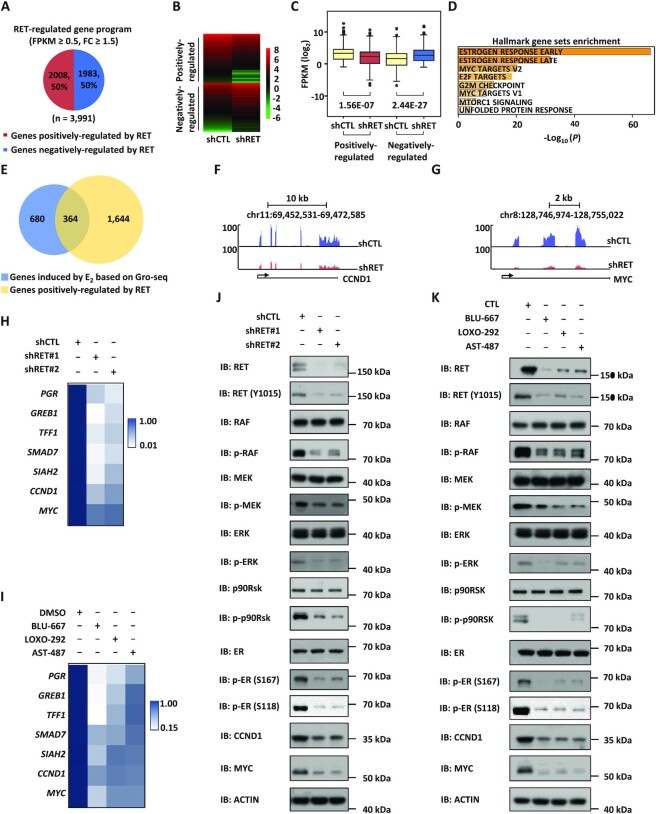
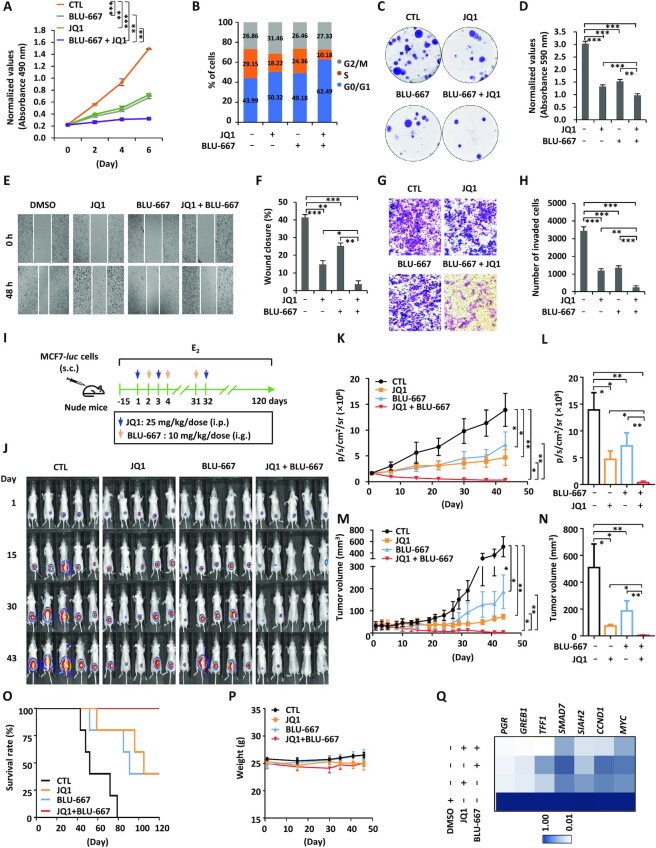
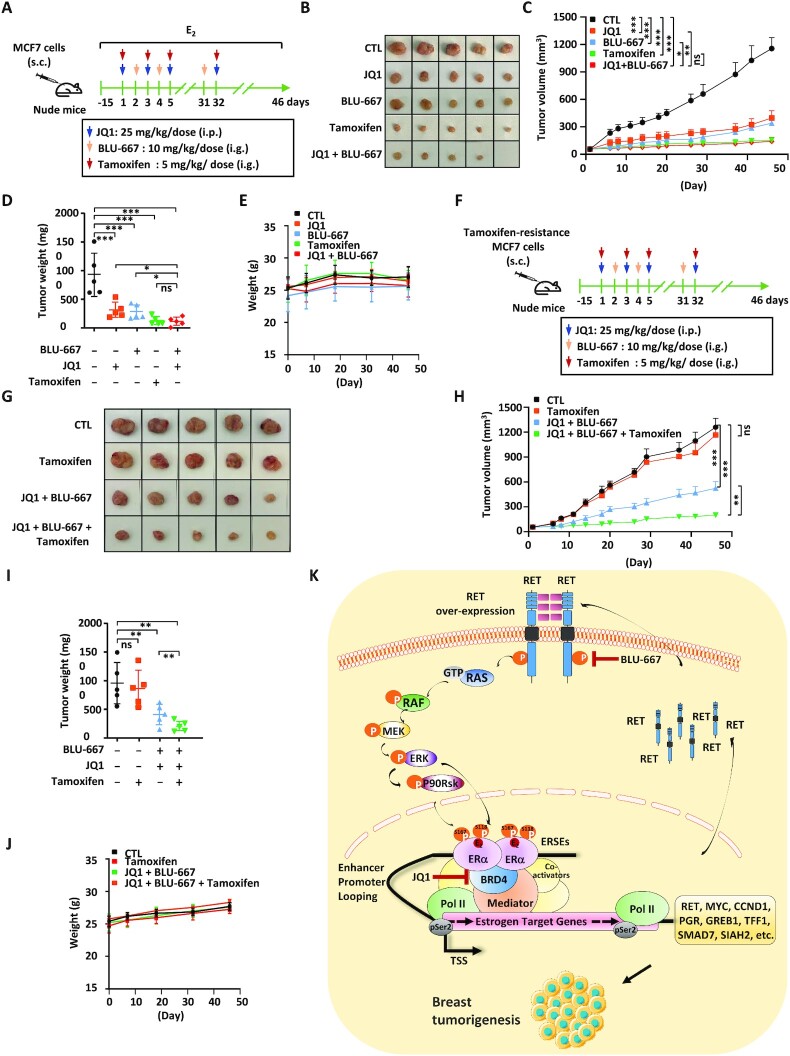
Estrogen and estrogen receptor alpha (ERα)-induced gene transcription is tightly associated with ERα-positive breast carcinogenesis. ERα-occupied enhancers, particularly super-enhancers, have been suggested to play a vital role in regulating such transcriptional events. However, the landscape of ERα-occupied super-enhancers (ERSEs) as well as key ERα-induced target genes associated with ERSEs remain to be fully characterized. Here, we defined the landscape of ERSEs in ERα-positive breast cancer cell lines, and demonstrated that bromodomain protein BRD4 is a master regulator of the transcriptional activation of ERSEs and cognate ERα target genes. RET, a member of the tyrosine protein kinase family of proteins, was identified to be a key ERα target gene of BRD4-regulated ERSEs, which, in turn, is vital for ERα-induced gene transcriptional activation and malignant phenotypes through activating the RAS/RAF/MEK2/ERK/p90RSK/ERα phosphorylation cascade. Combination therapy with BRD4 and RET inhibitors exhibited additive effects on suppressing ERα-positive breast cancer both in vitro and in vivo, comparable with that of standard endocrine therapy tamoxifen. Furthermore, combination therapy re-sensitized a tamoxifen-resistant ERα-positive breast cancer cell line to tamoxifen treatment. Taken together, our data uncovered the critical role of a super-enhancer-associated positive feedback loop constituting BRD4/ERα-RET-ERα in ERα-positive breast cancer, and suggested that targeting components in this loop would provide a new therapeutic avenue for treating ERα-positive breast cancer in the clinic.


Figures

Figure 1.
Figure 1.
ERSEs are highly active in ERα-positive breast cancer. (A) MCF7 cells treated with estrogen (E2, 10−7 M, 1 h) were subjected to ChIP-seq with anti-ERα-specific antibody. Genomic distribution of ERα-binding sites is shown by a pie chart. (B) Normalized ERα ChIP-seq tag density in enhancer regions after clustering is shown. Estrogen-induced genes in the vicinity of representative ERSEs are shown. The number in parentheses indicates the rank of ChIP-seq tag density. (C) Metagene representation of ERα occupancy at typical enhancers (TEs) and super-enhancers (SEs) is shown. The x-axis shows the start and end of the TE (left) or SE (right) regions flanked by a 3 kb sequence. The y-axis shows the normalized tag density. (D) The characteristics of TEs and SEs defined by ERα are shown. (E) Metagene representation of H3K4me1, H3K4me2, H3K4me3, MED1, H3K27Ac, P300, H3K9me3 and H3K27me3 occupancy at TEs and SEs is shown. The x-axis shows the start and end of the TE (left) or SE (right) regions flanked by ± 3 kb sequence. The y-axis shows the normalized tag density. (F) UCSC Genome browser views of ERα, BRD4, H3K4me1, H3K4me2, H3K4me3, H3K27Ac, P300, MED1, H3K9me3 and H3K27me3 ChIP-seq in the presence or absence of estrogen on the SE region in the vicinity of the estrogen-induced gene, XBP1. The boxed region indicates SEs. (G) MCF7 cells treated or not with estrogen (E2, 10−7 M, 1 h) were subjected to Gro-seq. Genes positively and negatively regulated by estrogen based on Gro-seq, and those with an SE nearby are shown.
Figure 2.
Figure 2.
BRD4 is a master regulator of the transcriptional activation of ERSEs as well as of estrogen target genes in the vicinity. (A) MCF7 cells treated or not with estrogen (E2, 10−7 M, 1 h) were subjected to ChIP-seq with anti-BRD4-specific antibody. Metagene representation of BRD4 occupancy at typical enhancers (TEs) and ERSEs is shown. The x-axis shows the start and end of the TE (left) or SE (right) regions flanked by ± 3 kb sequence. The y-axis shows the normalized tag density. (B) Statistics of BRD4 ChIP-seq on TEs and ERSEs. (C) MCF7 cells transfected with control siRNA (siCTL) or siRNAs specifically targeting BRD4 (siBRD4) were treated or not with estrogen (E2, 10−7 M, 1 h), followed by immunoblotting (IB) analysis using antibodies as indicated. Molecular weight is indicated on the right (in kDa). (D) MCF7 cells as described in (C) were subjected to Gro-seq analysis. The levels of eRNA were calculated, and the percentage of BRD4-dependent SEs is shown. (E, F) eRNA levels on both sense and antisense strands on ERSEs as detected by Gro-seq as described in (D) are shown by tag density plot (E) and heat map (F). (G) The percentage of ERSE-associated and estrogen-induced genes that are BRD4 dependent is shown. (H, I) The expression of ERSE-associated and estrogen-induced genes that are BRD4 dependent is shown by heat map (H) and box plot (I) (unpaired Student's t-test, two-tailed). (J) Gro-seq tag density, both sense (+) and antisense (−), centered on the TSSs (± 6000 bp) of ERSE-associated and estrogen-induced genes that are BRD4 dependent is shown. (K) Traveling ratio (TR) distribution calculated based on Gro-seq tag density for ERSE-associated and estrogen-induced genes that are BRD4 dependent. (L) The change of the TR as shown in (K) is shown by box plot (unpaired Student's t-test, two-tailed).
Figure 3.
Figure 3.
BRD4 promotes the malignant behaviors of ERα-positive breast cancer cells. (A–C, E, G) MCF7 cells infected with lentiviral control shRNA (shCTL) or two independent shRNAs specifically targeting BRD4 (shBRD4#1 and shBRD4#2) were maintained in the presence of estrogen (E2, 10−7 M) followed by cell proliferation assay (A), FACS analysis (B), colony formation assay (C), wound healing (E) and transwell assay (G). (D, F, H) Quantification of the crystal violet dye as shown in (C) (D), wound closure in (E) (F) and the number of invaded cells in (G) (H) (± SEM, n = 3, ***P <0.001). Representative images are shown.
Figure 4.
Figure 4.
RET is associated with BRD4-regulated ERSEs, and promotes the malignant behaviors of ERα-positive breast cancer cells. (A) Flowchart of identifying ERSE-associated estrogen target genes that are clinically relevant. (B) The expression of RET in normal, breast cancer (BC), ER-positive (ER+) breast cancer and ER-negative (ER) breast cancer samples from the TCGA database is shown by box plot (unpaired Student's t-test, two-tailed). (C) MCF7 cells infected with lentiviral control shRNA (shCTL) or two independent shRNAs specifically targeting BRD4 (shBRD4#1 and shBRD4#2) were maintained in the presence or absence of estrogen (E2, 10−7 M, 6 h) followed by immunoblotting (IB) analysis using antibodies as indicated. Molecular weight is indicated on the right (in kDa). (D) MCF7 cells pre-treated or not with JQ1 (250 nM, 30 min) were then treated or not with estrogen (E2, 10−7 M, 6 h) followed by IB analysis using antibodies as indicated. Molecular weight is indicated on the right (in kDa). (E–J) MCF7 cells infected with lentiviral control shRNA (shCTL) or two independent shRNAs specifically targeting RET (shRET#1 and shRET#2) were maintained in the presence of estrogen (E2, 10−7 M) followed by IB analysis (E), cell proliferation assay (F), FACS analysis (G), colony formation assay (H), wound healing assay (I) and transwell assay (J). (K) Xenograft experiments were performed by injecting shRNA or shRET lentivirus-infected MCF7 cells into female BALB/C nude mice (five mice per group). Tumor growth was monitored daily, and tumors were then excised, photographed and weighed at the end of the experiment. (L) The growth curve of tumors as in (K) is shown (± SD, ***P <0.001). (M) The weight of tumors as in (K) is shown (± SD, ***P <0.001). (N–S) MCF7 cells infected with lentiviral control vector (CTL) or vector expressing RET were maintained in the presence of estrogen (E2, 10−7 M) followed by IB analysis (N), cell proliferation assay (O), FACS analysis (P), colony formation assay (Q), wound healing assay (R) and transwell assay (S). (T) Tamoxifen-resistant MCF7 cells infected with shCTL or shRET were treated or not with tamoxifen (2 μM), followed by cell proliferation assay (± SEM, **P <0.01; ***P <0.001; ns, non-significant).
Figure 5.
Figure 5.
RET is a downstream target of BRD4-regulated ERSEs. (A–E, G, I) MCF7 cells infected with control lentiviral vector or lentiviral vector expressing shBRD4 in the presence or absence of lentiviral vector expressing RET were subjected to immunoblotting (IB) analysis (A), RT–qPCR analysis to examine the expression of selected estrogen target genes (B), cell proliferation assay (C), FACS analysis (D), colony formation assay (E), wound healing assay (G) and transwell assay (I). Molecular weight is indicated on the right. Statistical significance for (B) is shown in Supplementary Table S2 (± SEM, *P <0.05; **P <0.01; ***P <0.001). (F, H, J) Quantification of the crystal violet dye as shown in (E) (F), wound closure in (G) (H) and the number of invaded cells in (I) (J) (± SEM, n = 3, ***P <0.001). Representative images are shown.
Figure 6.
Figure 6.
RET activates the RAS/RAF/MEK/ERK/p90RSK/ERα phosphorylation cascades to promote the expression of estrogen target genes. (A) MCF7 cells were infected with lentiviral control shRNA (shCTL) or shRNA specifically targeting RET (shRET) followed by RNA-seq analysis. Genes positively and negatively regulated by RET are shown by a pie chart. (B, C) Heat map (B) and box blot (C) representation of the expression (FPKM, log2) for genes regulated by RET (unpaired Student's t-test, two-tailed). (D) Hallmark gene set enrichment analysis for genes positively regulated by RET. (E) The overlap of genes induced by E2 and genes positively regulated by RET is shown by a Venn diagram. (F, G) UCSC Genome browser views of the expression of CCND1 and MYC from RNA-seq are shown. Blue, shCTL; red, shRET. (H) MCF7 cells infected with control shRNA (shCTL) or two independent shRNAs specifically targeting RET (shRET#1 and shRET#2) were maintained in the presence of estrogen (E2, 10−7 M, 6 h) followed by RT–qPCR analysis to examine selected estrogen-induced genes. Statistical significance is shown in Supplementary Table S2 (± SEM, *P <0.05; **P <0.01; ***P <0.001). (I) MCF7 cells pre-treated with LOXO-292 (1 μM), BLU-667 (1 μM) or AST487 (1 μM) were then treated with estrogen (E2, 10−7 M, 6 h) followed by RT–qPCR analysis to examine selected estrogen-induced genes. Statistical significance is shown in Supplementary Table S2 (± SEM, *P <0.05; **P <0.01; ***P <0.001). (J, K) MCF7 cells as described in (H) or (I) were subjected to immunoblotting (IB) analysis using antibodies as indicated. Molecular weight is indicated on the right (in kDa).
Figure 7.
Figure 7.
Combination treatment with BRD4 and RET inhibitors suppresses ERα-positive breast cancer cell growth both in vitro and in vivo. (A–C, E, G) MCF7 cells treated or not with JQ1 (250 nM) in the presence or absence of BLU-667 (1 μM) were subjected to cell proliferation assay (A), FACS analysis (B), colony formation assay (C), wound healing assay (E) and transwell assay (G). (D, F, H) Quantification of the crystal violet dye as shown in (C) (D), wound closure in (E) (F) and the number of invaded cells in (G) (H) (± SEM, n = 3, **P <0.01; ***P <0.001). Representative images are shown. (I) Six-week-old female nude mice were injected subcutaneously (s.c.) with MCF7 cells stably expressing a luciferase reporter (MCF7-luc, 5.0 × 106 cells/mouse), and randomized for treatment 15 days later (day 1, five mice/group). Mice were treated with CTL [PBS, intraperitoneal (i.p.) injection], JQ1 (50 mg/kg, i.p. injection), BLU-667 [20 mg/kg, gavage (i.g.) injection] or JQ1 (25 mg/kg) combined with BLU-667 (10 mg/kg) following the protocol as depicted. Mice were brushed with estrogen (E2, 10−2 M) on the neck every 3 days for the duration of the experiments to induce tumor formation. (J) Tumor growth was monitored by bioluminescence imaging. (K, M) The tumor growth curves based on bioluminescence (K) and tumor volumes (M) are shown (± SEM, n = 5, *P <0.05; **P <0.01; ***P <0.001, two-way ANOVA). (L, N) The average of bioluminescence (L) and tumor volume (N) based on (K) and (M), respectively, is shown (± SEM, *P <0.05; **P <0.01; ***P <0.001). (O) The survival curves of mice as shown in (J). (P) The average of mice weight as shown in (J). (Q) Tumors as shown in (J) were excised and subjected to RNA extraction followed by RT–qPCR analysis to examine the expression of genes as indicated. Statistical significance is shown in Supplementary Table S2 (± SEM, *P <0.05; **P <0.01; ***P <0.001).
Figure 8.
Figure 8.
Combination treatment with BRD4 and RET inhibitors is comparable with tamoxifen treatment, and can re-sensitize tamoxifen-resistant cells. (A) Six-week-old female nude mice were injected subcutaneously (s.c.) with MCF7 cells (5.0 × 106 cells/mouse), and randomized for treatment 15 days later (day 1, five mice/group). Mice were treated with CTL [corn oil, intraperitoneal (i.p.) injection], JQ1 (25 mg/kg, i.p. injection), BLU-667 [10 mg/kg, gavage (i.g.) injection], tamoxifen (5 mg/kg, i.g. injection) or JQ1 (25 mg/kg) combined with BLU-667 (10 mg/kg) following the protocol as depicted. Mice were brushed with estrogen (E2, 10−2 M) on the neck every 3 days for the duration of the experiments to induce tumor formation. Tumor growth was monitored daily, and tumors were then excised, photographed and weighed. (B) Tumors as described in (A) were excised and photographed. (C) The tumor growth curve for tumors as described in (A) is shown (± SEM, n = 5, *P <0.05; **P <0.01; ***P <0.001, two-way ANOVA). (D) The weight of tumors as described in (A) is shown (± SD, ***P <0.001). (E) The body weight of mice as described in (A) is shown (± SD). (F) Six-week-old female nude mice were injected s.c. with tamoxifen-resistant MCF7 cells (5.0 × 106 cells/mouse), and randomized for treatment 15 days later (day 1, five mice/group). Mice were treated with CTL (corn oil), tamoxifen (5 mg/kg), JQ1 (25 mg/kg) combined with BLU-667 (10 mg/kg) or tamoxifen (5 mg/kg) combined with JQ1 (25 mg/kg) and BLU-667 (10 mg/kg) following the protocol as depicted. (G) Tumors as described in (F) were excised and photographed. (H) The tumor growth curve for tumors as described in (F) is shown (± SEM, n = 5, **P <0.01; ***P <0.001; ns, non-significant, two-way ANOVA). (I) The weight of tumors as described in (G) is shown (± SD, **P <0.01; ns, non-significant). (J) The body weight of mice as described in (F) is shown (± SD). (K) A proposed working model for an SE-controlled positive feedback loop constituting BRD4/ERα–RET–ERα in promoting ERα-positive breast cancer. Estrogen-induced BRD4 binding on ERSEs triggers the expression of a large cohort of oncogenic estrogen targets including RET, which activates the RAS/RAF/MEK/ERK/p90RSK signaling cascades to induce ERα phosphorylation and the expression of estrogen target genes. The amplification of oncogenic signaling from this positive feedback loop constituting BRD4/ERα–RET–ERα contributes to ERα-positive breast carcinogenesis. Simultaneously targeting two critical components in this loop, BRD4 and RET, is effective in suppressing ERα-positive breast cancer both in vitro and in vivo.

Similar articles

Cited by

References

    1. Sung H., Ferlay J., Siegel R.L., Laversanne M., Soerjomataram I., Jemal A., Bray F.. Global cancer statistics 2020: GLOBOCAN estimates of incidence and mortality worldwide for 36 cancers in 185 countries. CA Cancer J. Clin. 2021; 71:209–249. - PubMed
    1. Koboldt D.C., Fulton R.S., McLellan M.D., Schmidt H., Kalicki-Veizer J., McMichael J.F., Fulton L.L., Dooling D.J., Ding L., Mardis E.R.et al. .. Comprehensive molecular portraits of human breast tumours. Nature. 2012; 490:61–70. - PMC - PubMed
    1. Burstein H.J. Systemic therapy for estrogen receptor-positive, HER2-negative breast cancer. Reply. N. Engl. J. Med. 2021; 384:1176–1177. - PubMed
    1. Hanker A.B., Sudhan D.R., Arteaga C.L.. Overcoming endocrine resistance in breast cancer. Cancer Cell. 2020; 37:496–513. - PMC - PubMed
    1. Hnisz D., Abraham B.J., Lee T.I., Lau A., Saint-Andre V., Sigova A.A., Hoke H.A., Young R.A.. Super-enhancers in the control of cell identity and disease. Cell. 2013; 155:934–947. - PMC - PubMed

Publication types

MeSH terms