. 2022 Sep 19;13(1):5491.
doi: 10.1038/s41467-022-33263-3.

A stem cell roadmap of ribosome heterogeneity reveals a function for RPL10A in mesoderm production

Affiliations

A stem cell roadmap of ribosome heterogeneity reveals a function for RPL10A in mesoderm production

Naomi R Genuth et al. Nat Commun. .

Abstract

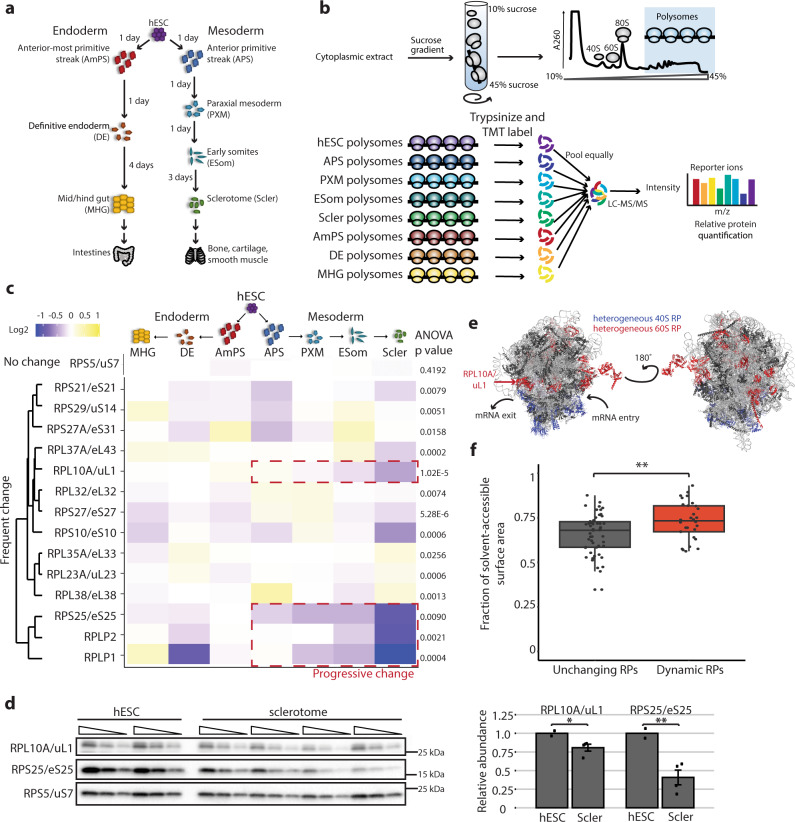
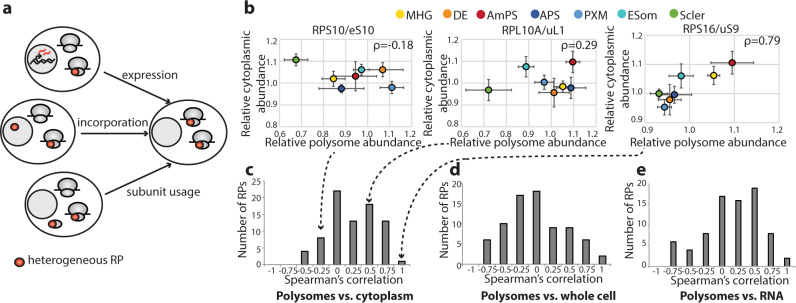
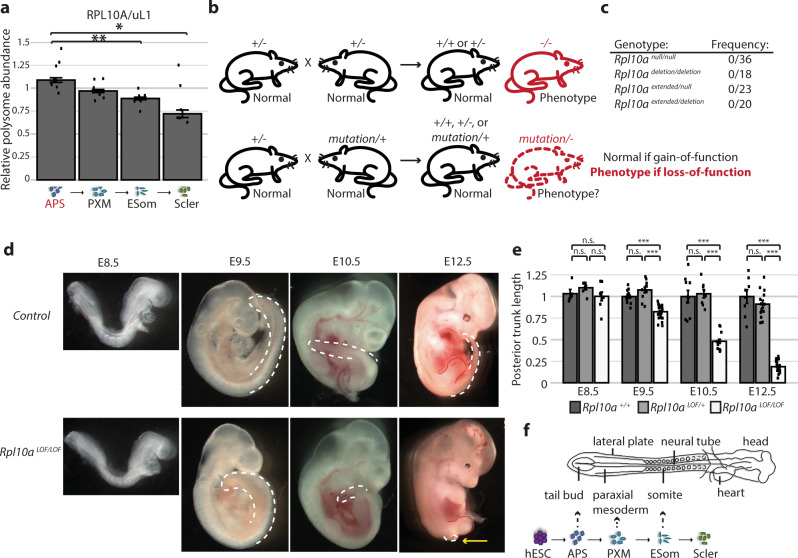
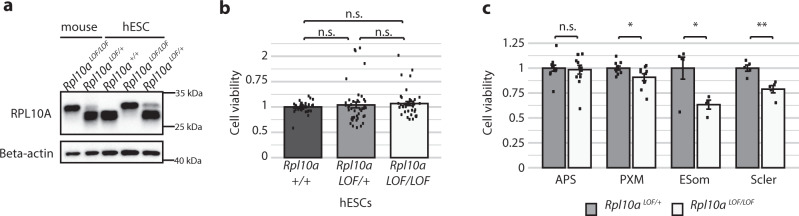
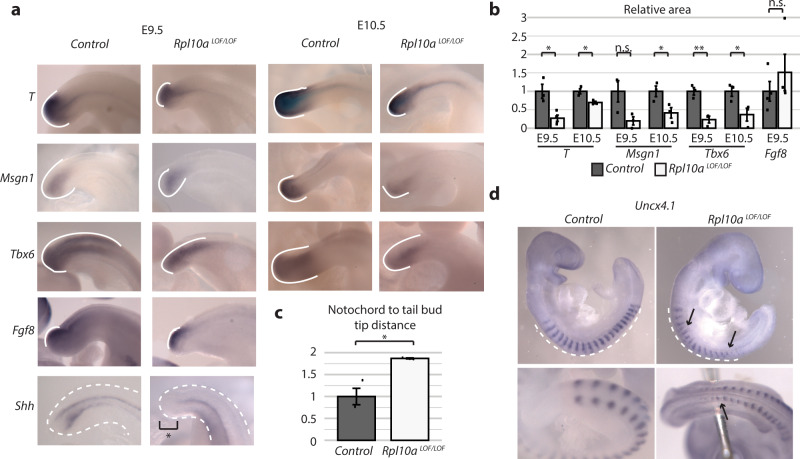
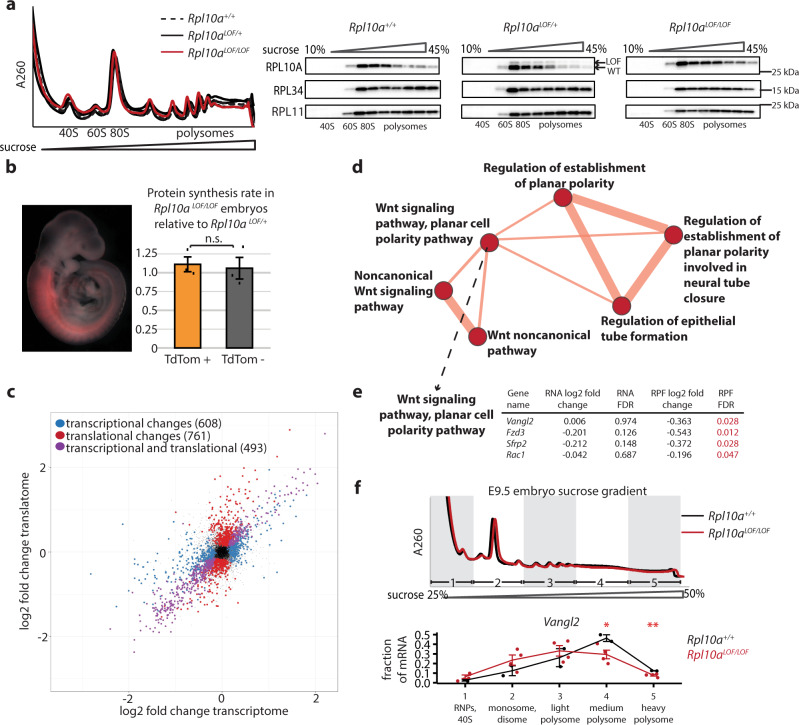
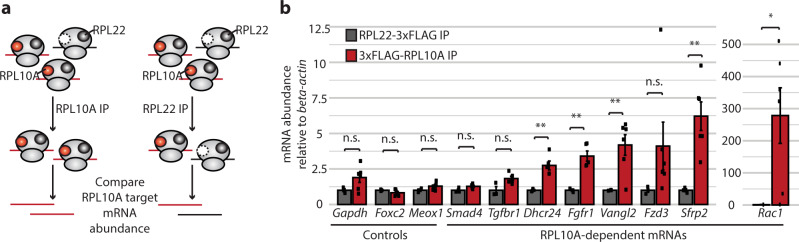
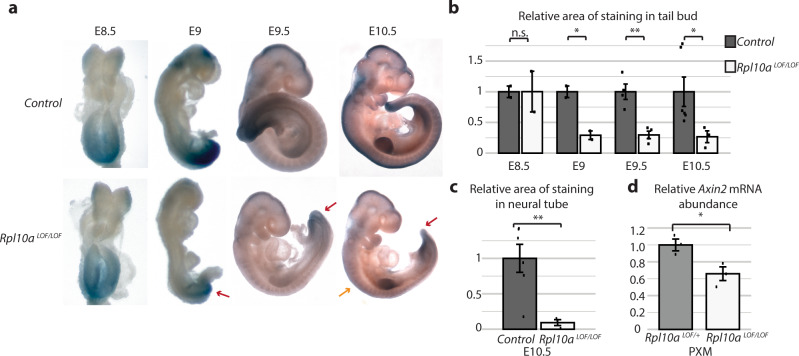
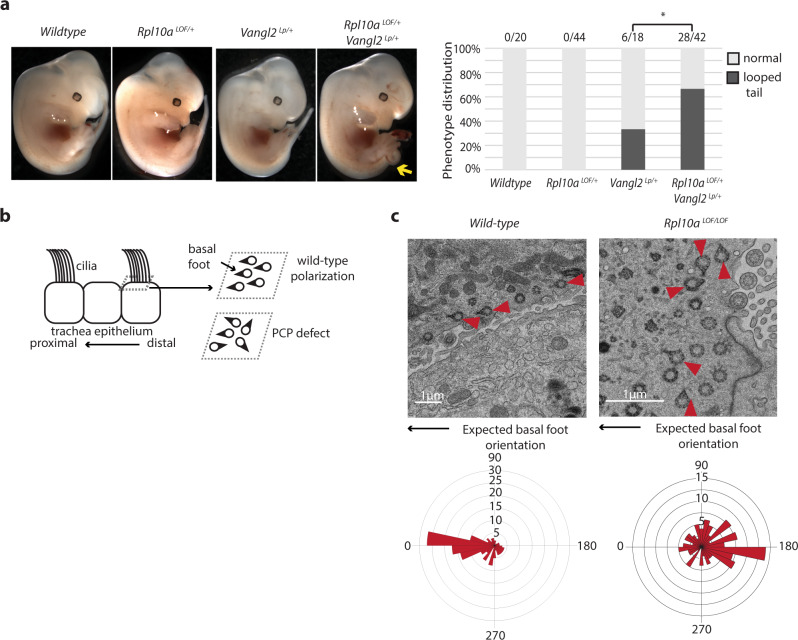
Recent findings suggest that the ribosome itself modulates gene expression. However, whether ribosomes change composition across cell types or control cell fate remains unknown. Here, employing quantitative mass spectrometry during human embryonic stem cell differentiation, we identify dozens of ribosome composition changes underlying cell fate specification. We observe upregulation of RPL10A/uL1-containing ribosomes in the primitive streak followed by progressive decreases during mesoderm differentiation. An Rpl10a loss-of-function allele in mice causes striking early mesodermal phenotypes, including posterior trunk truncations, and inhibits paraxial mesoderm production in culture. Ribosome profiling in Rpl10a loss-of-function mice reveals decreased translation of mesoderm regulators, including Wnt pathway mRNAs, which are also enriched on RPL10A/uL1-containing ribosomes. We further show that RPL10A/uL1 regulates canonical and non-canonical Wnt signaling during stem cell differentiation and in the developing embryo. These findings reveal unexpected ribosome composition modularity that controls differentiation and development through the specialized translation of key signaling networks.


Conflict of interest statement

The authors declare no competing interests.

Figures

Fig. 1
Fig. 1. Quantitative proteomics reveals ribosome composition changes during hESC differentiation.
a Schematic of hESC differentiation down the endoderm lineage to the mid/hindgut and down the mesoderm lineage to the sclerotome. b Schematic of polysome isolation by sucrose-gradient fractionation and labeling with tandem mass tags (TMT) to quantify each RP in a differentiated cell sample relative to the hESC starting population. c Heatmap of relative polysome abundance for RPs that change significantly by at least 10% in at least two differentiated cell types relative to hESCs. Several show progressive changes in abundance during mesoderm differentiation (red dashed boxes). One RP (RPS5/uS7) that does not change significantly is also included as an illustrative example. Heatmap values are median ratios of polysome abundance in each differentiated cell relative to hESCs in log2 scale, n = 6 for each cell type except for anterior primitive streak and mid/hindgut (n = 7 each), and P values for each RP were calculated by ANOVA. d Western blot of hESC (n = 2) and sclerotome (n = 4) polysome samples, each loaded as a serial dilution (1, 0.5, 0.25 µg). RPL10A/uL1 and RPS25/eS25 expression were normalized to the non-heterogeneous RPS5/uS7 and the middle dilution (0.5 µg) was used for quantification (shown as mean +/− SEM). Student’s t test P value = 0.03 for RPL10A/uL1, 0.008 for RPS25/eS25. e Location of the 31 heterogeneous RPs in the polysome mass spectrometry on the human 80 S ribosome (PDB: 4v6x). Small and large subunit heterogeneous RPs are blue and red, respectively. Non-heterogeneous RPs are dark gray and rRNA light gray. RPL10A/uL1 (red arrow) is located near the mRNA exit tunnel. f Fraction of the surface area that is solvent-exposed for each RP on the human ribosome. The 31 RPs that change significantly in polysomal abundance are significantly more solvent-accessible (Mann–Whitney test P = 0.0055), indicating they are enriched at the surface of the ribosome. Box is the interquartile range (IQR), center line is the median, whiskers represent 1.5*IQR from the box boundaries, and each point represents a single RP. *P value < 0.05; **P value < 0.01. Source data are provided as a Source Data file.
Fig. 2
Fig. 2. Polysome composition is regulated at multiple levels.
a Schematic of possible mechanisms regulating changes in RP abundance in the polysomes across cell types. b Scatterplots of median polysomal and cytoplasmic protein relative abundance in each differentiated cell relative to hESCs for RPS10/eS10, RPL10A/uL1, and RPS16/uS9 with Spearman’s correlation coefficients (ρ) in upper right corners. Error bars are standard error and points are color-coded by cell type. N = 6 for all cell types and sample preparations except for the following: n = 7 for anterior primitive streak and mid/hindgut polysome samples and n = 8 for mid/hindgut cytoplasmic samples. Dashed arrows indicate the locations of these RPs in the histogram in (c). c Histogram of Spearman’s correlation coefficients for each RP comparing polysomal and cytoplasmic protein abundance (same n as in (b)). d Histogram of Spearman’s correlation coefficients for each RP comparing polysomal (same n as in (b)) and whole-cell protein abundance (n = 5 for early somite, paraxial mesoderm, and mid/hindgut whole-cell samples; n = 6 for anterior primitive streak, sclerotome, anterior-most primitive streak, and definitive endoderm whole-cell samples). e Histogram of Spearman’s correlation coefficients for each RP comparing polysomal (same n as in (b)) and mRNA abundance (n = 3 for mesoderm lineage, n = 1 for endoderm lineage). MHG   mid/hindgut, DE   definitive endoderm, AmPS anterior-most primitive streak, APS   anterior primitive streak, PXM   paraxial mesoderm, ESom early somite, Scler sclerotome.
Fig. 3
Fig. 3. A loss-of-function mouse model uncovers a specialized role for RPL10A/uL1 in the paraxial mesoderm lineage.
a Median relative abundance of RPL10A/uL1 in the polysomes of the mesoderm lineage relative to hESCs. N = 6 for all cell types, except n = 7 for primitive streak and error bars are standard error. Student’s t test P values: anterior primitive streak to early somites 0.006, anterior primitive streak to sclerotome 0.03. b Schematic of the genetic complementation test to identify loss-of-function mutations. c Observed frequencies of Rpl10a null/null homozygotes, Rpl10a deletion/deletion homozygotes, Rpl10a extended/null double heterozygotes, and Rpl10a extended/deletion double heterozygotes. d Lateral views of E8.5, E9.5, E10.5, and E12.5 Rpl10a LOF/LOF and control embryos. The tail bud is traced in white and indicates the posterior trunk truncation; the hindlimb is also traced in red on the E12.5 images. e Quantification of posterior trunk length at E8.5, E9.5, E10.5, and E12.5. Graph shows average length relative to wild-type with SEM error bars. No significant differences were observed between wild-type and Rpl10a LOF/+ embryos; Rpl10a LOF/LOF embryos were significantly different from both wild-type and Rpl10a LOF/+ embryos at all stages except E8.5. For E8.5 wild-type n = 5, Rpl10a LOF/+ n = 7, Rpl10a LOF/LOF n = 8; for E9.5 wild-type n = 13, Rpl10a LOF/+ n = 11, Rpl10a LOF/LOF n = 25; for E10.5 wild-type n = 10, Rpl10a LOF/+ n = 8, Rpl10a LOF/LOF n = 15; for E12.5 wild-type n = 8, Rpl10a LOF/+ n = 13, Rpl10a LOF/LOF n = 19. Wild-type vs. Rpl10a LOF/LOF Student’s t test P values: 0.65 (E8.5), 2.55 × 10−7 (E9.5), 2.45 × 10−5 (E10.5), 1.13 × 10−5 (E12.5); Rpl10a LOF/+ vs. Rpl10a LOF/LOF P values: 0.10 (E8.5), 5.31 × 10−6 (E9.5), 8.89 × 10−7 (E10.5), 1.20 × 10−10 (E12.5). f Schematic of gastrulation at the tail bud to produce the paraxial mesoderm lineage, with the embryonic tissues represented in the in vitro hESC differentiation indicated. APS   anterior primitive streak, PXM   paraxial mesoderm, ESom early somite, Scler sclerotome, *P value < 0.05; **P value < 0.01, ***P value < 0.001. Source data are provided as a Source Data file.
Fig. 4
Fig. 4. Rpl10a loss-of-function hESCs have defects in paraxial mesoderm production.
a Western of whole-cell lysates from Rpl10a LOF/LOF and Rpl10a LOF/+ embryos, unedited hESCs, and hESC clones either homozygous or heterozygous for the Rpl10a LOF insertion. b Cell viability of wild-type, heterozygous, and homozygous Rpl10a LOF/LOF hESCs as measured by Cell Titer Glo (n = 44). Data are shown as mean +/− SEM and significance was calculated using Student’s t tests. c Cell viability of heterozygous and homozygous Rpl10a LOF/LOF hESCs as measured by Cell Titer Glo during differentiation down the paraxial mesoderm lineage (n = 12 for each cell line for anterior primitive streak, n = 10 for each cell line for paraxial mesoderm, n = 5 for each cell line for sclerotome, n = 5 for Rpl10a LOF/+ cells and n = 4 for Rpl10a LOF/LOF cells for early somites). Data are shown as mean +/− SEM. Student’s t test P values: 0.77 (anterior primitive streak), 0.04 (paraxial mesoderm), 0.03 (early somite), 0.002 (sclerotome). APS   anterior primitive streak, PXM   paraxial mesoderm, ESom early somite, Scler sclerotome. *P value <0.05; **P value <0.01. Source data are provided as a Source Data file.
Fig. 5
Fig. 5. Rpl10aLOF/LOF embryos exhibit defects in paraxial mesoderm lineage formation.
a Whole-mount in situ hybridizations in control and Rpl10a LOF/LOF embryos at E9.5 and E10.5. The region of expression at the tail bud is demarcated with a solid white line. A dashed white line outlines the tail bud in the Shh in situ. b Quantification of the area of staining relative to total tail bud area. For each probe, stage, and genotype n = 3 with the exception of Fgf8 (n = 4 for each genotype) and T (n = 4 for E9.5 Rpl10a LOF/LOF). Data are shown as mean +/− SEM, Student’s t test P values: 0.04 (T E9.5), 0.03 (T E10.5), 0.09 (Msgn1 E9.5), 0.045 (Msgn1 E10.5), 0.005 (Tbx6 E9.5), 0.049 (Tbx6 E10.5), 0.40 (Fgf8 E9.5). c Quantification of the distance between the end of the notochord, as demarcated by Shh in situ, and the tip of the tail bud (n = 3). Distances were normalized to the distance between limb buds and otic placode in each embryo to account for any differences in embryo size. Data are shown as mean +/− SEM, and significance was calculated using Student’s t tests (P value = 0.04). d Whole-mount in situ hybridizations for Uncx4.1 in control and Rpl10a LOF/LOF embryos at E9.5, lateral view (top), and view of the posterior end of the embryo (bottom). The dashed white line demarcates the region of expression; black arrows indicate abnormalities in somite boundaries and spacing. *P value < 0.05; **P value < 0.01. Source data are provided as a Source Data file.
Fig. 6
Fig. 6. Rpl10aLOF/LOF embryos exhibit reduced translation of Wnt signaling components.
a (Left) Polysome traces of wild-type, Rpl10a LOF/+, and Rpl10a LOF/LOF whole E13.5 embryo extracts show similar distributions of polysomes, monosomes, and free subunits. (Right) Western blots of protein precipitated from each sucrose-gradient fraction show the extended RPL10A/uL1 protein is incorporated into polysomes equivalently to wild-type. b (Left) Fluorescence image of E9.5 Meox1 Cre; Ai9 embryo illustrating the presomitic/somitic mesoderm tdTomato reporter expression. (Right) OP-Puromycin incorporation rates in Meox1 Cre; Ai9; Rpl10a LOF/LOF E9.5 presomitic/somitic mesoderm (tdTom+) and in the rest of the embryo (tdTom−) (n = 3). Values are normalized to OP-Puro incorporation rates of TdTom+ and TdTom– cells of Meox1 Cre; Ai9; Rpl10a LOF/+ E9.5 control littermates. Data shown are mean +/− SEM, and significance was calculated using Student’s t test. c Comparison of RNA-seq and ribosome profiling for whole E8.5 Rpl10a LOF/LOF and wild-type embryos (n = 3 each). Genes changing significantly (false discovery rate (FDR) < 0.1) only in mRNA abundance are blue; genes changing significantly (FDR < 0.1) only in ribosome occupancy are red; genes changing significantly in both datasets are purple. d Selected Wnt signaling gene sets that were significantly (FDR < 0.1) enriched in CAMERA gene set enrichment analysis of genes with altered translation efficiency in Rpl10a LOF/LOF embryos compared to wild-type. All gene sets shown are translationally downregulated. Node size = gene set size; edge size = gene set overlap. e Genes from the “Wnt signaling pathway, planar cell polarity pathway” set with statistically significant changes in ribosome-protected footprints (RPF) but not in total RNA-Seq (RNA). f E9.5 wild-type (n = 2) and Rpl10a LOF/LOF (n = 4) gradient RT-qPCR for Vangl2 showing the fraction of the total mRNA found in each of the five fractions of the 25–50% sucrose gradient demarcated in the schematic. Data shown are mean +/− SEM. Vangl2 is significantly decreased in Rpl10a LOF/LOF medium and heavy polysomes relative to wild-type (Student’s t test P values = 0.04 and 0.008, respectively). *P value < 0.05; **P value < 0.01. Source data are provided as a Source Data file.
Fig. 7
Fig. 7. Wnt pathway mRNAs are enriched on RPL10A/uL1-containing ribosomes.
a Schematic of 3xFLAG-RPL10A/uL1 and RPL22/eL22-3xFLAG ribosome immunoprecipitation from in vitro differentiated sclerotome and measurements of association with target mRNAs by RT-qPCR. b Genes identified as differentially translated in Rpl10a LOF/LOF embryos showed increased association with RPL10A-uL1-containing ribosomes compared to control transcripts that were unchanged in the ribosome profiling. Data shown are mean +/− SEM. Student’s t test P values: 0.05 (Gapdh), 0.11 (Foxc2), 0.07 (Meox1), 0.08 (Smad4), 0.06 (Tgfbr1), 0.005 (Dhcr24), 0.002 (Fgfr1), 0.007 (Vangl2), 0.12 (Fzd3), 0.003 (Sfrp2), 0.02 (Rac1). *P value < 0.05; **P value < 0.01. Source data are provided as a Source Data file.
Fig. 8
Fig. 8. Rpl10aLOF/LOF embryos have reduced canonical Wnt signaling.
a Whole-embryo X-gal staining of Axin2 LacZ/+; Rpl10a +/+ and Axin2 LacZ/+; Rpl10a LOF/LOF embryos. Decreased staining in Axin2 LacZ/+; Rpl10a LOF/LOF tail buds is indicated with red arrows; decreased staining in Axin2 LacZ/+; Rpl10a LOF/LOF neural tube is indicated with an orange arrow. b Quantification of the area of X-gal staining in tail bud relative to overall tail bud area. E8.5 and E9 n = 2 each, E9.5 n = 4, E10.5 n = 3 for Rpl10a LOF/LOF and n = 6 for control. Data are shown as mean +/− SEM. Student’s t test P values: 0.9 (E8.5), 0.03 (E9), 0.006 (E9.5), 0.03 (E10.5). c Quantification of the area of X-gal staining in the neural tube relative to overall neural tube area in E10.5 embryos (n = 3 for Rpl10a LOF/LOF and n = 6 for control). Data are shown as mean +/− SEM and significance was calculated using Student’s t tests (P = 0.005). d Abundance of Axin2 mRNA relative to Nupl1 control transcript as measured by RT-qPCR in in vitro differentiated paraxial mesoderm derived from heterozygous and homozygous Rpl10a LOF/LOF hESCs (n = 3 each). Data are shown as mean +/− SEM, and significance was calculated using Student’s t tests (P = 0.03). *P value < 0.05; **P value < 0.01. Source data are provided as a Source Data file.
Fig. 9
Fig. 9. Rpl10aLOF/LOF embryos have reduced noncanonical Wnt/planar cell polarity signaling.
a Lateral views of E12.5 wild-type, Rpl10a LOF/+, Vangl2 Lp/+, and Rpl10a LOF/+; Vangl2 Lp/+ embryos and graph of looped tail phenotype frequencies for each genotype. The Rpl10a LOF/+; Vangl2 Lp/+ embryo shown has the looped tail phenotype (arrow). The increased frequency in Rpl10a LOF/+; Vangl2 Lp/+ embryos is statistically significant (P = 0.02, Fisher’s exact test). b Schematic of basal foot polarization in the multiciliated cells of the trachea epithelium. Basal feet point in the proximal direction (toward the larynx) in wild-type embryos and are less uniformly oriented when PCP signaling is perturbed. c Transmission electron microscopy of wild-type and Rpl10a LOF/LOF E18.5 trachea with basal bodies with visible basal feet demarcated with red arrowheads. Basal feet orientation relative to proximal–distal axis of the trachea, with the oral direction set to 0°, are shown in rose plots with wild-type n = 151 and Rpl10a LOF/LOF n = 127. The circular grid lines represent frequencies, and the difference in distribution between wild-type and Rpl10a LOF/LOF is statistically significant (Watson’s U2 test P value < 0.001). *P value < 0.05; **P value < 0.01. Source data are provided as a Source Data file.

Similar articles

Cited by

References

    1. Buszczak M, Signer RaJ, Morrison SJ. Cellular differences in protein synthesis regulate tissue homeostasis. Cell. 2014;159:242–251. doi: 10.1016/j.cell.2014.09.016. - DOI - PMC - PubMed
    1. Signer RAJ, Magee JA, Salic A, Morrison SJ. Haematopoietic stem cells require a highly regulated protein synthesis rate. Nature. 2014;509:49–54. doi: 10.1038/nature13035. - DOI - PMC - PubMed
    1. Genuth NR, Barna M. The discovery of ribosome heterogeneity and its implications for gene regulation and organismal life. Mol. Cell. 2018;71:364–374. doi: 10.1016/j.molcel.2018.07.018. - DOI - PMC - PubMed
    1. Genuth NR, Barna M. Heterogeneity and specialized functions of translation machinery: From genes to organisms. Nat. Rev. Genet. 2018;19:431–452. doi: 10.1038/s41576-018-0008-z. - DOI - PMC - PubMed
    1. Danilova N, Gazda HT. Ribosomopathies: how a common root can cause a tree of pathologies. Dis. Model. Mech. 2015;8:1013–1026. doi: 10.1242/dmm.020529. - DOI - PMC - PubMed

Publication types