Potential screening indicators for early diagnosis of NAFLD/MAFLD and liver fibrosis: Triglyceride glucose index-related parameters
- PMID: 36120429
- PMCID: PMC9478620
- DOI: 10.3389/fendo.2022.951689
Potential screening indicators for early diagnosis of NAFLD/MAFLD and liver fibrosis: Triglyceride glucose index-related parameters
Abstract
Importance: Homeostatic model assessment for insulin resistance (HOMA-IR) and triglyceride glucose (TyG) index-related parameters [TyG index, triglyceride glucose-waist circumference (TyG-WC), triglyceride glucose-waist-to-height ratio (TyG-WHtR), and triglyceride glucose-body mass index (TyG-BMI)] are gradually considered as convenient and alternative indicators for insulin resistance in various metabolic diseases, but the specific diagnostic capacity and the comparison of the parameters in non-alcoholic fatty liver disease (NAFLD), metabolic-associated fatty liver disease (MAFLD), and liver fibrosis remain uncertain.
Objective: To comprehensively assess and compare the diagnostic accuracy of the above parameters in NAFLD, MAFLD, and liver fibrosis and identify the appropriate indicators.
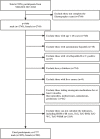
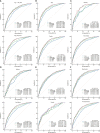
Methods: A total of 1,727 adults were enrolled from the 2017-2018 National Health and Nutrition Examination Surveys. Logistic regressions were used to identify the parameters significantly associated with NAFLD, MAFLD, and liver fibrosis; receiver operating characteristic (ROC) curves were used to evaluate and compare their diagnostic capacity. Subgroup analyses were conducted to validate the concordance, and the optimal cutoff values were determined according to the Youden's indexes.
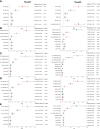
Results: Significant differences were observed between quartile-stratified HOMA-IR and TyG index-related parameters across the NAFLD, MAFLD, and liver fibrosis (P < 0.05). All variables were significantly predictive of different disease states (P < 0.05). The top three AUC values are TyG-WC, TyG-WHtR, and TyG-BMI with AUCs of 0.815, 0.809, and 0.804 in NAFLD. The optimal cutoff values were 822.34, 4.94, and 237.77, respectively. Similar values and the same trend of the above three indexes could be observed in MAFLD and liver fibrosis. Subgroup analyses showed consistent results with the primary research, despite some heterogeneity.
Conclusions: TyG-WC, TyG-WHtR, and TyG-BMI can be used for early screening of NAFLD and MAFLD. These three parameters and HOMA-IR were more suitable for assessing metabolic risks and monitoring disease progression in patients with NAFLD.
Keywords: MAFLD; NAFLD; NHANES; ROC curves; TyG index–related parameters.
Copyright © 2022 Xue, Xu, Li and Gao.
Conflict of interest statement
The authors declare that the research was conducted in the absence of any commercial or financial relationships that could be construed as a potential conflict of interest.
Figures


Similar articles
-
Triglyceride Glucose Index and Related Parameters (Triglyceride Glucose-Body Mass Index and Triglyceride Glucose-Waist Circumference) Identify Nonalcoholic Fatty Liver and Liver Fibrosis in Individuals with Overweight/Obesity.Metab Syndr Relat Disord. 2021 Apr;19(3):167-173. doi: 10.1089/met.2020.0109. Epub 2020 Dec 1. Metab Syndr Relat Disord. 2021. PMID: 33259744
-
Prediction of MAFLD and NAFLD using different screening indexes: A cross-sectional study in U.S. adults.Front Endocrinol (Lausanne). 2023 Jan 19;14:1083032. doi: 10.3389/fendo.2023.1083032. eCollection 2023. Front Endocrinol (Lausanne). 2023. PMID: 36742412 Free PMC article.
-
Insulin Resistance/Sensitivity Measures as Screening Indicators of Metabolic-Associated Fatty Liver Disease and Liver Fibrosis.Dig Dis Sci. 2024 Apr;69(4):1430-1443. doi: 10.1007/s10620-024-08309-9. Epub 2024 Mar 4. Dig Dis Sci. 2024. PMID: 38438774
-
The Diagnostic and Prognostic Value of the Triglyceride-Glucose Index in Metabolic Dysfunction-Associated Fatty Liver Disease (MAFLD): A Systematic Review and Meta-Analysis.Nutrients. 2022 Nov 23;14(23):4969. doi: 10.3390/nu14234969. Nutrients. 2022. PMID: 36500999 Free PMC article. Review.
-
Understanding Insulin Resistance in NAFLD: A Systematic Review and Meta-Analysis Focused on HOMA-IR in South Asians.Cureus. 2024 Oct 3;16(10):e70768. doi: 10.7759/cureus.70768. eCollection 2024 Oct. Cureus. 2024. PMID: 39364176 Free PMC article. Review.
Cited by
-
Relationship between changes in the triglyceride glucose-body mass index and frail development trajectory and incidence in middle-aged and elderly individuals: a national cohort study.Cardiovasc Diabetol. 2024 Aug 16;23(1):304. doi: 10.1186/s12933-024-02373-1. Cardiovasc Diabetol. 2024. PMID: 39152445 Free PMC article.
-
Diagnostic value of triglyceride-glucose index and related parameters in metabolism-associated fatty liver disease in a Chinese population: a cross-sectional study.BMJ Open. 2023 Sep 29;13(9):e075413. doi: 10.1136/bmjopen-2023-075413. BMJ Open. 2023. PMID: 37775293 Free PMC article.
-
The nonlinear relationship between triglyceride glucose-waist circumference and stroke risk in middle-aged and elderly people: a nationwide prospective cohort study of the CHARLS.Lipids Health Dis. 2024 Aug 22;23(1):264. doi: 10.1186/s12944-024-02259-x. Lipids Health Dis. 2024. PMID: 39174982 Free PMC article.
-
Association between nonalcoholic fatty liver disease and increased glucose-to-albumin ratio in adults without diabetes.Front Endocrinol (Lausanne). 2024 Jan 8;14:1287916. doi: 10.3389/fendo.2023.1287916. eCollection 2023. Front Endocrinol (Lausanne). 2024. PMID: 38264288 Free PMC article.
-
Association between triglyceride glucose-body mass index and all-cause mortality in critically ill patients with acute myocardial infarction: retrospective analysis of the MIMIC-IV database.Front Nutr. 2024 Jun 18;11:1399969. doi: 10.3389/fnut.2024.1399969. eCollection 2024. Front Nutr. 2024. PMID: 38962445 Free PMC article.
References
-
- Younossi Z, Anstee QM, Marietti M, Hardy T, Henry L, Eslam M, et al. . Global burden of nafld and nash: trends, predictions, risk factors and prevention. Nat Rev Gastroenterol Hepatol (2018) 15(1):11–20. - PubMed
-
- Eslam M, Newsome PN, Sarin SK, Anstee QM, Targher G, Romero-Gomez M, et al. . A new definition for metabolic dysfunction-associated fatty liver disease: an international expert consensus statement. J Hepatol (2020) 73(1):202–9. - PubMed
-
- Loomba R, Friedman SL, Shulman GI. Mechanisms and disease consequences of nonalcoholic fatty liver disease. Cell (2021) 184(10):2537–64. - PubMed
-
- Eslam M, Sanyal AJ, George J. Toward more accurate nomenclature for fatty liver diseases. Gastroenterology (2019) 157(3):590–3. - PubMed
Publication types
MeSH terms
Substances
LinkOut - more resources
Full Text Sources
Medical

