Myricitrin inhibits fibroblast-like synoviocyte-mediated rheumatoid synovial inflammation and joint destruction by targeting AIM2
- PMID: 36120327
- PMCID: PMC9471193
- DOI: 10.3389/fphar.2022.905376
Myricitrin inhibits fibroblast-like synoviocyte-mediated rheumatoid synovial inflammation and joint destruction by targeting AIM2
Abstract
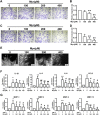
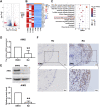
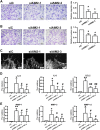
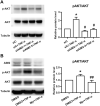
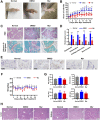
Objective: To explore the effect and underlying mechanism of Myricitrin (Myr) in regulating fibroblast-like synoviocyte (FLS)-mediated synovitis and joint destruction in RA. Methods: FLSs were isolated from synovial tissues from patients with RA. Gene expression was measured using quantitative RT-qPCR. Protein expression was detected by immunohistochemistry or Western blot. Cell apoptosis was performed by an Annexin-PI staining assay. EdU incorporation was used to assess the proliferation of RA FLS. Transwell assay was used to characterize the cell migration and invasion ability of RA FLS. The potential target of Myr was identified by RNA sequencing analysis. The in vivo effect of Myr was assessed in a collagen-induced arthritis (CIA) model. Results: Myr treatment inhibited the lamellipodia formation, migration, and invasion, but not the apoptosis and proliferation, of RA FLSs. Myr also reduced the expression of CCL2, IL-6, IL-8, MMP-1, MMP-3, and MMP-13 induced by TNF-α. The RNA-seq results indicated that AIM2 may be a target gene of Myr in RA FLSs. Furthermore, compared to healthy controls, AIM2 expression showed higher levels in synovial tissues and FLSs from RA patients. AIM2 knockdown also inhibited RA FLS migration, invasion, cytokine, and MMP expression. In addition, either Myr treatment or AIM2 knockdown reduced the phosphorylation of AKT induced by TNF-α stimulation. Importantly, Myr administration relieved arthritis symptoms and inhibited AIM2 expression in the synovium of CIA mice. Conclusion: Our results indicate that Myr exerts an anti-inflammatory and anti-invasion effect in RA FLSs and provide evidence of the therapeutic potential of Myr for RA.
Keywords: AIM2; aggression; fibroblast-like synoviocytes; inflammation; myricitrin; rheumatoid arthritis.
Copyright © 2022 Shen, Xu, Xu, Zhang, Lin, Li, Zeng, Qiu, Liang, Xiao and Xu.
Conflict of interest statement
The authors declare that the research was conducted in the absence of any commercial or financial relationships that could be construed as a potential conflict of interest.
Figures

Similar articles
-
Nitidine chloride inhibits fibroblast like synoviocytes-mediated rheumatoid synovial inflammation and joint destruction by targeting KCNH1.Int Immunopharmacol. 2021 Dec;101(Pt A):108273. doi: 10.1016/j.intimp.2021.108273. Epub 2021 Oct 29. Int Immunopharmacol. 2021. PMID: 34700130
-
Schisandrin treatment suppresses the proliferation, migration, invasion, and inflammatory responses of fibroblast-like synoviocytes from rheumatoid arthritis patients and attenuates synovial inflammation and joint destruction in CIA mice.Int Immunopharmacol. 2023 Sep;122:110502. doi: 10.1016/j.intimp.2023.110502. Epub 2023 Jun 28. Int Immunopharmacol. 2023. PMID: 37390648
-
Coptisine inhibits aggressive and proliferative actions of fibroblast like synoviocytes and exerts a therapeutic potential for rheumatoid arthritis.Int Immunopharmacol. 2024 Feb 15;128:111433. doi: 10.1016/j.intimp.2023.111433. Epub 2024 Jan 4. Int Immunopharmacol. 2024. PMID: 38181676
-
A novel function of artesunate on inhibiting migration and invasion of fibroblast-like synoviocytes from rheumatoid arthritis patients.Arthritis Res Ther. 2019 Jun 24;21(1):153. doi: 10.1186/s13075-019-1935-6. Arthritis Res Ther. 2019. PMID: 31234900 Free PMC article.
-
Absent in melanoma 2 (AIM2) in rheumatoid arthritis: novel molecular insights and implications.Cell Mol Biol Lett. 2022 Dec 7;27(1):108. doi: 10.1186/s11658-022-00402-z. Cell Mol Biol Lett. 2022. PMID: 36476420 Free PMC article. Review.
Cited by
-
Cytoplasmic DNA and AIM2 inflammasome in RA: where they come from and where they go?Front Immunol. 2024 Oct 10;15:1343325. doi: 10.3389/fimmu.2024.1343325. eCollection 2024. Front Immunol. 2024. PMID: 39450183 Free PMC article. Review.
-
The regulation of self-tolerance and the role of inflammasome molecules.Front Immunol. 2023 Apr 4;14:1154552. doi: 10.3389/fimmu.2023.1154552. eCollection 2023. Front Immunol. 2023. PMID: 37081890 Free PMC article. Review.
-
Myricetin reduces neutrophil extracellular trap release in a rat model of rheumatoid arthritis, which is associated with a decrease in disease severity.Innate Immun. 2024 Feb;30(2-4):66-78. doi: 10.1177/17534259241255439. Epub 2024 May 23. Innate Immun. 2024. PMID: 38780369 Free PMC article.
References
LinkOut - more resources
Full Text Sources
Research Materials
Miscellaneous

