

An automatic fluorescence phenotyping platform to evaluate dynamic infection process of Tobacco mosaic virus-green fluorescent protein in tobacco leaves
- PMID: 36119566
- PMCID: PMC9478445
- DOI: 10.3389/fpls.2022.968855
An automatic fluorescence phenotyping platform to evaluate dynamic infection process of Tobacco mosaic virus-green fluorescent protein in tobacco leaves
Abstract
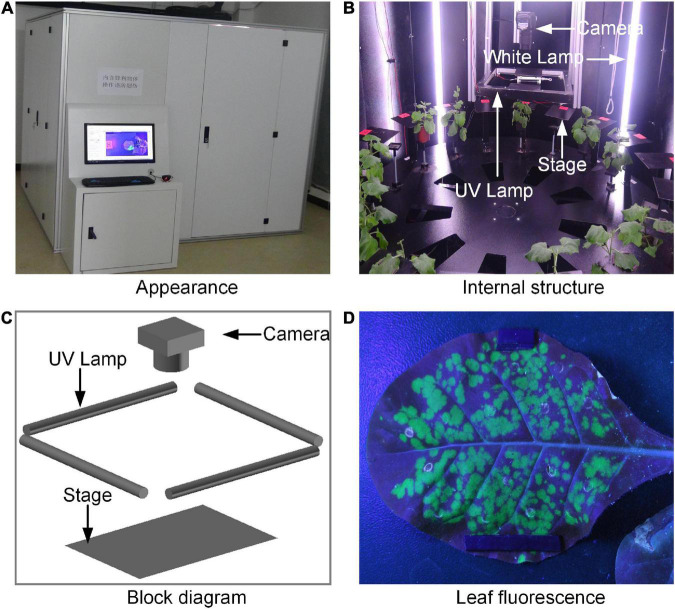
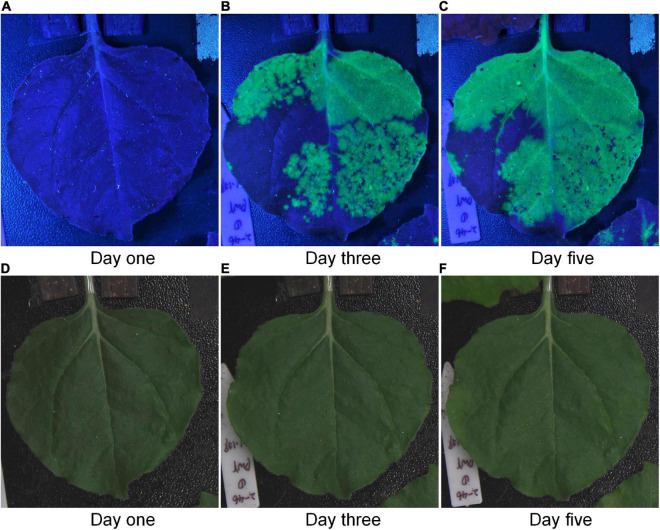
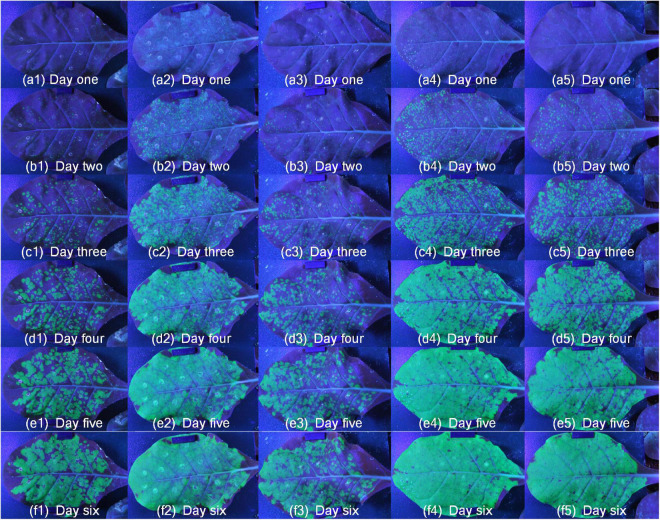
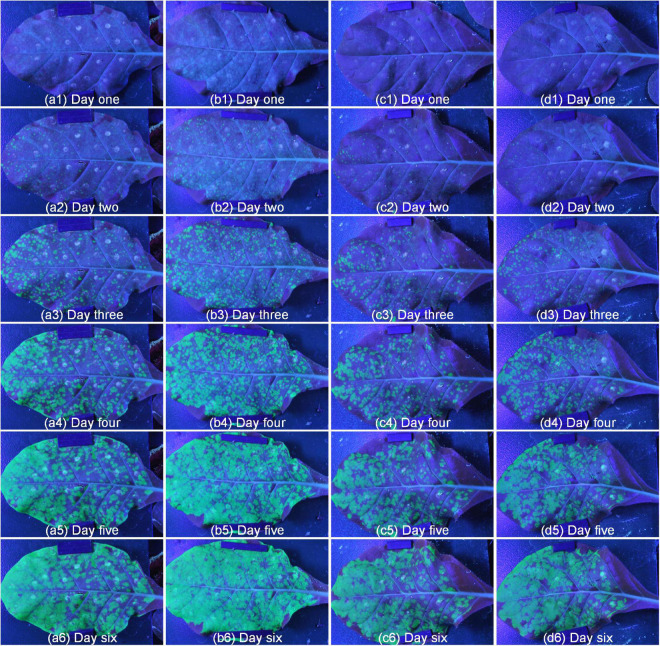
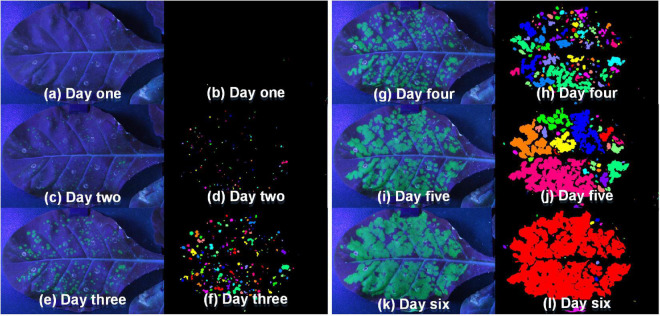
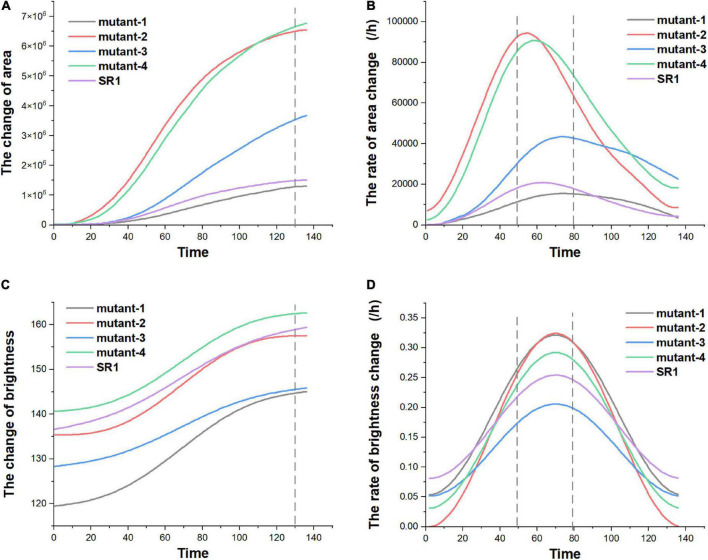
Tobacco is one of the important economic crops all over the world. Tobacco mosaic virus (TMV) seriously affects the yield and quality of tobacco leaves. The expression of TMV in tobacco leaves can be analyzed by detecting green fluorescence-related traits after inoculation with the infectious clone of TMV-GFP (Tobacco mosaic virus - green fluorescent protein). However, traditional methods for detecting TMV-GFP are time-consuming and laborious, and mostly require a lot of manual procedures. In this study, we develop a low-cost machine-vision-based phenotyping platform for the automatic evaluation of fluorescence-related traits in tobacco leaf based on digital camera and image processing. A dynamic monitoring experiment lasting 7 days was conducted to evaluate the efficiency of this platform using Nicotiana tabacum L. with a total of 14 samples, including the wild-type strain SR1 and 4 mutant lines generated by RNA interference technology. As a result, we found that green fluorescence area and brightness generally showed an increasing trend over time, and the trends were different among these SR1 and 4 mutant lines samples, where the maximum and minimum of green fluorescence area and brightness were mutant-4 and mutant-1 respectively. In conclusion, the platform can full-automatically extract fluorescence-related traits with the advantage of low-cost and high accuracy, which could be used in detecting dynamic changes of TMV-GFP in tobacco leaves.
Keywords: digital camera; green fluorescence; image processing; phenotyping platform; tobacco.
Copyright © 2022 Ye, Song, Gao, Lu, Pei, Li, Feng and Yang.
Conflict of interest statement
The authors declare that the research was conducted in the absence of any commercial or financial relationships that could be construed as a potential conflict of interest.
Figures
Similar articles
-
Complete nucleotide sequence and synthesis of infectious in vitro transcripts from a full-length cDNA clone of a rakkyo strain of tobacco mosaic virus.Arch Virol. 1996;141(5):885-900. doi: 10.1007/BF01718163. Arch Virol. 1996. PMID: 8678834
-
The Use of a Tobacco mosaic virus-Based Expression Vector System in Chrysanthemum.Plant Pathol J. 2017 Aug;33(4):429-433. doi: 10.5423/PPJ.NT.04.2017.0083. Epub 2017 Aug 1. Plant Pathol J. 2017. PMID: 28811760 Free PMC article.
-
Characterization of mutant tobacco mosaic virus coat protein that interferes with virus cell-to-cell movement.Proc Natl Acad Sci U S A. 2002 Mar 19;99(6):3645-50. doi: 10.1073/pnas.062041499. Epub 2002 Mar 12. Proc Natl Acad Sci U S A. 2002. PMID: 11891326 Free PMC article.
-
The Tobacco mosaic virus 126-kDa protein associated with virus replication and movement suppresses RNA silencing.Mol Plant Microbe Interact. 2004 Jun;17(6):583-92. doi: 10.1094/MPMI.2004.17.6.583. Mol Plant Microbe Interact. 2004. PMID: 15195941
-
Response of Membrane-bound Mg-activated ATPase of Tobacco Leaves to Tobacco Mosaic Virus.Plant Physiol. 1978 Nov;62(5):731-4. doi: 10.1104/pp.62.5.731. Plant Physiol. 1978. PMID: 16660595 Free PMC article.
Cited by
-
TOM1 family conservation within the plant kingdom for tobacco mosaic virus accumulation.Mol Plant Pathol. 2023 Nov;24(11):1385-1399. doi: 10.1111/mpp.13375. Epub 2023 Jul 13. Mol Plant Pathol. 2023. PMID: 37443447 Free PMC article.
References
-
- Bhagwat R., Dandawate Y. (2021). A Review on Advances in Automated Plant Disease Detection. Int. J. Eng. Technol. Innov 11 251–264. 10.46604/ijeti.2021.8244 - DOI
LinkOut - more resources
Full Text Sources
Research Materials