Determination of a prediction model for therapeutic response and prognosis based on chemokine signaling-related genes in stage I-III lung squamous cell carcinoma
- PMID: 36118890
- PMCID: PMC9470854
- DOI: 10.3389/fgene.2022.921837
Determination of a prediction model for therapeutic response and prognosis based on chemokine signaling-related genes in stage I-III lung squamous cell carcinoma
Abstract
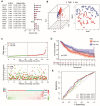
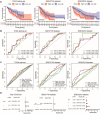
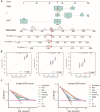
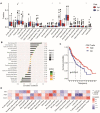
Background: The chemokine signaling pathway plays an essential role in the development, progression, and immune surveillance of lung squamous cell carcinoma (LUSC). Our study aimed to systematically analyze chemokine signaling-related genes (CSRGs) in LUSC patients with stage I-III disease and develop a prediction model to predict the prognosis and therapeutic response. Methods: A total of 610 LUSC patients with stage I-III disease from three independent cohorts were included in our study. Least absolute shrinkage and selection operator (LASSO) and stepwise multivariate Cox regression analyses were used to develop a CSRG-related signature. GSVA and GSEA were performed to identify potential biological pathways. The ESTIMATE algorithm, ssGSEA method, and CIBERSORT analyses were applied to explore the correlation between the CSRG signature and the tumor immune microenvironment. The TCIA database and pRRophetic algorithm were utilized to predict responses to immunochemotherapy and targeted therapy. Results: A signature based on three CSRGs (CCL15, CXCL7, and VAV2) was developed in the TCGA training set and validated in the TCGA testing set and GEO external validation sets. A Kaplan-Meier survival analysis revealed that patients in the high-risk group had significantly shorter survival than those in the low-risk group. A nomogram combined with clinical parameters was established for clinical OS prediction. The calibration and DCA curves confirmed that the prognostic nomogram had good discrimination and accuracy. An immune cell landscape analysis demonstrated that immune score and immune-related functions were abundant in the high-risk group. Interestingly, the proportion of CD8 T-cells was higher in the low-risk group than in the high-risk group. Immunotherapy response prediction indicated that patients in the high-risk group had a better response to CTLA-4 inhibitors. We also found that patients in the low-risk group were more sensitive to first-line chemotherapeutic treatment and EGFR tyrosine kinase inhibitors. In addition, the expression of genes in the CSRG signature was validated by qRT‒PCR in clinical tumor specimens. Conclusion: In the present study, we developed a CSRG-related signature that could predict the prognosis and sensitivity to immunochemotherapy and targeted therapy in LUSC patients with stage I-III disease. Our study provides an insight into the multifaceted role of the chemokine signaling pathway in LUSC and may help clinicians implement optimal individualized treatment for patients.
Keywords: chemokine signaling-related genes; lung squamous cell carcinoma; prognosis; signature; therapy sensitivity.
Copyright © 2022 Lai, Yang, Chu, Xu and Huang.
Conflict of interest statement
The authors declare that the research was conducted in the absence of any commercial or financial relationships that could be construed as a potential conflict of interest.
Figures


Similar articles
-
Risk stratification and prognosis prediction based on inflammation-related gene signature in lung squamous carcinoma.Cancer Med. 2023 Feb;12(4):4968-4980. doi: 10.1002/cam4.5190. Epub 2022 Sep 3. Cancer Med. 2023. PMID: 36056909 Free PMC article.
-
Identification and Validation of a Four-Gene Ferroptosis Signature for Predicting Overall Survival of Lung Squamous Cell Carcinoma.Front Oncol. 2022 Jul 7;12:933925. doi: 10.3389/fonc.2022.933925. eCollection 2022. Front Oncol. 2022. PMID: 35912252 Free PMC article.
-
Identification of an Innate Immune-Related Prognostic Signature in Early-Stage Lung Squamous Cell Carcinoma.Int J Gen Med. 2021 Nov 30;14:9007-9022. doi: 10.2147/IJGM.S341175. eCollection 2021. Int J Gen Med. 2021. PMID: 34876838 Free PMC article.
-
DNA damage repair gene signature model for predicting prognosis and chemotherapy outcomes in lung squamous cell carcinoma.BMC Cancer. 2022 Aug 8;22(1):866. doi: 10.1186/s12885-022-09954-x. BMC Cancer. 2022. PMID: 35941578 Free PMC article.
-
The genomic landscape of the immune system in lung cancer: present insights and continuing investigations.Front Genet. 2024 Jun 25;15:1414487. doi: 10.3389/fgene.2024.1414487. eCollection 2024. Front Genet. 2024. PMID: 38983267 Free PMC article. Review.
Cited by
-
Prognostic value of circulating proteins at diagnosis among patients with lung cancer: a comprehensive analysis by smoking status.Transl Lung Cancer Res. 2024 Sep 30;13(9):2326-2339. doi: 10.21037/tlcr-24-242. Epub 2024 Sep 27. Transl Lung Cancer Res. 2024. PMID: 39430322 Free PMC article.
-
Characterization of stemness features and construction of a stemness subtype classifier to predict survival and treatment responses in lung squamous cell carcinoma.BMC Cancer. 2023 Jun 8;23(1):525. doi: 10.1186/s12885-023-10918-y. BMC Cancer. 2023. PMID: 37291533 Free PMC article.
-
A novel 7-chemokine-genes predictive signature for prognosis and therapeutic response in renal clear cell carcinoma.Front Pharmacol. 2023 Mar 20;14:1120562. doi: 10.3389/fphar.2023.1120562. eCollection 2023. Front Pharmacol. 2023. PMID: 37021054 Free PMC article.
-
Prediction of Tumor Microenvironment Characteristics and Treatment Response in Lung Squamous Cell Carcinoma by Pseudogene OR7E47P-related Immune Genes.Curr Med Sci. 2023 Dec;43(6):1133-1150. doi: 10.1007/s11596-023-2798-2. Epub 2023 Nov 28. Curr Med Sci. 2023. PMID: 38015361
References
-
- Ashburner M., Ball C. A., Blake J. A., Botstein D., Butler H., Cherry J. M., et al. (2000). Gene ontology: Tool for the unification of biology. The gene Ontology consortium. Nat. Genet. 25 (1), 25–29. Epub 2000/05/10PubMed PMID: 10802651; PubMed Central PMCID: PMCPMC3037419. 10.1038/75556 - DOI - PMC - PubMed
-
- Bodelon C., Polley M. Y., Kemp T. J., Pesatori A. C., McShane L. M., Caporaso N. E., et al. (2013). Circulating levels of immune and inflammatory markers and long versus short survival in early-stage lung cancer. Ann. Oncol. 24 (8), 2073–2079. Epub 2013/05/18PubMed PMID: 23680692; PubMed Central PMCID: PMCPMC3718510. 10.1093/annonc/mdt175 - DOI - PMC - PubMed
-
- Botling J., Edlund K., Lohr M., Hellwig B., Holmberg L., Lambe M., et al. (2013). Biomarker discovery in non-small cell lung cancer: Integrating gene expression profiling, meta-analysis, and tissue microarray validation. Clin. Cancer Res. 19 (1), 194–204. Epub 2012/10/04PubMed PMID: 23032747. 10.1158/1078-0432.ccr-12-1139 - DOI - PubMed
LinkOut - more resources
Full Text Sources
Research Materials
Miscellaneous

