Review
. 2022 Jun-Aug:130-131:62-105.
doi: 10.1016/j.pnmrs.2022.07.001. Epub 2022 Jul 15.

Zinc finger structure determination by NMR: Why zinc fingers can be a handful

Affiliations
Review

Zinc finger structure determination by NMR: Why zinc fingers can be a handful

David Neuhaus. Prog Nucl Magn Reson Spectrosc. 2022 Jun-Aug.

Abstract

Zinc fingers can be loosely defined as protein domains containing one or more tetrahedrally-co-ordinated zinc ions whose role is to stabilise the structure rather than to be involved in enzymatic chemistry; such zinc ions are often referred to as "structural zincs". Although structural zincs can occur in proteins of any size, they assume particular significance for very small protein domains, where they are often essential for maintaining a folded state. Such small structures, that sometimes have only marginal stability, can present particular difficulties in terms of sample preparation, handling and structure determination, and early on they gained a reputation for being resistant to crystallisation. As a result, NMR has played a more prominent role in structural studies of zinc finger proteins than it has for many other types of proteins. This review will present an overview of the particular issues that arise for structure determination of zinc fingers by NMR, and ways in which these may be addressed.

Keywords: Metallothionein; NMR spectroscopy; NMR structure determination; Protein structure; Zinc finger.


Conflict of interest statement

Declaration of Competing Interest The authors declare the following financial interests/personal relationships which may be considered as potential competing interests: I am the Co-ordinating Editor for the journal to which I am submitting. The article will be handled exclusively by other members of the Editorial Board.

Figures

None
Graphical abstract
Fig. 1
Fig. 1
TFIIIA-type (C2H2) zinc finger structures. a) Original schematic proposal of how zinc fingers are organised in the Xenopus laevis transcription factor TFIIIA, reproduced with permission from the original paper of Miller et al. (© 1985 European Molecular Biology Organization). b) NMR structure of zinc finger 31 from the protein Xfin (also from Xenopus), which was the first experimentally determined structure of a zinc finger (PDB 1znf) . c) NMR structure of zinc finger 1 from the yeast transcription factor SWI5 (PDB 1ncs) ; this structure includes an additional N-terminal β-strand and α-helix relative to the canonical TFIIIA-type finger. d) NMR structure of zinc finger 1 from the Xenopus protein Zfa (PDB 1zu1), which in addition to an N-terminal three-stranded β-sheet and α-helix also includes an additional C-terminal helix containing the fourth zinc-binding ligand at its N-terminus . e) X-ray crystal structure of three zinc fingers of the transcription factor Zif268 bound to their cognate DNA sequence (PDB 1zaa) ; this was the first structure to show an example of how zinc fingers recognise specific sequences in DNA (the interactions between protein sidechains and DNA responsible for this recognition are not shown in this figure). Smoothed protein backbone cartoons were produced using the program PyMol , and are shown in “chainbow” colouring (blue → red, N-terminal → C-terminal), zinc ions are shown as grey spheres and all the NMR structures are illustrated using only the lowest energy member of the deposited ensemble in each case.
Fig. 2
Fig. 2
A selection of other types of zinc finger and related structures. The examples shown are chosen to illustrate some of the many different metal-binding topologies that can be found amongst published structures. a) NMR structure of oestrogen receptor DNA-binding domain (ERDBD), one of the first non-canonical zinc finger protein structures to be published (PDB 1hcp) . b) GATA-1 DNA-binding domain. The protein is a chicken erythroid transcription factor that takes its name from the cognate DNA sequence it recognises, and is an early example of the so-called “treble-clef” motif , ; the structure shown is taken from that of the complex with DNA (PDB 1gat) , which was amongst the first protein:DNA complexes to be determined by NMR. c) NMR structure of the plant homeodomain (PHD) zinc finger from human Williams-Beuren syndrome transcription factor (PDB 1f62) . This structure illustrates a so-called “cross-braced” or “interleaved” metal-binding topology found in several types of two-metal finger domains, in which one metal is bound by the 1st, 2nd, 5th and 6th ligands and the other by the 3rd, 4th, 7th and 8th ligands; this contrasts with the “sequential” metal-binding topology seen for ERDBD in panel a). See also Fig. 10 for further examples of this important distinction. d) DNA binding domain of the yeast transcription factor GAL4, showing how a two-metal cluster is formed with six cysteine ligands, two of which (the “bridging” cysteines) are shared between the two metals. The structure shown comes from a crystal structure of the complex of Cd2 GAL4 with DNA (PDB 1d66) ; two NMR structures were also independently determined in the same year (1992) , , but are not present in the PDB database. e) NMR structures of the three- and four-metal clusters from Cd7 rat metallothionein 2 (MT2) (PDB 1mrt and 2mrt) . Metallothioneins are not generally considered to be zinc finger proteins, but are discussed in this review because much of the NMR methodology for using 113Cd substitution to establish metal-binding topology was first developed during studies of metallothioneins (see Section 5.2). f) Intermolecular “Zinc clasp” linking the N-terminal tail of the tyrosine kinase Lck to the cytoplasmic tail of the T-cell co-receptor CD4 (PDB 1q68) ; this zinc-dependent tethering is required during T-lymphocyte development. Smoothed protein backbone cartoons were produced using the program PyMol , and are shown in “chainbow” colouring (blue → red, N-terminal → C-terminal), zinc ions are shown as grey spheres and all the NMR structures are illustrated using only the lowest energy member of the deposited ensemble in each case. In each case, the sequence numbers shown are those in the deposited PDB files, which may not necessarily correspond to the numbering of the full-length native protein. In the case of metallothionein, numbering is omitted from the structures to avoid overcrowding; on the schematic, numbers for bridging cysteines are shown in larger, bold type, and the cadmiums are numbered in order of decreasing 113Cd chemical shift (see Fig. 19a).
Fig. 3
Fig. 3
Solution structures of the proteins Rds3 and Bud31. a) Cartoon representation of the lowest energy structure of the deposited NMR ensemble of Rds3 (PDB 2k0a). b) Metal-binding topology of Rds3; in this structure, the three zinc-binding sites are relatively well spaced apart and are independent (no ligands bridge between zincs). c) Schematic showing how Rds3 is built from three GATA-like zinc fingers (each consisting of a β-hairpin, a zinc knuckle and an α-helix, see inset) fused together. In Rds3, each β-hairpin is broken and replaced by a strand (shown in magenta) running from one finger to the next, and a loop (shown in orange) is added from the α-helix of one finger to the zinc knuckle of the next. The zinc knuckle of finger 3 is “interrupted” by the N- and C- termini of the protein chain. d) Simplest representation of the origin of the topological knot in the structure of Rds3 (shown in the same orientation as in a) and c)). e) Sequence of yeast Rds3; components of the structure are shown above the sequence using the same colour code as in c) (K, zinc knuckle; β, β-hairpin; S, strand; H, helix; L, loop; numbers denote fingers 1, 2 and 3). The colour gradient bar below the structure shows the “chainbow” colouring used in a). f) Cartoon representation of the lowest energy structure of the deposited NMR ensemble of Bud31 (PDB 2my1). g) Metal-binding topology of Bud31, displayed as function of sequence; as discussed in Section 5, zinc was exchanged by 113Cd to help determine this topology. In this structure the three metals form a single cluster bound by nine cysteines, of which three (numbers in bold, connections in black) bridge between two metals. h) Metal-binding topology of Bud31, displayed based on the metal cluster arrangement. Protein backbone cartoons in a) and f) were produced using the program PyMol , and are shown in “chainbow” colouring (blue → red, N-terminal → C-terminal; a few disordered residues at the N- and C- termini are omitted for clarity in each case), zinc or cadmium ions are shown as grey spheres and the NMR structures are illustrated using only the lowest energy member of the deposited ensemble in each case. Panels a), c), d) and e)
Fig. 4
Fig. 4
Examples of multiple sequence alignments for zinc finger proteins. Multiple sequence alignments for the yeast proteins a) Rds3 and b) Bud31; the region inside the dashed box of panel b) is expanded in c). Metal-binding residues, which are all cysteines in both of these examples, are indicated with red arrows beneath, and are absolutely conserved throughout. Other residues that might have appeared to be candidate metal-binding residues, based on inspection of the yeast sequence in isolation, are indicated by smaller cyan arrows above; in each case they may be ruled out by the lack of conservation seen in the alignments (His4 in Rds3 and His57 in Bud31 are considered further in Section 5.1). The alignment shown for Rds3 includes a small selection of very diverse eukaryotic species, while that for Bud31 is restricted to fungi, though a more extensive alignment across eukaryotes (not shown) is also fully consistent with the conclusions regarding metal-binding residues made here. No overall residue numbering scale is shown as each protein has its own distinct native numbering, and as is normal for multiple sequence alignments the sequences are not represented continuously so as to accommodate insertions in a subset of sequences. The alignments were produced in the program ClustalW ; panel a) is adapted with permission from (© 2008 National Academy of Sciences), panels b) and c) are courtesy of Dr. Antonina Andreeva, MRC LMB.
Fig. 5
Fig. 5
Mass spectra used to determine metal content for a zinc finger containing a three-zinc cluster. Mass spectra are shown for the yeast protein Bud31 under denaturing and non-denaturing conditions, to demonstrate the metal content. a) Bud31 under denaturing conditions without metal bound (principal peak 18519.000); b) Zn3 Bud31 measured under non-denaturing conditions (principal peak 18709.801); c)113Cd3 Bud31 measured under non-denaturing conditions (principal peak 18848.9004). The mass difference between the zinc and the cadmium species proves that all three zincs have been cleanly exchanged for cadmium in this instance, with no intermediate species containing both zinc and cadmium present in the final sample. Adapted with permission from (CCBY licence, © 2015 van Roon et al.).
Fig. 6
Fig. 6
pH Dependence of metal binding for a TFIIIA-type zinc finger. The molar fractional distribution of Zn2+ (blue lines) and Co2+ (red dashed lines) complexes of the 11th zinc finger peptide of the human transcription factor ZNF133 as a function of pH; this peptide is referred to as ZF133-11 in the original paper, where the derivation of these curves using ionisation constants measured by a potentiometric titration for a 50 µM solution of the peptide is described . The main point to notice in this plot is that the metal-bound complex (MHL-, see text) becomes unstable at low pH and releases metal ions as the Sγ atoms of the cysteine residues become protonated. Because cobalt binds more weakly than zinc, this process is complete at higher pH values for Co2+ than for Zn2+. See main text for further discussion.
Fig. 7
Fig. 7
Incorporation of zinc ions during structure calculations of zinc fingers. The example shown is of the second zinc finger (residues 109–200) of human PARP-1 (PDB 2 l31), calculated with the program XPLOR-NIH . The atoms that bind the single zinc in this case are Cys125 Sγ, Cys128 Sγ, His159 Nδ1 and Cys162 Sγ, and all distances shown are in Å. a) Backbone cartoon of one randomised starting structure, showing initial values of the inter-ligand distances. b) Structure after first stage of calculation protocol. Only inter-ligand restraints (black dashed lines) have been applied to supplement the NMR-based experimental restraints at this stage and no zinc ion has been included in the calculation. Since these restraints act by adding an energy penalty if the relevant distances violate the restraints (rather than by imposing an absolute limit), some distances can lie slightly outside the restraint ranges. c) A zinc ion is introduced at the geometric average of the four ligand atom positions with covalent binding restraints as listed (the improper restraint acts to keep the zinc in the same plane as the histidine aromatic ring), and then further molecular dynamics acts to relax the structure in the modified force field. d), e) Steps needed to calculate a structure including explicit zinc using torsion angle dynamics. Panel d) shows how connection of the zinc ligands through the protein backbone (schematically shown in red; zinc ion shown at 30 % size for clarity) forms rings within the overall structure of the protein, the presence of which is incompatible with torsion angle dynamics calculations; panel e) shows how this issue is overcome, by “cutting” three of the four bonds to zinc, and replacing their restraining effect on the structure by using distance restraints (black dashed lines). See text for further discussion. f) Ensemble view of the same calculation shown in c). All cartoons were produced using the program PyMol , and are shown in “chainbow” colouring (blue → red, N-terminal → C-terminal) while zinc ions are shown as grey spheres.
Fig. 8
Fig. 8
Chirality of zinc-binding sites. Just as with tetrahedral carbon, tetrahedral zinc sites are chiral and can therefore exist in two enantiomeric forms. Following the convention defined by Berg , the ligands are assigned a priority order running from N-terminal (highest priority, “Lig 1” in the figure) to C-terminal (lowest priority, “Lig 4” in the figure). The chirality is then defined as R (for rectus) if ligands 1, 2 and 3 increase in a clockwise sense when viewed along the bond from Zn towards ligand 4, as shown in a). The opposite arrangement, shown in b), is defined as S (for sinister) and can be reached from R by swapping any two of the ligands, as shown here for swapping 2 and 3. As a real example, for the site shown in Fig. 7b the ligands 1, 2, 3 and 4 correspond to respectively Cys125, Cys128, His159 and Cys162, and the site has an S configuration.
Fig. 9
Fig. 9
Inter-finger interactions as seen by NMR. a) Schematic representation of the distribution of inter-finger orientations within a calculated ensemble of the first two TFIIIA-type zinc fingers in the transcription factor SWI5, showing the steric restriction on the available conformation space sampled by finger 1 when finger 2 is fixed. No inter-finger restraints were applied during these calculations, as no inter-finger NOEs were assigned in the corresponding NOESY spectra. Each of the 30 two-finger structures is represented by two lines, one joining the two zinc ions and the other joining the zinc ion of finger 1 to the tip of finger 1 (Arg 25 Cα). The structures are superposed on the lowest energy structure of finger 2 (using N, Cα and C′ of residues 42 – 66). The dotted lines labelled Z1 and Z2 represent the mutual orientations seen in the crystal structure of Zif268 bound to DNA (Z1 shows the position of Zif268 F1 when Zif268 finger 2 is superposed on SWI5 finger 2, and Z2 shows the position of Zif268 F2 when Zif268 finger 3 is superposed on SWI5 finger 2) Adapted with permission from (© 1992 Elsevier). b) Structural ensemble of the two TFIIIA-type zinc fingers from the protein MBP-1, superposed on either the N-terminal finger (left; residues 2–28) or the C-terminal finger (right; residues 27–55). In this case, the relative orientations of the two fingers were largely, but not completely, constrained by a cluster of 14 long-range NOEs (|i-j| > 4) in roughly the position marked by the red ellipse, linking residues Thr23 or Val27 on finger 1 with residues Phe39, Lys40 or Thr41 on finger 2. Adapted with permission from (© 1992 American Chemical Society). c) Model for the averaged overall alignment of the first three zinc finger domains in TFIIIA itself, derived by analysis of anisotropic rotational tumbling effects present in 15N relaxation data for this system. The ellipsoids (red for F1, blue for F2 and green for F3) superposed on the backbone structures of the fingers represent the rotational diffusion tensors of each finger (see text for further explanation), and characterise their differential mobilities. Overall, the molecule is highly elongated. The ellipsoid on the central finger is the smallest and most anisotropic, reflecting its relatively slow and restricted rotational tumbling, while the largest ellipsoid is that on F3, which has the greatest motional freedom. Adapted with permission from (© 1995 The American Association for the Advancement of Science). d) Structural ensemble (25 lowest energy structures shown from 50 total), e)15N relaxation and RDC data, and f) fitted alignment tensors for a fragment containing both of the PAR-binding zinc finger domains from the protein APLF ordered using Pf1 phage (12 mg/ml). These data show that the two domains do not mutually interact; the axial (Da) and rhombic (Dr) components of the fitted alignment tensors shown in f) show well-defined clusters for each finger that are very distinct from one another (see text for further discussion). Finger 1 is more strongly ordered than is finger 2, as shown both by the larger spread of measured RDC values for finger 1 and correspondingly by the larger magnitudes of the alignment tensor. The 15N{1H} heteronuclear NOE data show that the linker between the fingers is highly mobile. Panels d, e and f adapted with permission from (© 2010 Eustermann et al.). g) Structure of the ADD domain of ATRX protein, which is an example of a single domain containing two zinc fingers of different types fused together. Adapted with permission from (© 2007 National Academy of Sciences).
Fig. 10
Fig. 10
Examples of “sequential” and “cross-braced” metal-binding topologies for zinc finger domains binding two zinc ions. Domains with “sequential” topologies include a) steroid hormone DNA-binding domains, exemplified here by the ERDBD , as well as b) LIM domains, exemplified here by the C-terminal LIM domain of cysteine-rich protein-2 (CRP-2) . Domains with “cross-braced” binding topology include c) RING domains, exemplified here by that from equine herpes virus-1 immediate early gene product (EHV-1) , and d) FYVE domains, exemplified here by that from human EEA1 protein ; other examples of cross-braced topologies include PHD fingers (e.g. , see Fig. 2c) and MYND , domains.
Fig. 11
Fig. 11
Distribution of Cβ chemical shifts for metal-binding, free (reduced, SH) and oxidised (disulfide, S—S) Cys residues. (ad) Histograms and (e) normal distribution curves for 311 cysteine/cystine Cβ shifts grouped into three categories based on three states of the thiol; (a) 102 from reduced non-metal-ligated cysteines, (b) 166 shifts from oxidized cystines, and (c) 43 from Zn- ligated cysteines. Adapted with permission from (© 2006 Springer).
Fig. 12
Fig. 12
Distribution of 13Cδ2 and 13Cε1 chemical shifts for histidines co-ordinating zinc through either Nδ1 or Nε2, compared to free histidine. a) Number of occurrences of each histidine–zinc coordination mode as a function of the chemical shift difference δ(13Cε1) – δ (13Cδ2), plotted in 0.5 ppm intervals. b) Two dimensional plots of 13Cδ2 and 13Cε1 chemical shifts for non-coordinated histidines (small open circles), Nδ1 zinc-coordinated histidines (black diamonds) and Nε2 zinc-coordinated histidines (large open circles). Adapted with permission from [173] (© 2012 Springer Science Business Media BV).
Fig. 13
Fig. 13
Long-range HMQC experiments for distinguishing tautomeric states and zinc-binding sites in histidines. a) Schematic diagram showing the three possible protonation states of histidine rings, and the expected long-range 1H-15N HMQC spectrum of each species. The diagrams were constructed using 15N chemical shift, 2JNH and 3JNH coupling constant data for histidine taken from reference . For the charged species, the spectrum shows the Nδ1 signal slightly downfield of the Nε2 signal, but in practice either nitrogen could resonate downfield of the other, and the relative assignment must be made through comparison of cross-peak intensities. Reproduced with permission from (© 1993 The Protein Society). b) The 500 MHz 1H-15N HMQC spectrum of the ZZ domain of murine CREB-binding protein (CBP) complexed either to zinc (black) or to 113Cd (red). c) Schematic of the connectivities for the two zinc-ligand histidine residues of CBP, His40 and His42, showing how interpretation of the spectrum in b) confirms the identity of the ligand histidine residues and the location of the metal coordination on the histidine ring in each case. Panels c and d reproduced with permission from (© 2004 Elsevier).
Fig. 14
Fig. 14
Ensembles of structures of the yeast protein Rds3 calculated without (a and b) and with (c and d) zinc-binding and inter-ligand restraints. a) and b) Two views (related by a 180° rotation) of the 10 lowest energy structures from an ensemble of 20 calculated with no zinc-ligand or inter-ligand constraints, and no NOE cross-peak assignments in the input data (NOE assignments were made automatically during the calculations, which employed the program ARIA [130]). Smoothed protein backbone cartoons are shown in chainbow colouring from residue Met10 (blue) to residue Leu90 (red), and the cysteines involved in metal binding are coloured white for binding site 1 (Cys23, 26, 58 and 61), light grey for binding site 2 (Cys30, 33, 73 and 76) and dark grey for binding site 3 (Cys11, 46, 49 and 86). The binding sites are most clearly seen in a); panel b) shows that Cys77 (shown in wheat), although sequentially adjacent to binding site 2, projects away from it. Adapted with permission from (© 2008 National Academy of Sciences). Views c) and d) show corresponding views of the ten lowest energy structures from the final ensemble of 100 calculated NMR structures, in which all zinc binding (and inter-ligand) restraints were applied. Disordered tails at the N- and C-termini are omitted for clarity in all views. These views were produced using the program PyMol , and are shown in “chainbow” colouring (blue → red, N-terminal → C-terminal), zinc ions are shown as grey spheres.
Fig. 15
Fig. 15
Results of attempted metal exchange for the yeast protein Rds3. Superposition of [15N,1H] HSQC spectra of zinc-bound Rds3 before (black spectrum) and 1 h after (red spectrum) addition of a fivefold excess of 113Cd EDTA complex. Backbone amide correlations corresponding to the metal-binding cysteines are indicated with blue, green and red ovals for binding sites 1, 2, and 3, respectively. Only for the peaks of binding site 3 are there significant chemical shift changes or disappearances, strongly suggesting that it is undergoing metal exchange whereas binding sites 1 and 2 remain substantially unaffected. Some further assignments for peaks that shift are indicated in black, almost all of which are close in space to binding site 3. At later times, the protein partially precipitated and the spectra became somewhat more complicated and much less intense, rendering the intended application of [113Cd, 1H] correlation experiments essentially impossible. Adapted with permission from (© 2008 National Academy of Sciences).
Fig. 16
Fig. 16
a) Rabbit metallothionein isoform MT1 is a small (6.9 kDa), rapidly tumbling protein that gives mostly narrow lines in its 113Cd NMR spectrum. Homonuclear J-couplings are clearly visible in the majority of the signals, demonstrating the existence of metal clusters. The cluster topologies shown here were established using a series of selective, homonuclear, one-dimensional 113Cd decoupling experiments, and the values (in Hz) of the corresponding J-couplings are indicated (the authors attributed the presence of two sets of 113Cd signals for cluster A to the presence or absence of 113Cd in cluster B). Conditions: ∼8 mM protein in a 10 mm o.d. tube, 10 mM Tris buffer, 100 mM NaCl, pH 9, recorded at 44.4 MHz and 23 °C using 9500 scans and an 8 s recycle time; 113Cd chemical shifts are reported in ppm downfield from external 0.1 M Cd(ClO4)2. b) Schematic structures of the four- and three-metal clusters (A and B) in metallothionein, as proposed by Otvos and Armitage . Panels a and b reproduced with permission from Otvos and Armitage (© 1980 Otvos & Armitage).
Fig. 17
Fig. 17
Examples of directly observed 113Cd spectra of proteins containing metal clusters substituted with 113Cd. a) CXC domain of MSL2. In this small (6.0 kDa), single-domain, three-metal cluster zinc finger, significant differences amongst the lineshapes of the 113Cd signals are clearly visible, and the 113Cd-113Cd J-couplings are well-resolved only for signal Cd-A. Conditions: 0.5–1.5 mM protein in 50 mM potassium phosphate, pH 6.0, recorded at 89.13 MHz and 25 °C; 113Cd chemical shifts are reported in ppm downfield from external 1 M Cd(CH3CO2)2. Reproduced with permission from Zheng et al. (CCBY licence, © 2012 Zheng et al.). b)Mytilus galloprovincialis (sea mussel) metallothionein isoform MT10. This metallothionein has an atypical four-metal cluster topology, missing one bridge relative to canonical metallothioneins . The 113Cd-113Cd COSY spectrum shown here reveals only a subset of the expected 113Cd-113Cd connectivities, presumably at least in part because several of the 113Cd signals (shown right) are very broad. Conditions: 2.8 mM protein, 17 mM Tris buffer, 16 mM DTT, pH 7.0, recorded at 133.7 MHz and 25 °C; the COSY data (phase-insensitive) comprised 2 K × 80 time-domain data points and a spectral width of 400 ppm in each dimension, with 1024 scans per increment and a 2 s recycle delay; 113Cd chemical shifts are reported in ppm downfield from external 0.1 M Cd(ClO4)2 in 2H2O. Reproduced with permission from Digilio et al. (© 2009 SBIC). c) Bud31 one-dimensional 113Cd spectrum. In this protein the three-metal cluster is fused to a four-helix bundle, resulting in an 18.9 kDa protein that gives much broader 113Cd signals than most of those in a) or b), and for which the 113Cd-113Cd J-couplings are unresolved. Conditions: 2.6 mM protein in 2H2O, recorded at 111.0 MHz and 25 °C using 2048 scans and a 1 s recycle time with a cryogenically cooled probe; 113Cd chemical shifts are reported in ppm downfield from external neat CdMe2. d) Bud31 113Cd-113Cd phase-sensitive COSY spectrum (positive contours scaled red to yellow, negative scaled green to blue, phased with cross peaks in double-absorption mode and diagonal peaks in double-dispersion mode). Despite the lack of resolution of the 113Cd-113Cd couplings in the one-dimensional spectrum, all of the expected connectivities were detectable following a long experiment using a spectrometer equipped with a highly sensitive cryogenically cooled probe. Conditions and chemical shift referencing as for d); the COSY data comprised 256 × 64 complex time-domain data points (t1max 9.51 ms, t2max 614.4 ms), with 1024 scans per increment and a 1 s recycle delay resulting in a 59 h total acquisition time. Panels c and d adapted with permission from van Roon et al. (CCBY licence, © 2015 van Roon et al.), where further experimental details may be found in the supplementary material.
Fig. 18
Fig. 18
HMQC-related experiments for identifying 113Cd-1H correlations. a)1H-113Cd HMQC-RELAY pulse sequence. Filled bars represent 90° pulses, open bars 180° pulses, and the delay Δ is tuned for a specific value of J(113Cd,1H); typical values range between about 50 ms (for J = 10 Hz) and 10 ms (for J = 50 Hz). In the original experiments published by Frey et al. , suppression of signals having anti-phase splittings due to (1H,113Cd) couplings was achieved by a phase-alternated 90° 113Cd purge pulse at the start of t2 because on the hardware in use at that time continuous decoupling on the 113Cd channel during acquisition was not available. Some other variations of the pulse sequence, for instance replacing the final 1H 90° pulse by a z-filter, were also described, though these gave less transfer to the Hα protons. The version of the sequence shown here is that used by van Roon et al. ; the phase cycles used were ϕ1 = x; ϕ2 = x, -x; ϕ3 = x, x, -x, -x; ϕ4 = y; receiver = x, -x, -x, x. b) Heteronuclear Spin-Echo Difference (HSED) experiment. This one-dimensional experiment suppresses signals not coupled to the heteronucleus, since only the heteronuclear-coupled proton signals change sign when the two X-nucleus pulses reinforce to form an effective 180° pulse; conceptually, it can be looked on as an HMQC experiment from which the indirect frequency dimension has been collapsed. The experiment was originally published as a method for isolating 13C or 15N satellite signals in natural abundance materials .
Fig. 19
Fig. 19
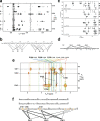
Examples of determining metal-binding topology using 1H-113Cd correlation spectra. a) HMQC-RELAY spectrum (Δ delay 30 ms) of rabbit metallothionein MT2 . Conditions: 10 mM protein in 2H2O, 20 mM Tris buffer, 20 mM KCl, p2H 7.0, recorded at 360 MHz for 1H (80 MHz for 113Cd) and 25 °C; 113Cd chemical shifts are reported in ppm downfield from external 0.1 M 113Cd(ClO4)2. Adapted with permission from Vašak et al. (© 1987 Elsevier). b) Metal binding topology deduced from the combined interpretation of this and other HMQC-RELAY spectra, displayed as a function of the amino-acid sequence, reproduced with permission from Wagner et al. (© 1987 Springer Basel AG). Roman numerals used for numbering the cadmiums in panel b correspond to the Arabic numerals used in panel a. c) HMQC-TOCSY (Δ delay 10 ms, TOCSY mixing period 30 ms) and HSQC spectra tuned for different 113Cd-1H coupling values, recorded for MSL2 CXC domain. The Cys residues at positions 525, 527, 539, 544, 546, 553, 556, 558 and 561 are sequentially numbered from 1 to 9, and cross-peaks to Hα protons in the HMQC-TOCSY spectrum are additionally labelled “a”. Conditions: 0.5–1.5 mM protein in 50 mM potassium phosphate, pH 6.0, recorded at 89.13 MHz and 25 °C; 113Cd chemical shifts are reported in ppm downfield from external 1 M Cd(CH3CO2)2. d) Metal binding topology deduced mainly from the connectivities revealed in spectrum c), displayed as a function of the amino-acid sequence; the connections from Cd-C (the broadest of the cadmium resonances) to Cys 539 and Cys 553 were inferred from preliminary structures calculated without constraints to Cd-C. Panels c) and d) adapted with permission from Zheng et al. (CCBY licence, © 2012 Zheng et al.). e) HMQC-RELAY spectrum (Δ delay 10 ms) of Bud31. Chemical shift assignments for the cysteinyl Hβ (solid lines) and Hα (dashed lines) protons are indicated, using a “chainbow” colouring scheme (blue → red, N-terminal → C-terminal) to aid visualisation. Bridging cysteines can be identified since they should show corresponding correlations at two distinct cadmium shifts, as exemplified by the Hβ signals linked by the black lines for Cys104, Cys108 and Cys122. In practice, however, not all correlations can usually be seen in a single experiment; in this case, only one of the Hβ protons of Cys104 shows correlations to both Cd1 and Cd3, and a combined interpretation using spectra with other fixed delays as well as HMQC-NOESY data was required to complete the determination of metal-binding topology. Conditions: 2.6 mM protein in 2H2O, recorded at 500 MHz for 1H (111.0 MHz for 113Cd) and 25 °C with a cryogenically cooled probe. The data comprised 512 × 16 complex time-domain data points (t1max 3.16 ms, t2max 63.9 ms), with 2048 scans per increment and a 1 s recycle delay resulting in a 22 h total acquisition time; 113Cd chemical shifts are reported in ppm downfield from external neat CdMe2. f) Metal binding topology deduced from the combined interpretation of this and other HMQC-RELAY and HMQC-NOESY spectra, displayed as a function of amino-acid sequence. Bridging cysteines are labelled above the sequence, and their connectivities are shown using bold lines. Panels e) and f) adapted with permission from van Roon et al. (CCBY licence, © 2015 van Roon et al.), where further experimental details may be found in the supplementary material.
Fig. 20
Fig. 20
Metal-binding topologies of metallothionein as determined by solution NMR and by the initial X-ray crystallography study. The connectivities shown in a and b were derived from 113Cd-1H correlation experiments published by Frey et al. , while those shown in c and d are those reported in the originally published crystal structure by Furey et al. . Based on Fig. 5 from reference (© 1987 Springer Basel AG).
Fig. 21
Fig. 21
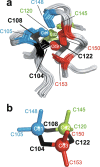
Metal binding cluster of Bud 31. a) Ensemble view showing the backbone of residues 101–110,119–126 and 144–154 in cartoon representation together with cysteine sidechains as sticks and cadmiums as small spheres; the ensemble was superposed over the whole ordered region of the protein (residues 12–36,45–109,118–155). b) Schematic of the metal cluster ring in similar orientation to that shown in a), showing only cadmium ions and cysteinyl Sγ atoms. Colour code is the same as used in Fig. 3g and 3 h.
Fig. 22
Fig. 22
Passive effects of 113Cd-1H couplings seen in phase-sensitive 1H–1H DQF-COSY spectra of rabbit metallothionein MT2. The regions shown here contain the majority of the Hα-Hβ cross-peaks from the 20 cysteine residues (as well as some Asp and Asn residues). Spectrum a) was recorded from 112Cd7 protein, spectrum b) was recorded from 113Cd7 protein, consequently spectrum b) shows additional splittings or broadenings due to 113Cd-1H J-couplings that are absent from spectrum a). The cysteinyl Hα-Hβ cross-peaks are marked with red boxes and numbered arbitrarily (sequential assignments were not yet available at the time the paper containing this figure was published), and positive and negative contour levels are plotted here without distinction. Conditions: 8–12 mM protein in 2H2O, 20 mM Tris buffer, 20 mM KCl, p2H 7.0, recorded at 500 MHz for 1H and 24 °C. Adapted with permission from (© 1984 FEBS).
Fig. 23
Fig. 23
Rds3 and Bud31 in an EM structure of the yeast spliceosome. This structure from the Shi group was one of the first EM structures of an assembled spliceosome complex to be published , and corresponds to the so-called Bact complex on the splicing pathway, at which point the two ends of the exon that will be excised from the mRNA have been recognised and the catalytic components assembled and activated, but the splicing reaction itself has not yet started; see reference for further discussion. The structure was determined at 3.5 Å resolution, and contains 38 proteins and 4 RNA chains with a combined molecular mass of ∼ 1.6 MDa. In these views, created from PDB 5gm6 using the program PyMol , , Rds3 is shown as red spheres, Bud31 as yellow spheres, and all other chains are shown translucent and colour-coded by chain ID. The intention in showing this figure is only to convey to non-specialist readers the relative size and complexity of the intact spliceosome assembly as compared to the Rds3 and Bud31 components; technical aspects of the structure and its determination, such as figures showing fitting of the final models of the intact assembly and of individual components into the experimental EM density, can be found in the original paper and associated supplementary information file .

Similar articles

Cited by

References

    1. Miller J., McLachlan A.D., Klug A. Repetitive zinc-binding domains in the protein transcription factor IIIA from Xenopus oocytes. EMBO J. 1985;4:1609–1614. - PMC - PubMed
    1. Berg J.M. Proposed structure for the zinc-binding domains from transcription factor IIIA and related proteins. Proc. Natl. Acad. Sci. U.S.A. 1988;85:99–102. - PMC - PubMed
    1. Lee M.S., Gippert G.P., Soman K.V., Case D.A., Wright P.E. Three-dimensional solution structure of a single zinc finger DNA-binding domain. Science. 1989;245:635–637. - PubMed
    1. Parraga G., Horvath S.J., Eisen A., Taylor W.E., Hood L., Young E.T., Klevit R.E. Zinc-dependent structure of a single-finger domain of yeast ADR1. Science. 1988;241:1489–1492. - PubMed
    1. Klevit R.E., Herriott J.R., Horvath S.J. Solution structure of a zinc finger domain of yeast ADR1. Proteins. 1990;7:215–226. - PubMed

Publication types