. 2022 Sep 16:11:e80015.
doi: 10.7554/eLife.80015.

Neural signatures of auditory hypersensitivity following acoustic trauma

Affiliations

Neural signatures of auditory hypersensitivity following acoustic trauma

Matthew McGill et al. Elife. .

Abstract

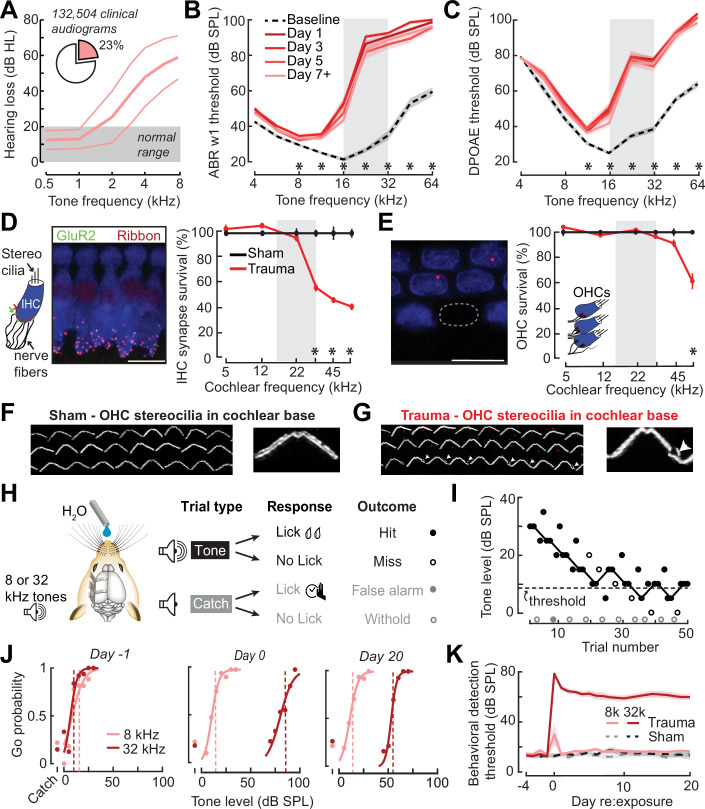
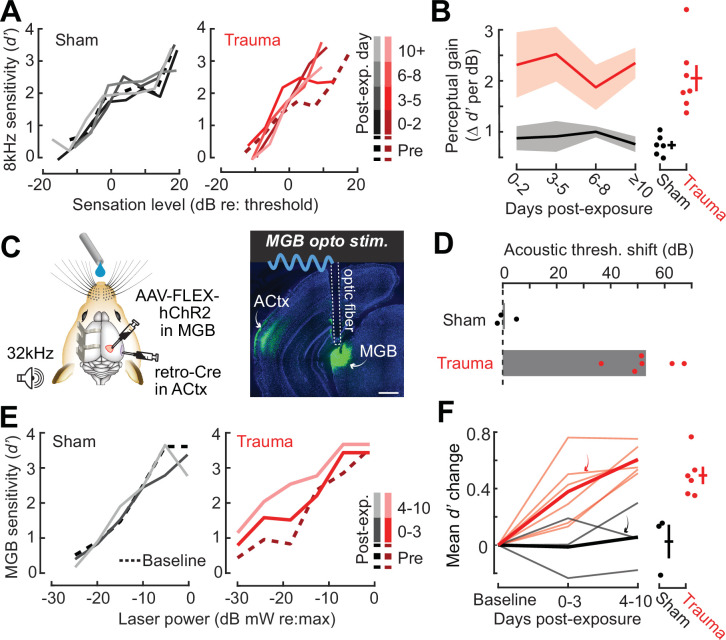
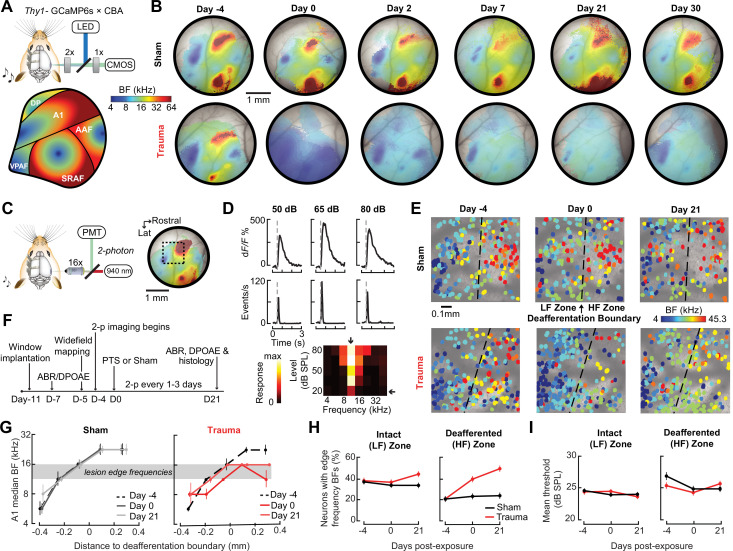
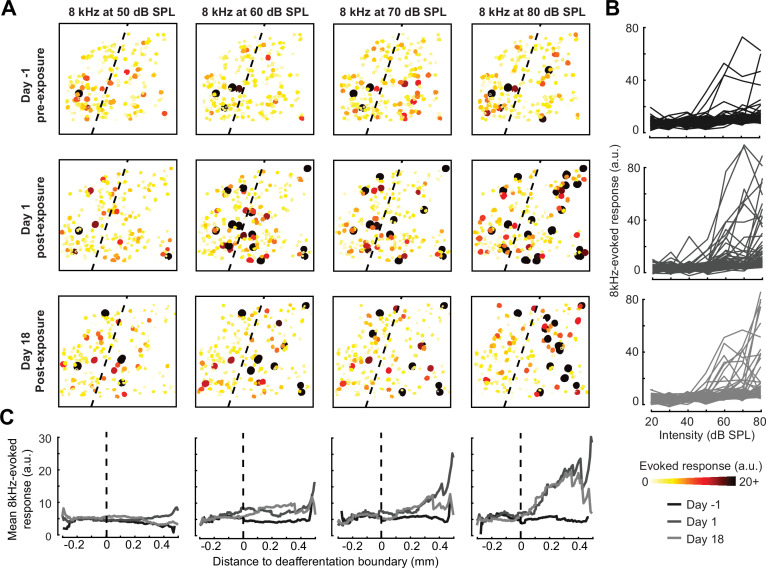
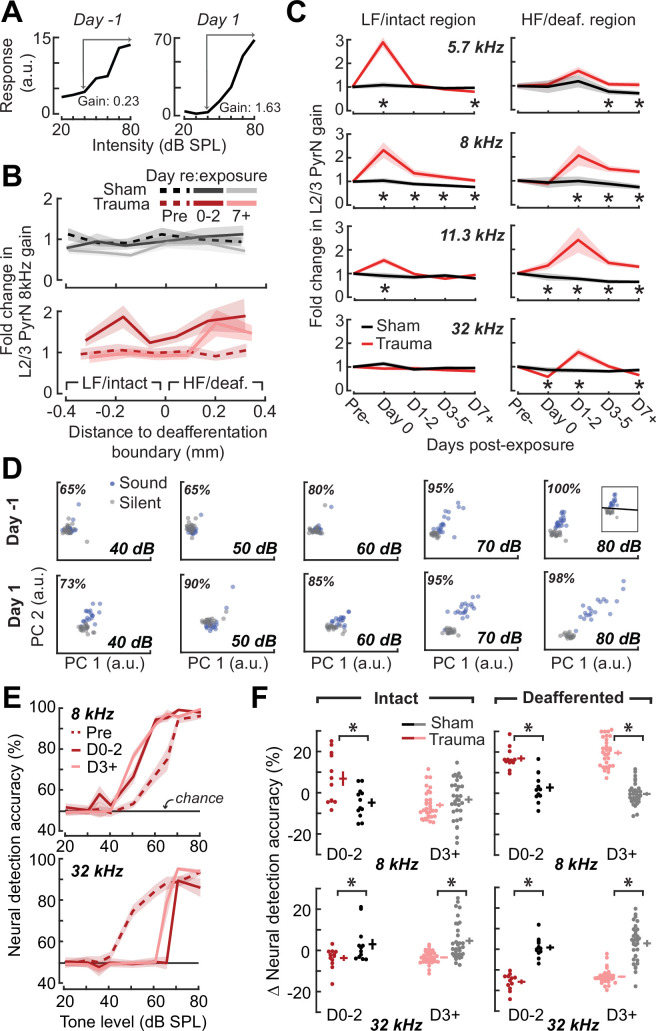
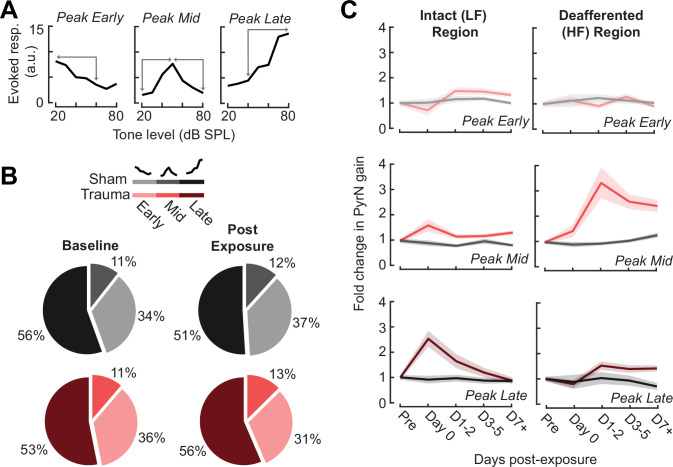
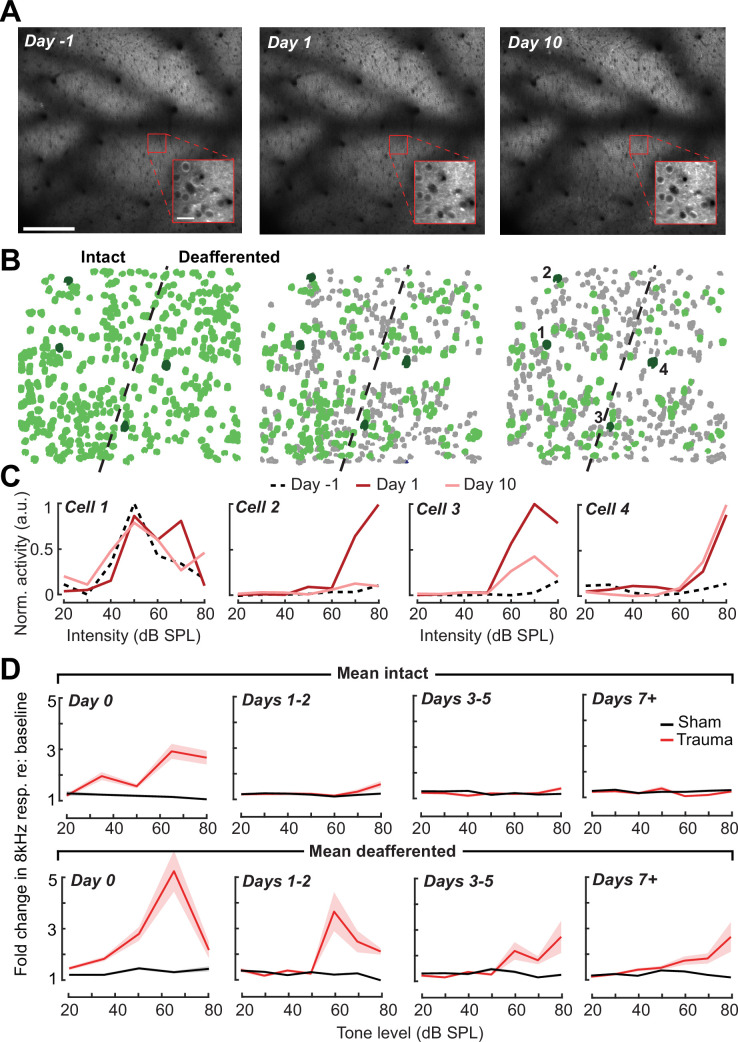
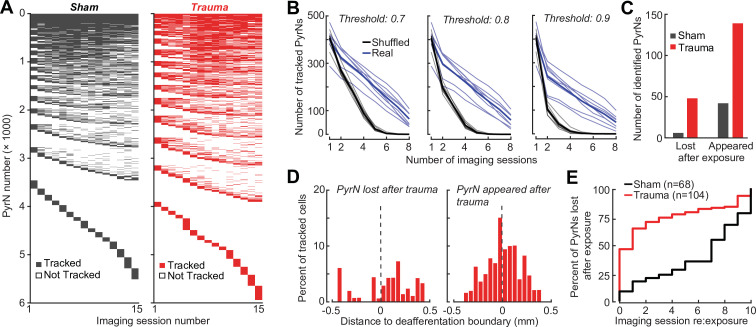
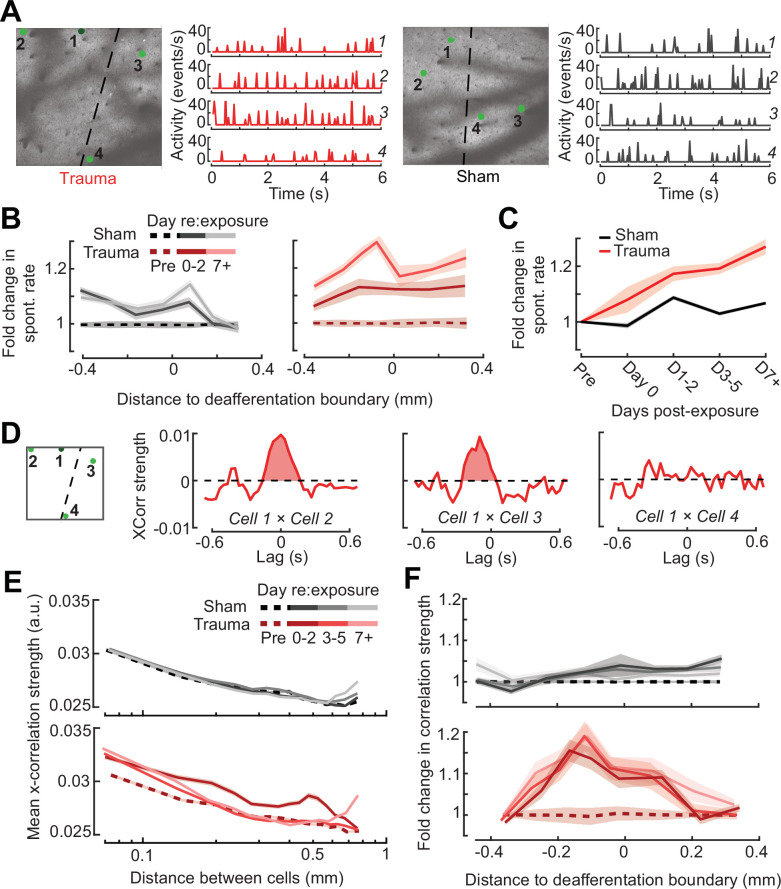
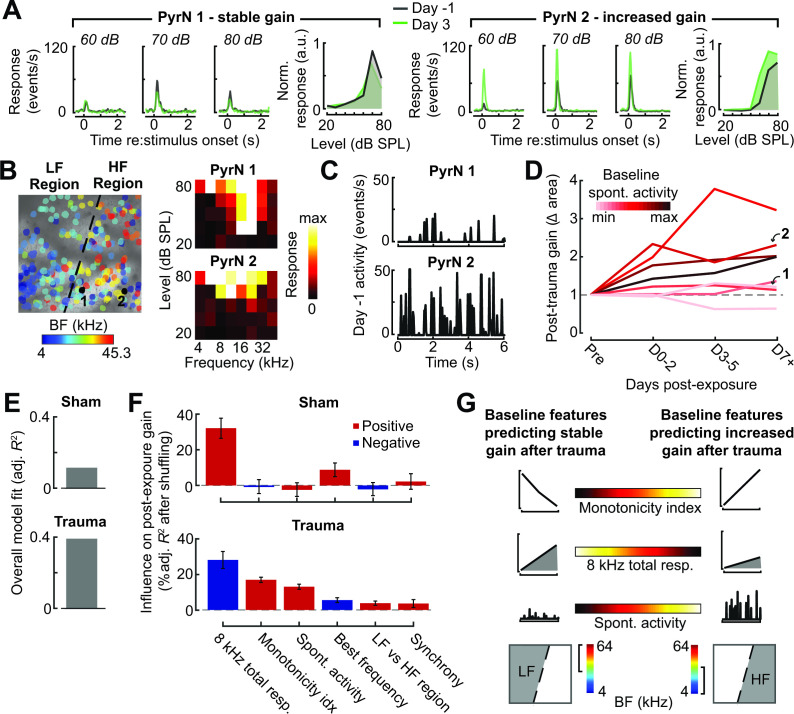
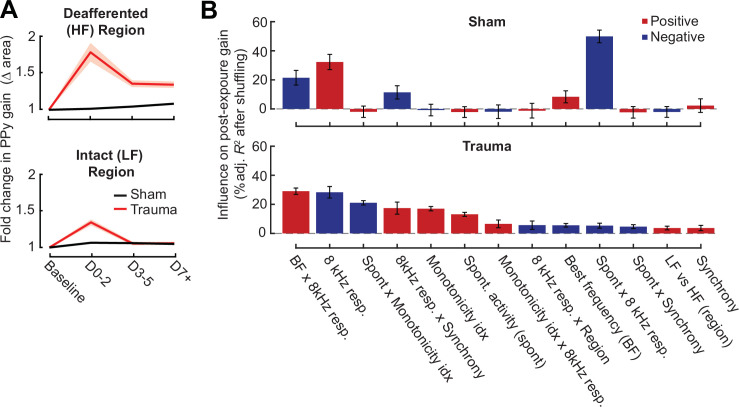
Neurons in sensory cortex exhibit a remarkable capacity to maintain stable firing rates despite large fluctuations in afferent activity levels. However, sudden peripheral deafferentation in adulthood can trigger an excessive, non-homeostatic cortical compensatory response that may underlie perceptual disorders including sensory hypersensitivity, phantom limb pain, and tinnitus. Here, we show that mice with noise-induced damage of the high-frequency cochlear base were behaviorally hypersensitive to spared mid-frequency tones and to direct optogenetic stimulation of auditory thalamocortical neurons. Chronic two-photon calcium imaging from ACtx pyramidal neurons (PyrNs) revealed an initial stage of spatially diffuse hyperactivity, hyper-correlation, and auditory hyperresponsivity that consolidated around deafferented map regions three or more days after acoustic trauma. Deafferented PyrN ensembles also displayed hypersensitive decoding of spared mid-frequency tones that mirrored behavioral hypersensitivity, suggesting that non-homeostatic regulation of cortical sound intensity coding following sensorineural loss may be an underlying source of auditory hypersensitivity. Excess cortical response gain after acoustic trauma was expressed heterogeneously among individual PyrNs, yet 40% of this variability could be accounted for by each cell's baseline response properties prior to acoustic trauma. PyrNs with initially high spontaneous activity and gradual monotonic intensity growth functions were more likely to exhibit non-homeostatic excess gain after acoustic trauma. This suggests that while cortical gain changes are triggered by reduced bottom-up afferent input, their subsequent stabilization is also shaped by their local circuit milieu, where indicators of reduced inhibition can presage pathological hyperactivity following sensorineural hearing loss.

Keywords: compensatory plasticity; excess central gain; hearing loss; homeostatic plasticity; hyperacusis; mouse; neuroscience; two-photon calcium imaging.


Conflict of interest statement

MM, AH, YW, AP, DC, KC, KH, AT, SK, DP No competing interests declared

Figures

Figure 1.
Figure 1.. Electrophysiological, anatomical, and behavioral confirmation of noise-induced, high-frequency sensorineural hearing loss.
(A) In human subjects, analysis of 132,504 pure tone audiograms indicates that 23% of visitors to our audiology clinic present with steeply sloping high-frequency hearing loss. Values represent mean ± standard deviation (SD) hearing thresholds in units of dB hearing loss (HL). In mice, response thresholds for wave 1 of the auditory brainstem response (ABR) (B) and cochlear distortion product otoacoustic emission (DPOAE) (C) measured before and at various time points after acoustic trauma show a permanent threshold shift at high frequencies (two-way repeated measures analyses of variance (ANOVAs), Frequency × Time interaction terms for ABR wave 1 [F = 87.51, p = 6 × 10–26] and DPOAE [F = 46.44, p = 2 × 10–29]). Asterisks denote significant differences between baseline and day 7 + measurements with post hoc pairwise comparisons (p < 0.05). (D) Cochlea immunostained for anti-CtBP2 and anti-GluR2a reveal reduced presynaptic ribbon and post-synaptic glutamate receptor patches, respectively, at high-frequency regions of the cochlea (>22 kHz) in trauma mice compared to sham exposure controls (mixed model ANOVA with Group as a factor, Frequency as a repeated measure, and cochlear synapse count as the outcome measure: Group × Frequency interaction term, F = 22.33, p = 4 × 10–11). Asterisks denote significant differences between Sham and Trauma with post hoc pairwise comparisons (p < 0.05). (E) Loss of outer hair cell (OHC) bodies is limited to the extreme basal regions of the cochlea in noise-exposed animals (Group × Frequency interaction term, F = 11.54, p = 4 × 10⁻⁷). (F–G) Anatomical substrates for cochlear threshold shifts (B, C) in more apical cochlear regions can be linked to comparatively subtle OHC stereocilia damage, as visualized by anti-Espin immunolabeling of actin bundle proteins. Cochlear location is approximately 32 kHz. Scale bars represent 10 μm. (H) Schematic depicts the design of a head-fixed Go/NoGo tone detection task. (I) A modified 2-up, 1-down adaptive staircasing approach to study tone detection thresholds. Example data show one run of 8 kHz tone detection, which finishes at six reversals. (J) Logistical fits of 8- and 32 kHz Go probability functions for one mouse measured before, hours after, and 20 days following acoustic trauma. Dotted lines show threshold as determined by the adaptive tracking method. (K) Daily behavioral threshold measurements from 13 mice (N = 7 trauma) over an approximate 3-week time period shows a permanent increase in 32 kHz threshold but not 8 kHz after acoustic trauma. Mixed model ANOVA with Group as a factor and both Frequency and Time as repeated measures, main effects for Group [F = 157.76, p = 8 × 10⁻⁸], Frequency [F = 368.87, p = 9 × 10⁻¹⁰], and Time [F = 44.21, p = 6 × 10–53], Group × Frequency × Time interaction [F = 37.98, p = 2 × 10–48].
Figure 2.
Figure 2.. Hypersensitivity to sound and direct auditory thalamocortical stimulation following acoustic trauma.
(A) Behavioral detection functions (reported as the sensitivity index) (d′) across time for sham- and noise-exposed example mice show hypersensitivity to spared, mid-frequency tones. (B) Left, change in perceptual gain for the 8 kHz tone, measured as the mean increase in d′ per dB increase in sound level, relative to baseline performance. Perceptual gain for an 8 kHz tone is increased in acoustic trauma mice (N = 7) compared to sham (N = 6) but does not change over post-exposure time (analysis of variance [ANOVA] with Group as a factor and Time as a repeated measure, main effect for Group, F = 12.42, p = 0.005; main effect for Time, F = 0.52, p = 0.67). Right, mean perceptual gain change collapsed across time is separately plotted for each mouse. (C) Left, preparation for the mixed modality optogenetic and tone detection task. Right, ChR2 expression in auditory thalamocortical neurons and placement of the implanted optic fiber relative to retrogradely labeled cell bodies in the medial geniculate body (MGB). (D) During 32 kHz tone detection blocks, detection thresholds are elevated by approximately 50 dB following trauma (N = 6, paired t-test, p = 0.0001) but no change was noted in sham-exposed mice (N = 3, p = 0.74). (E) Psychometric detection functions for optogenetic auditory thalamocortical stimulation before and after acoustic trauma or sham exposure in two example mice. (F) Left, summed change across the d′ function relative to baseline, for noise- and sham-exposed mice. Individual mice are thin lines, group means are thick lines. Example mice from E are indicated by the arrows. After trauma, mice became hypersensitive to MGB stimulation, suggesting an auditory thalamocortical contribution to perceptual hypersensitivity (ANOVA with Group as a factor and post-exposure Time as a repeated measure; main effect for Group, F = 15.54, p = 0.006; main effect for time, F = 4.65, p = 0.07). Right, d′ collapsed across time is separately plotted for each mouse.
Figure 3.
Figure 3.. Tonotopic remapping within the cortical deafferentation zone revealed by chronic mesoscale and cellular calcium imaging.
(A) Top, approach for widefield calcium imaging using a tandem lens epifluorescence microscope in awake Thy1-GCaMP6s × CBA/CaJ mice that express GCaMP6s in pyramidal neurons (PyrNs). Bottom, schematic depicts the typical arrangement of individual fields within the ACtx based on tonotopic best frequency (BF) gradients (as detailed in Romero et al., 2019). (B) Chronic widefield BF maps in example sham and trauma mice (top and bottom, respectively) show BF remapping within the deafferented high-frequency regions throughout the ACtx after acoustic trauma. (C) Left, approach for chronic two-photon calcium imaging of layer 2/3 PyrN’s along the A1 tonotopic gradient. Right, two-photon imaging field-of-view superimposed on the widefield BF map measured in another example mouse. (D) Top, example of tone-evoked GCaMP transients measured as the fractional change in fluorescence and deconvolved activity. Bottom, peak deconvolved amplitudes for tones of varying frequencies and levels are used to populate the complete frequency-response area and derive the BF (downward arrow) and threshold (leftward arrow) for each neuron. (E) BF arrangements in L2/3 PyrNs measured at three times over the course of a month in representative sham and trauma mice. A support vector machine (SVM) was trained to bisect the low- and high-frequency zones of the A1 BF map (LF [<16 kHz] and HF [≥16 kHz], respectively). The dashed line represents the SVM-derived boundary to segregate the LF and HF regions. The SVM line is determined for each mouse on day −4 and then applied to the same physical location for all future imaging sessions following alignment. (F) Timeline for chronic two-photon imaging and cochlear function testing in each sham and trauma mouse. (G) Individual PyrNs are placed into five distance categories based on their Euclidean distance to the SVM line and the BF of each category is expressed as the median ± bootstrapped error. Following trauma, BFs in the HF zone are remapped to sound frequencies at the edge of the cochlear lesion. (H) Across all tone-responsive PyrNs measured at three time points, the percent of neurons with BFs corresponding to edge frequencies (11.3–16 kHz) was greater in trauma mice (N = 4 mice, n = 1749 PyrNs) than sham (N = 4 mice, n = 1748 PyrNs), was greater in the deafferented HF region than the intact LF region, and increased over time in trauma mice compared to sham controls (three-way analysis of variance [ANOVA] with Group, Region, and Time as factors: main effect for Group, F = 34.29, p = 5 × 10⁻⁹; Group × Region interaction term, F = 7.42, p = 0.007; Group × Time interaction term, F = 10.17, p = 0.00004). (I) Competitive expansion of edge frequency BFs in the deafferented HF zone was not accompanied by a change in neural response threshold (three-way ANOVA: main effect for Group, F = 0.8, p = 0.37; Group × Region interaction term, F = 0.93, p = 0.33; Group × Time interaction term, F = 1.33, p = 0.27).
Figure 4.
Figure 4.. Spatial and temporal expression of excess central gain following acoustic trauma.
(A) Response amplitudes to 8 kHz tones presented at varying levels (columns) and days (rows) relative to noise exposure for 185 PyrNs in an example mouse. (B) Intensity-response functions for 66 randomly selected PyrNs recorded on days −4, 1, and 18 relative to the day of noise exposure. (C) Mean tone-evoked responses for all PyrNs relative to the support vector machine (SVM) deafferentation boundary at 50–80 dB SPL plotted separately for each of the 3 days.
Figure 5.
Figure 5.. Increased central gain is associated with hypersensitive neural encoding of low-intensity sounds.
(A) Neural gain is measured as the average rate of response growth in the sound level-response function. A detailed description of how neural gain is measured for different types of level-response functions is provided in Figure 5—figure supplement 1. (B) Mean change in response gain to an 8 kHz tone relative to the baseline support vector machine (SVM) demarcation of the low-frequency (LF) intact and high-frequency (HF) deafferented regions of the A1 map from all sham-exposed (top) and all noise-exposed (bottom) mice. (C) Fold change in 8 kHz response gain relative to the pre-exposure period in sham (n = 23,007 PyrNs from four mice) and trauma (n = 23,319 PyrNs from four mice). After acoustic trauma, the response gain for low- and mid-frequency tones is temporarily increased in the intact region. A sustained increase in response gain is observed in the deafferented region, particularly for tone frequencies bordering the cochlear lesion. Four-way analysis of variance (ANOVA) with Group, Region, Time, and Frequency as factors main effects, respectively: F = 111.03, p = 6 × 10–26; F = 0.03, p = 0.87; F = 23.21, p = 4 × 10–19; F = 9.87, p = 2 × 10⁻⁶; Group × Region × Time × Frequency interaction term: F = 2.23; p = 0.008. Asterisks denote significant pairwise post hoc differences between groups (p < 0.05). (D) Neural ensemble responses to single trials of sound or silence were decomposed into principal components (PC) and classified with an SVM decoder. The first two PCs are presented from an example mouse 1 day before or after acoustic trauma for an 8 kHz tone. Single trial classification accuracy is provided for each sound intensity. (E) Mean decoding accuracy for 8 and 32 kHz tones across all noise-exposed mice as a function of sound intensity at varying times following acoustic trauma. (F) Mean change in decoding accuracy across all intensities for 8 and 32 kHz tones for L2/3 PyrNs in the intact and deafferented regions of the A1 map. For 8 kHz tones, PyrN ensemble decoding shows sustained improvement in the deafferented region but a temporary improvement in the intact region. Ensemble decoding of 32 kHz tones is reduced for all time points and measurement regions. Dots represent single imaging sessions. Bars denote mean ± standard error of the mean (SEM). Asterisks represent significant differences with unpaired t-tests (p < 0.05).
Figure 5—figure supplement 1.
Figure 5—figure supplement 1.. Assessment of gain measurement for different intensity-response function shapes.
(A) Tone-responsive neurons were assigned to one of three categories depending on the location of the intensity-response function peak (i.e., the best level). The gain was calculated as the absolute change in response over the intensity range(s) indicated by the arrows. (B) The prevalence of the different function shapes for both noise- and sham-exposed mice at baseline and post-exposure D1–3. (C) Rather than collapsing gain changes across response function types (as per Figure 5C), analyzing each response type individually reveals that excess central gain is not observed in Peak Early types and is expressed most strongly in the Peak Mid intensity-response growth functions.
Figure 6.
Figure 6.. Tracking single neuron response gain dynamics over a several week period before and after noise exposure.
(A) Example fields-of-view from a single mouse showing the same imaging field over a several week period. Insets show data acquired at ×4 digital zoom. Scale bar is 200 μm, inset scale bar is 20 μm. (B) Single L2/3 PyrN ROI masks. Green masks indicate cells found on the current day and all previous days using a cell score threshold of 0.8 (see Figure 6—figure supplement 1). (C) Normalized 8 kHz intensity-response functions for the four PyrNs highlighted in B. Neurons in the intact region show temporary increases in their responses while neurons in the deafferented region show permanent hyperresponsiveness. (D) Mean fold change in response to 8 kHz tones of varying intensities for individual neurons relative to their own response function measured prior to noise exposure (n = 303/552, trauma/sham). Gain is strongly elevated in both regions hours after trauma. Sustained gain increases are observed in the deafferented zone for at least 1 week following trauma but not in the intact zone. Four-way analysis of variance (ANOVA) with Group and Region as factors, and Time and Intensity as repeated measures (main effects, respectively: F = 6.87, p = 0.01; F = 2.9, p = 0.09; F = 8.69, p = 4 × 10⁻⁵; F = 116.61, p = 8 × 10–13; Group × Region × Time × Intensity interaction term: F = 6.65; p = 0.0004).
Figure 6—figure supplement 1.
Figure 6—figure supplement 1.. Validation of single cell tracking over imaging days.
(A) Representation of all neurons found across noise- and sham-exposed mice. Cells are initially sorted by the number of sessions they were tracked (descending order) and then by the first session they were identified (ascending order). (B) To set criteria for identifying chronically tracked cells, we performed the same tracking algorithm on shuffled fields-of-view taken from the eight different mice. We have plotted the number cells tracked across eight sessions in real and shuffled datasets for different confidence thresholds. Falsely tracked PyrNs were not observed at a confidence threshold of 0.8 at eight sessions. (C) Cells reliably tracked for four baseline sessions that disappeared for all subsequent imaging sessions after noise exposure were labeled ‘lost’, while cells not present at baseline that were subsequently identified and tracked after noise exposure were labeled ‘appeared’. (D) After trauma, the location of the ‘lost’ and ‘appeared’ cells in the cortical map relative to the total number of cells found at each location and expressed as a percentage. Lost cells were largely found in the deafferented (high frequency) region, while appeared cells were concentrated around the deafferentation boundary. (E) The approach for identifying stable PyrNs that permanently disappeared on the day of noise exposure (C) was extended to all post-exposure days. Cells that were identified for every session up to a given point and then not identified for all subsequent sessions were identified as ‘lost’. Approximately 75% of lost PryNs disappeared within 48 hr after acoustic trauma. By contrast, the smaller set of lost PyrNs in sham-exposed mice mostly disappeared toward the end of the chronic imaging period.
Figure 7.
Figure 7.. Topographic regulation of neural hyperexcitability and hyper-synchrony after acoustic trauma.
(A) Spontaneous activity traces in four example neurons from a trauma (left) and sham (right) mouse. (B) In chronically tracked PyrNs, spontaneous activity changes are expressed as fold change relative to that cell’s pre-exposure baseline. Increased spontaneous activity after trauma (right) or the lack thereof after sham exposure (left) are plotted over topographic distance and over post-exposure time. (C) Spontaneous activity changes across the cortical map are significantly greater after trauma than sham exposure and increase over post-exposure time (n = 915/1125 tracked cells, for trauma/sham; mixed model analysis of variance (ANOVA) with Group as a factor and Time as a repeated measure, main effect for Group [F = 12.81, p = 0.0004], main effect for Time [F = 65.03, p = 3 × 10–40], Group × Time interaction term [F = 17.66, P = 3 × 10–11]). (D) Synchrony in the spontaneous activity of PyrN pairs is measured as the area under the shuffle-corrected cross-correlogram peak (shaded red region, see Materials and methods). Example data are plotted for the same four PyrNs with topographic positions indicated in left panel. (E) Looking across all significantly correlated PyrN pairs recorded in a given imaging session (n = 3,301,363 pairs, 1,624,195/1,677,168 for trauma/sham), neural synchrony is reduced as the physical separation between somatic ROIs increases. Synchrony is increased after trauma, though remains elevated only among nearby PyrNs (three-way ANOVA with Group, Day, and Distance as factors: main effects for Group [F = 556.94, p = 4 × 10–123], Day [F = 82.6, p = 2 × 10–53], and Distance [F = 8527.73, p = 0], Group × Day × Distance interaction term [F = 7.94, p = 3 × 10⁻⁵]). (F) For each chronically tracked neuron (same sample as C), we calculate their average neural synchrony with all other cells (only taking significant pairs). Given the location of these tracked cells, we can examine the fold change in neural synchrony relative to pre-exposure baseline across the topographic map. Neural synchrony is significantly and stably increased after trauma, particularly for PyrNs located near the deafferentation boundary (mixed model ANOVA with Group and Distance as factors and Day as a repeated measure: main effects for Group [F = 26.62, p = 3 × 10⁻⁷], Day [F = 1.68, p = 0.19], and Distance [F = 0.53, p = 0.47], Group × Distance interaction term [F = 5.53, p = 0.02]).
Figure 8.
Figure 8.. Identifying baseline features in single PyrNs that predict stable versus excess gain changes after acoustic trauma.
(A) Two exemplar tracked neurons illustrating stable (left) and excess (right) response growth to an 8 kHz tone following acoustic trauma. (B) Both neurons are located in the deafferented map region but had different best frequencies (BFs) and frequency tuning properties measured during the baseline imaging session. (C) Spontaneous activity for the same two PyrNs also differed at baseline. (D) For tracked neurons, gain is measured as the fold change in the area under the intensity-response growth function relative to the pre-exposure baseline (see Figure 8—figure supplement 1A). In eight representative neurons, a higher spontaneous activity rate at baseline was associated with excess central gain after trauma. Arrows denote PyrNs 1 and 2 shown in A–C. (E) A linear model used various pre-exposure properties of chronically tracked neurons to predict their change in gain (see Materials and methods). Models were fit separately for PyrNs recorded from trauma (n = 510 cells) and sham (n = 749 cells) mice. The response variable is defined as the area under the 8 kHz response curve after noise/sham exposure relative to this same area measurement in baseline. (F) For each model, individual predictor variables were shuffled and the models were refit. The resulting decrease in the adjusted R-squared is shown for variables in both models, and bars are color coded by the sign of the relationship of each predictor variable with the response variable. Errors are bootstrapped. For the full model see Figure 8—figure supplement 1B. Predictor variables in order: area under the baseline 8 kHz intensity-response growth function, monotonicity index for the 8 kHz intensity-response function defined as the response at the maximum intensity divided by the response at the best intensity, mean spontaneous activity, BF, an indicator variable for whether the cell is in the deafferented or intact region, and the strength of correlated activity between the PyrN and its neighbors. (G) A graphical summary of the linear model results schematize the baseline factors most strongly associated with stable (left) or excess (right) gain after trauma.
Figure 8—figure supplement 1.
Figure 8—figure supplement 1.. Extended description of the multivariate linear model analysis in sham and trauma mice.
(A) For tracked neurons, gain for an 8 kHz tone was measured as the area under the intensity-response function relative to the baseline area. Neurons in the intact region show a temporary increase in gain after trauma, while neurons in the deafferented region show permanent changes in gain. The fold change in area is the response variable for the linear model. (B) For each model, individual predictor variables were shuffled and the models were refit. The resulting decrease in the adjusted R-squared is shown for variables in both models, and bars are color coded by the sign of the relationship of each predictor variable with the response variable. Errors are bootstrapped.

Similar articles

Cited by

References

    1. Allen PD, Eddins DA. Presbycusis phenotypes form a heterogeneous continuum when ordered by degree and configuration of hearing loss. Hearing Research. 2010;264:10–20. doi: 10.1016/j.heares.2010.02.001. - DOI - PMC - PubMed
    1. Asokan MM, Williamson RS, Hancock KE, Polley DB. Sensory overamplification in layer 5 auditory corticofugal projection neurons following cochlear nerve synaptic damage. Nature Communications. 2018;9:2468. doi: 10.1038/s41467-018-04852-y. - DOI - PMC - PubMed
    1. Auerbach BD, Rodrigues PV, Salvi RJ. Central gain control in tinnitus and hyperacusis. Frontiers in Neurology. 2014;5:206–227. doi: 10.3389/fneur.2014.00206. - DOI - PMC - PubMed
    1. Auerbach BD, Radziwon K, Salvi R. Testing the central gain model: loudness growth correlates with central auditory gain enhancement in a rodent model of hyperacusis. Neuroscience. 2019;407:93–107. doi: 10.1016/j.neuroscience.2018.09.036. - DOI - PMC - PubMed
    1. Auerbach BD, Gritton HJ. Hearing in complex environments: auditory gain control, attention, and hearing loss. Frontiers in Neuroscience. 2022;16:799787. doi: 10.3389/fnins.2022.799787. - DOI - PMC - PubMed

Publication types