. 2022 Nov 15;132(22):e159925.
doi: 10.1172/JCI159925.

Immune tolerance against infused FVIII in hemophilia A is mediated by PD-L1+ Tregs

Affiliations

Immune tolerance against infused FVIII in hemophilia A is mediated by PD-L1+ Tregs

Janine Becker-Gotot et al. J Clin Invest. .

Abstract

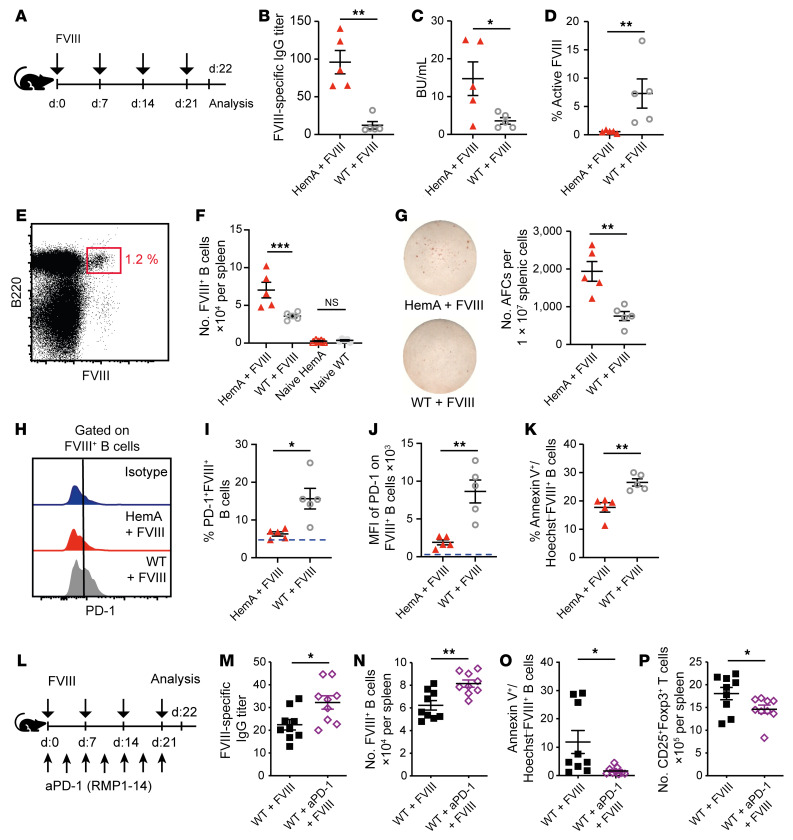
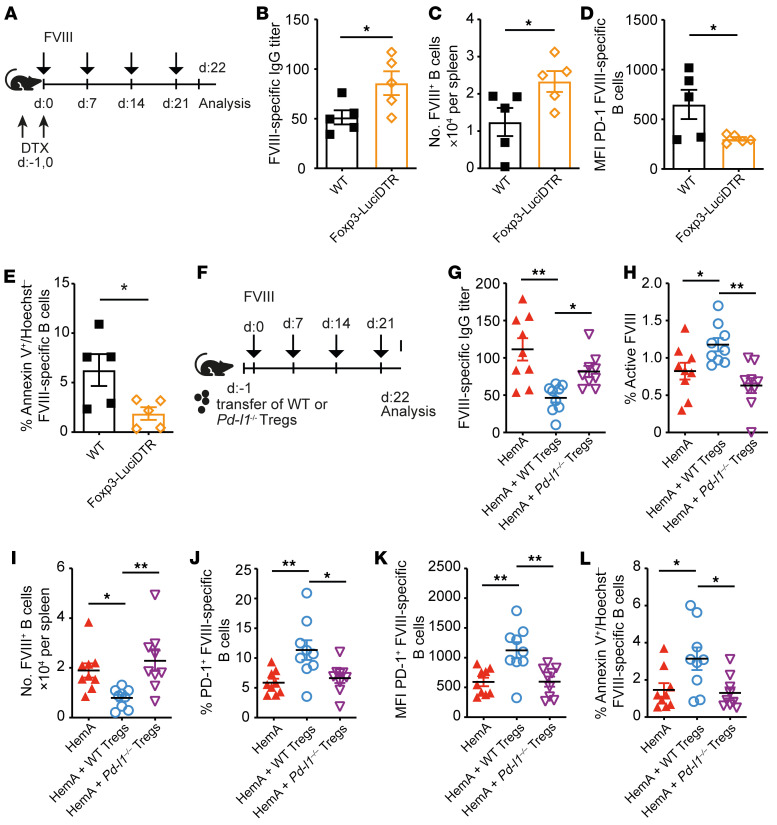
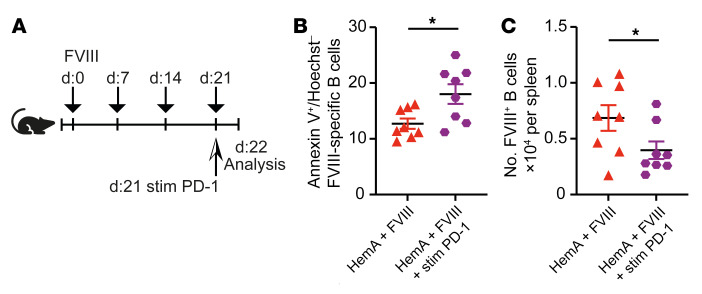
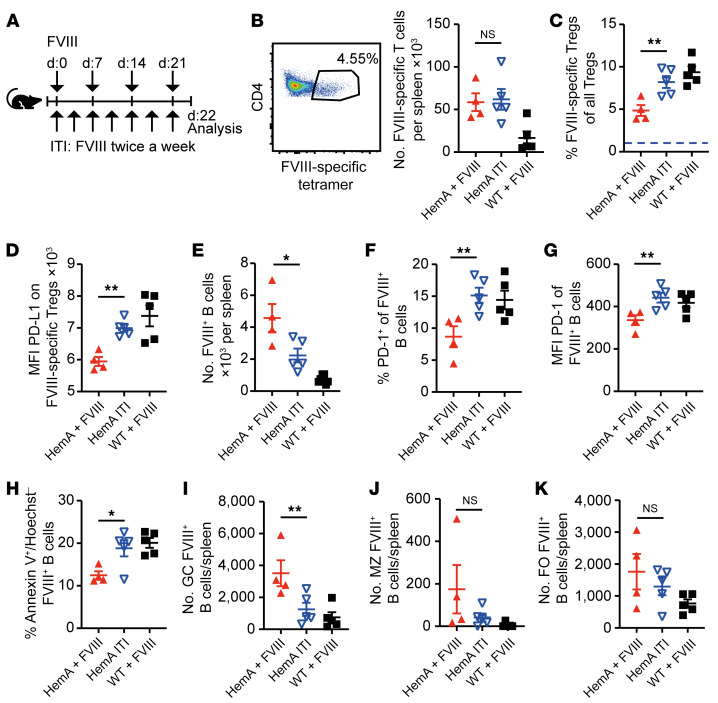
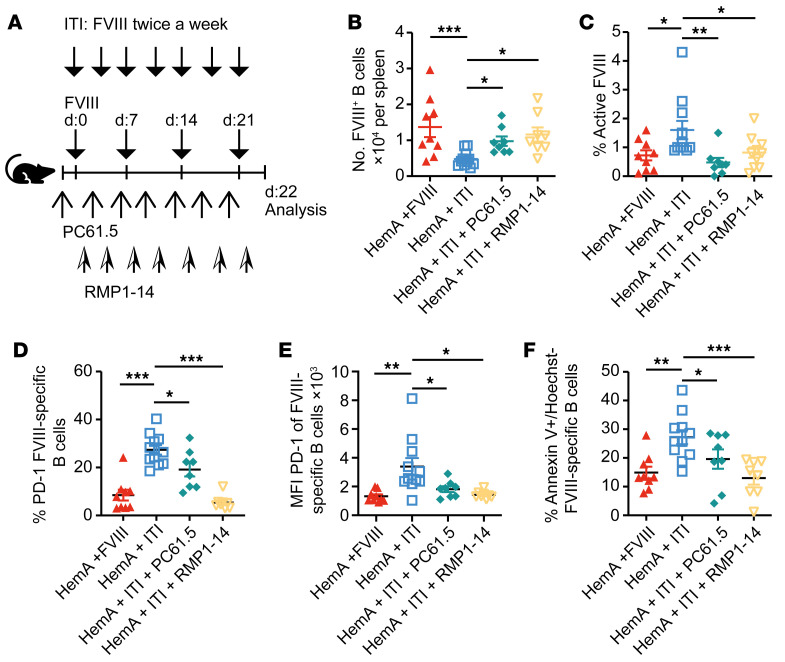
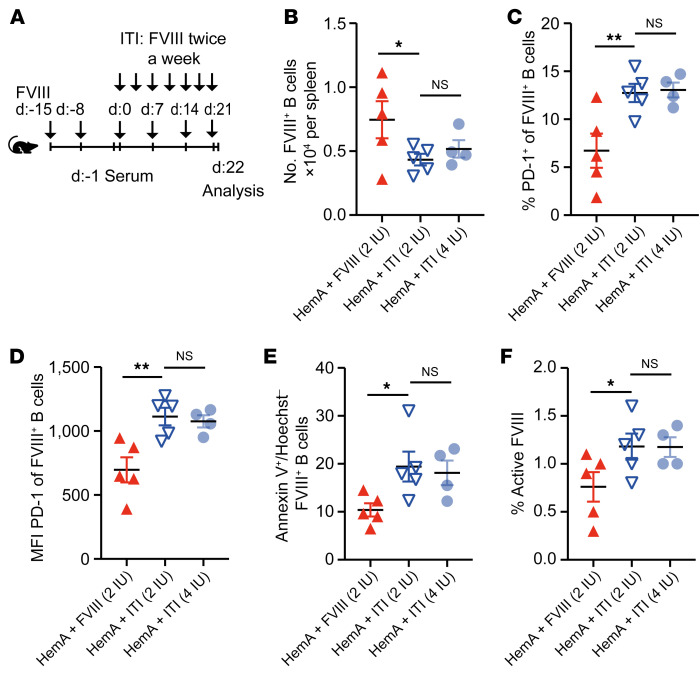
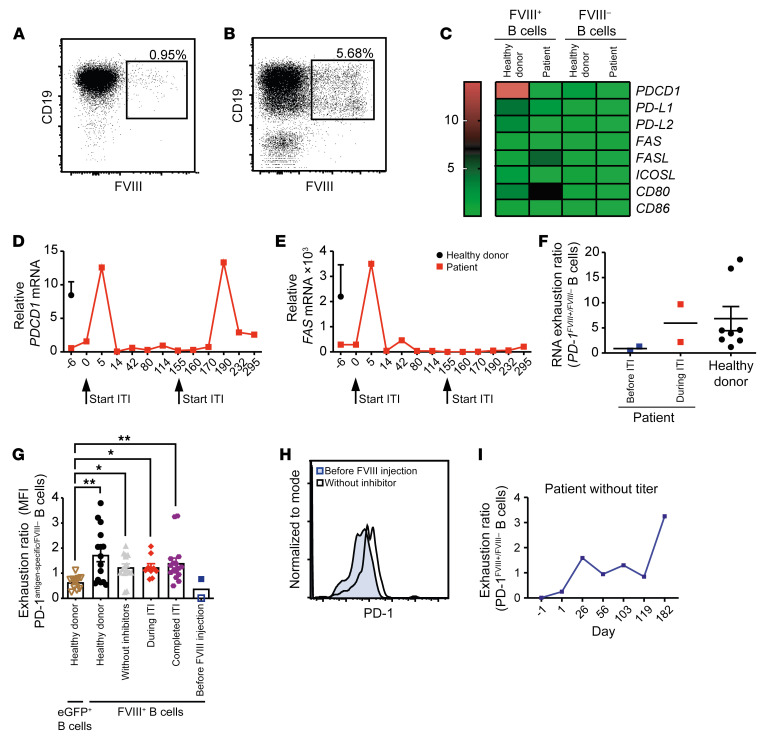
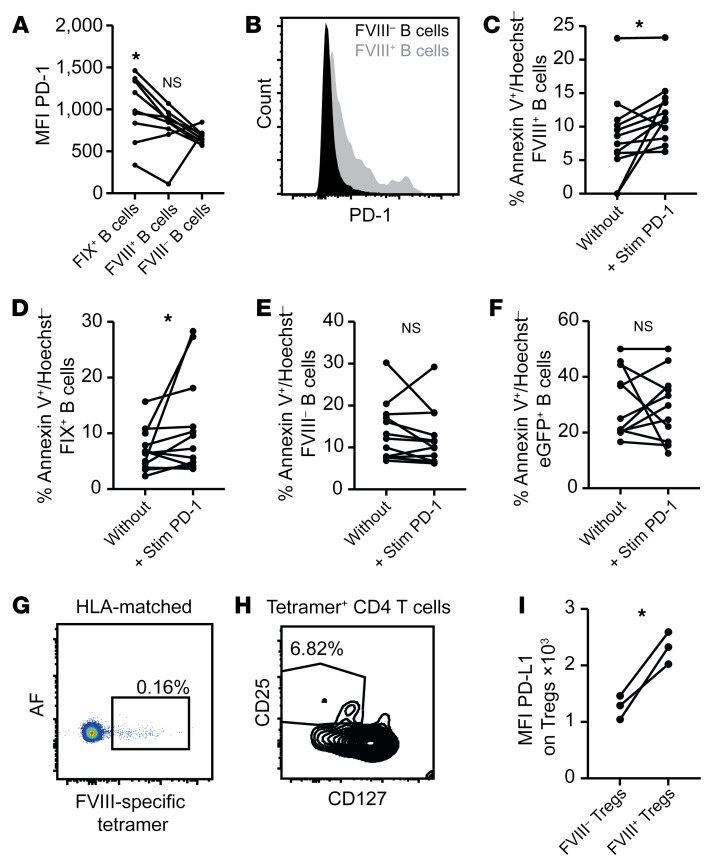
A major complication of hemophilia A therapy is the development of alloantibodies (inhibitors) that neutralize intravenously administered coagulation factor VIII (FVIII). Immune tolerance induction therapy (ITI) by repetitive FVIII injection can eradicate inhibitors, and thereby reduce morbidity and treatment costs. However, ITI success is difficult to predict and the underlying immunological mechanisms are unknown. Here, we demonstrated that immune tolerance against FVIII under nonhemophilic conditions was maintained by programmed death (PD) ligand 1-expressing (PD-L1-expressing) regulatory T cells (Tregs) that ligated PD-1 on FVIII-specific B cells, causing them to undergo apoptosis. FVIII-deficient mice injected with FVIII lacked such Tregs and developed inhibitors. Using an ITI mouse model, we found that repetitive FVIII injection induced FVIII-specific PD-L1+ Tregs and reengaged removal of inhibitor-forming B cells. We also demonstrated the existence of FVIII-specific Tregs in humans and showed that such Tregs upregulated PD-L1 in patients with hemophilia after successful ITI. Simultaneously, FVIII-specific B cells upregulated PD-1 and became killable by Tregs. In summary, we showed that PD-1-mediated B cell tolerance against FVIII operated in healthy individuals and in patients with hemophilia A without inhibitors, and that ITI reengaged this mechanism. These findings may impact monitoring of ITI success and treatment of patients with hemophilia A.

Keywords: Cellular immune response; Coagulation; Hematology; Immunology; Immunotherapy.


Figures

Figure 1
Figure 1. PD-1 suppresses the formation of FVIII-inhibiting antibodies in vivo.
(A) Experimental scheme for BK. (B and C) ELISA quantification of FVIII-specific IgG antibody titers (B) and Bethesda units (BU) (C) in the serum of HemA (red triangles) and WT mice (white circles) 22 days after weekly injections of 2 IU recombinant human FVIII (rhFVIII). (D) Percentage of active FVIII in the plasma of HemA or WT mice. (E) Gating strategy for splenic FVIII-specific B cells of mice treated once a week with rhFVIII. (F) Quantification FVIII-specific B cell numbers in spleens of naive HemA (n = 5) and WT mice (n = 5) or after rhFVIII treatment by flow cytometry. (G) Left: Representative ELISpot analysis, after coating with rhFVIII and 4-hour incubation with splenocytes. Right: Number of antibody-forming cells (AFCs) per 107 splenocytes. (H) Representative histograms of PD-1 expression on FVIII+ B cells. (I) Proportion of PD-1–expressing FVIII+ B cells; the blue dashed line represents the PD-1 expression of naive B cells. (J) PD-1 expression by FVIII+ B cells. (K) Early apoptotic cells presented as percentage of annexin V+Hoechst FVIII-specific B cells after in vitro restimulation with 0.25 μg rhFVIII overnight. (L) Experimental setting for MP. (M and N) ELISA-based quantification of FVIII-specific IgG antibody titers in the serum (M) and numbers of FVIII-specific B cells in spleens (N) of WT mice weekly injected with 2 IU/mouse rhFVIII and treated with an anti–PD-1 antibody (aPD-1, purple) or not (black). (O) Early apoptotic cells presented as percentage of annexin V+ and Hoechst FVIII-specific B cells after in vitro restimulation with 0.25 μg rhFVIII overnight. (P) Number of CD4+Foxp3+ Tregs in the spleen of treated mice. *P < 0.05; **P < 0.01; ***P < 0.001 by unpaired 2-tailed Student’s t test (BP) or 1-way ANOVA with Bonferroni’s post hoc test (F). NS, not significant.
Figure 2
Figure 2. PD-L1+ Tregs are necessary and sufficient to suppress FVIII-specific B cells in vivo.
(A) Experimental scheme. WT (black, n = 5) and Foxp3-LuciDTR (orange, n = 5) mice were intravenously injected with 2 IU/mouse of rhFVIII at weekly intervals. Foxp3+ Tregs were depleted by injecting 15 ng/g mouse DTX intraperitoneally on day –1 and 0. (B) ELISA-based quantification of the FVIII-specific IgG antibody titer in the serum of WT and Foxp3-LuciDTR mice. (C) Number of FVIII-specific B cells in spleens of WT and Foxp3-LuciDTR mice after treatment with rhFVIII by flow cytometry. (D) Mean fluorescence intensity (MFI) of PD-1 on FVIII-specific B cells of splenocyte suspensions. (E) Early apoptotic cells are presented as percentage of annexin V+ and Hoechst FVIII-specific B cells after in vitro restimulation with 0.25 μg rhFVIII overnight. (F) Experimental setup. Tregs (1 × 10⁶) isolated either from WT or Pd-l1–/– mice were injected into HemA mice. Starting on the next day, HemA (red, n = 9) and HemA mice that received Tregs from WT (blue, n = 9) or Pd-l1–/– (purple, n = 9) mice were intravenously injected with 2 IU/mouse of rhFVIII at weekly intervals. (G) FVIII-specific IgG antibody titers measured by ELISA in the serum. (H) The percentage of residual active FVIII in the plasma of rhFVIII-treated mice. (I) Number of FVIII-specific B cells in spleens of HemA mice with or without Treg transfer after rhFVIII treatment. (J) Proportion of splenic PD-1+ FVIII-specific B cells and (K) PD-1 MFI on FVIII-specific B cells. (L) Early apoptotic cells presented as annexin V+ and Hoechst FVIII-specific B cells after in vitro restimulation with 0.25 μg rhFVIII overnight. *P < 0.05; **P < 0.01 by unpaired 2-tailed Student’s t test (BE) or 1-way ANOVA with Bonferroni’s post hoc test (GL).
Figure 3
Figure 3. PD-1–stimulating antibodies bypass the need for PD-L1+ Tregs for tolerizing FVIII-specific B cells in HemA mice.
(A) Experimental setup. HemA (red n = 8, purple n = 8) mice were intravenously injected with 2 IU/mouse of rhFVIII at weekly intervals. One group of HemA mice (purple) received an additional injection of a stimulatory PD-1 antibody (200 μg) intraperitoneally on day 21. (B) On day 22, the amount of early apoptotic B cells given as the percentage of annexin V+ and Hoechst FVIII-specific B cells was analyzed after in vitro restimulation with rhFVIII. (C) Number of FVIII-specific B cells in spleens of HemA mice treated with a PD-1 stimulatory antibody or not 24 hours after the last injection. *P < 0.05 by unpaired 2-tailed Student’s t test.
Figure 4
Figure 4. High-dose FVIII treatment expands antigen-specific Tregs and increases their PD-L1 expression.
(A) Experimental setup for BK: 2 IU/mouse of rhFVIII was intravenously injected into HemA mice (red, n = 4) or WT mice (black, n = 5) at weekly intervals for 3 weeks, and twice a week for the high-dose FVIII regimen (blue, n = 5). Experimental setup for high-dose FVIII application regimen, used to induce tolerance (short ITI), and the therapeutic regimen. (B) Representative dot plot of CD4+ T cells analyzed for FVIII specificity via tetramer staining of rhFVIII-treated mice (left panel) and FVIII-specific CD4+ T cell count (right panel). (C) Proportion of FVIII-specific Tregs (gated on CD4+tetramer+CD25+CD127 cells) in splenic suspensions of HemA mice after treatment with rhFVIII once or twice a week. (D) PD-L1 expression by FVIII-specific Tregs (CD4+tetramer+CD25+CD127 cells) in splenic cells ex vivo. (E) Number of FVIII-specific B cells measured by flow cytometry ex vivo after once- or twice-per-week treatment with rhFVIII. (F) Proportion of PD-1–expressing FVIII-specific B cells and (G) PD-1 MFI on PD-1+ FVIII-specific B cells in the spleen on day 22. (H) Early apoptotic cells presented as percentage of annexin V+ and Hoechst FVIII-specific B cells after in vitro restimulation with 0.25 μg rhFVIII overnight. (IK) Number of FVIII-specific germinal center (GC; I), marginal zone (MZ; J) and follicular (FO; K) B cells in spleens of HemA mice after rhFVIII treatment. Germinal center B cells were identified as B220+FVIII+GL7+ cells, marginal zone B cells as B220+FVIII+CD93CD21/35+IgM+IgD cells, and follicular B cells as B220+FVIII+CD93CD21/35IgMIgD+ cells. *P < 0.05; **P <0.01 by 1-way ANOVA with Bonferroni’s post hoc test. NS, not significant.
Figure 5
Figure 5. Both PD-1 blockade and Treg depletion abolish immune tolerance induction after high-dose FVIII.
(A) Experimental scheme for BF: 2 IU/mouse of rhFVIII was intravenously injected into HemA (red, n = 9) mice at weekly intervals. Immune tolerance induction in HemA mice (blue n = 11, green n = 8, yellow n = 8) was achieved by injecting rhFVIII twice a week. CD25+ Tregs were depleted in ITI-receiving HemA mice (green) by the intraperitoneal injection of 250 μg depleting anti-CD25 antibody (PC61.5) 1 day prior to each rhFVIII injection. The PD-1 axis was inhibited in HemA mice (yellow) by injecting an anti–PD-1 inhibitory antibody (RMP1-14) intraperitoneally 3 hours after each rhFVIII treatment. (B) Number of FVIII-specific B cells in spleens of HemA mice after treatment with rhFVIII by flow cytometry. (C) Percentage of residual active FVIII protein in the plasma of treated mice. (D) Percentage of PD-1–expressing FVIII-specific B cells and (E) the MFI of PD-1 on FVIII-specific B cells. (F) Early apoptotic cells presented as percentage of annexin V+ and Hoechst FVIII-specific B cells after in vitro restimulation with 0.25 μg rhFVIII overnight. *P < 0.05; **P < 0.01; ***P < 0.001 by 1-way ANOVA with Bonferroni’s post hoc test.
Figure 6
Figure 6. High-dose FVIII induces immune tolerance via PD-1 and Tregs in mice with existing inhibitors.
(A) Experimental scheme for inhibitor induction prior to ITI. HemA mice were challenged 2 times at a weekly interval with 2 IU rhFVIII per mouse. FVIII-specific IgG titer was determined on day 14 and mice were distributed into the groups to achieve a comparable pretreatment status. Subsequently, HemA mice were immunized again with 2 IU/mouse of rhFVIII therapeutically once a week (red, n = 5) or according to the ITI protocol twice a week with 2 IU (blue triangle, n = 5) or 4 IU (light blue circle, n = 4) per mouse. (B) Ex vivo quantification of the number of FVIII-specific B cells in the spleen 22 days after start of ITI by flow cytometry. (C) Percentage of PD-1+ FVIII-specific B cells and (D) the MFI of PD-1 on FVIII-specific B cells analyzed ex vivo. (E) Early apoptotic cells are presented as percentage of annexin V+ and Hoechst FVIII-specific B cells after in vitro restimulation with 0.25 μg rhFVIII overnight. (F) Percentage of residual active FVIII in the plasma of HemA mice on day 22. *P < 0.05; **P < 0.01 by 1-way ANOVA with Bonferroni’s post hoc test. NS, not significant.
Figure 7
Figure 7. FVIII-specific B cells of healthy humans and hemophilia patients under ITI upregulate PD-1.
(A and B) Gating strategy for sorting of FVIII-specific B cells from human blood samples of a healthy donor (A) and a hemophilia A patient before ITI (B). CD19+ B cells were sorted for their ability to bind to fluorescently labeled rhFVIII protein. mRNA was extracted from sorted FVIII-specific B cells and analyzed by RT-PCR. (C) Relative mRNA expression of various inhibitory molecules in FVIII-specific and non–antigen-specific B cells from a hemophilia A patient with inhibitors or from healthy donors. Expression is correlated to 1 healthy individual. (D) Relative mRNA expression of PDCD1 and (E) FAS in FVIII-specific B cells of 1 hemophilia A patient with inhibitors during ITI. Arrows define the beginning of an ITI cycle. (F) RNA exhaustion ratio of PDCD1 in FVIII-specific B cells and non–antigen-specific B cells in a hemophilia A patient before ITI (blue, n = 2), during ITI (red, n = 2), and in healthy control donors (black, n = 8). (G) PD-1 protein expression (exhaustion ratio) of GFP-specific (brown triangles, n = 12) or FVIII-specific (all other groups) relative to non–FVIII-specific B cells from healthy donors (black circles, n = 15), hemophilia A patients before ITI (blue squares, n = 2), during ITI that received a rhFVIII injection less than 24 hours before analysis (gray triangles, n = 15), after completing ITI (red diamonds, n = 9), or without inhibitor titers (purple hexagon, n = 16), determined by flow cytometry. *P < 0.05; **P < 0.01 by 1-way ANOVA with Kruskal-Wallis post hoc test. (H) PD-1 expression on FVIII-specific B cells from the patient displayed in G as an open blue square (x axis) before (blue-filled area) and after rhFVIII injection on day 182 (unfilled area) presented as histogram. (I) Development of the exhaustion ratio of FVIII-specific B cells over 6 months.
Figure 8
Figure 8. PD-1 stimulation induces apoptosis in human FVIII- and FIX-specific B cells.
(A) MFI of PD-1 expression by FVIII- and FIX-specific and nonspecific B cells from 9 healthy donors detected by flow cytometry. *P < 0.05 by 1-way ANOVA with Dunn’s post hoc test. NS, not significant. (B) Example of PD-1 expression by FVIII-specific B cells from 1 representative donor. (CF) Percentage of apoptotic FVIII-specific (C), FIX-specific (D), non–FVIII-specific (E), and GFP-specific (F) B cells without and after incubation with a PD-L1 chimeric protein that specifically stimulates PD-1 in vitro. (G) The presence of FVIII-specific CD4+ T cells was analyzed in blood samples of an HLA-matched patient sample (n = 3) who had undergone successful ITI. (H) The percentage of CD25+CD127 (Tregs) of HLA-matched tetramer+CD4+ cells is depicted as a representative example. (I) The geometric MFI of PD-L1 was analyzed on FVIII-specific CD4+ HLA-matched Tregs versus nonspecific Tregs from the same patient blood sample. *P < 0.05 by 1-way ANOVA with Dunn’s post hoc test (A) or paired, 2-tailed Student’s t test (CF and I). NS, not significant.

Comment in

Similar articles

Cited by

References

    1. Hoyer LW. Hemophilia A. N Engl J Med. 1994;330(1):38–47. doi: 10.1056/NEJM199401063300108. - DOI - PubMed
    1. Graw J, et al. Haemophilia A: from mutation analysis to new therapies. Nat Rev Genet. 2005;6(6):488–501. doi: 10.1038/nrg1617. - DOI - PubMed
    1. Mannucci PM, Tuddenham EGD. The hemophilias — from royal genes to gene therapy. N Engl J Med. 2001;344(23):1773–1779. doi: 10.1056/NEJM200106073442307. - DOI - PubMed
    1. Ehrenforth S, et al. Incidence of development of factor VIII and factor IX inhibitors in haemophiliacs. Lancet. 1992;339(8793):594–598. doi: 10.1016/0140-6736(92)90874-3. - DOI - PubMed
    1. Hoyer LW. The incidence of factor VIII inhibitors in patients with severe hemophilia A. Adv Exp Med Biol. 1995;386:35–45. doi: 10.1007/978-1-4613-0331-2_3. - DOI - PubMed

Publication types