Typical response of CD14++CD16- monocyte to knee synovial derived mediators as a key target to overcome the onset and progression of osteoarthritis
- PMID: 36106324
- PMCID: PMC9464827
- DOI: 10.3389/fmed.2022.904721
Typical response of CD14++CD16- monocyte to knee synovial derived mediators as a key target to overcome the onset and progression of osteoarthritis
Abstract
Objective: Synovitis with increased infiltration of immune cells is observed in osteoarthritis (OA). Given the inflammatory condition of synovitis, we explored the protein profile of OA synovium (OAS) and its effect on circulating monocytes activation, migration, and functional commitments.
Methods: Knee-synovium was acquired from end-stage OA (N = 8) and trauma patients (Trauma baseline control: TBC; N = 8) for characterization using H&E histology, IHC (iNOS), LCMS-QTOF, and MALDI-imaging. Response of peripheral blood monocytes to OAS conditioned-media (OACM) was observed using transwell (n = 6). The migrated cells were captured in SEM, quantified using phase-contrast microphotographs, and their activation receptors (CCR2, CXCR2, CX3CR1, and CD11b), pro-inflammatory genes, and phagocytic potential were studied using flow cytometry, gene expression array/qPCR, and latex beads (LB) phagocytosis assay, respectively.
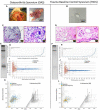
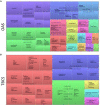
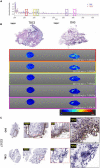
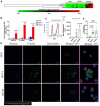
Results: The Venn diagram displayed 119 typical proteins in OAS, while 55 proteins in TBCS. The STRING protein network analysis indicated distinctive links between proteins and gene ontology (GO) and revealed proteins associated with leukocyte-mediated immunity in OAS as compared to TBC. The MALDI-imaging showed typical localized proteins at 2234.97, 2522.61, 2627.21, 3329.50, and 3539.69 m/z and IHC confirmed pro-inflammatory iNOS expression in OA synovium. CD14++CD16- classical monocytes significantly migrated in OACM and expressed CCR2, CXCR2, and CD11b receptors, TNFRSF11A, MAPK1, S100A8, HSPB1, ITGAL, NFATC1, IL13RA1, CD93, IL-1β, TNF-α, and MYD88 genes and increased LB uptake as compared to SFM.
Conclusion: Our findings suggest that the differential protein profile of OA synovium and the classical monocytes migrated, activated, and functionally committed in response to these mediators could be of therapeutic advantage.
Keywords: MALDI-imaging; inflammation; monocytes; osteoarthritis; proteomics; synovium.
Copyright © 2022 Saffery, Genasan, Chan, Ayob, Teo, Al-Fayyadh, Othman, Abidin, Raman, Raghavendran and Kamarul.
Conflict of interest statement
The authors declare that the research was conducted in the absence of any commercial or financial relationships that could be construed as a potential conflict of interest.
Figures


Similar articles
-
Monocyte activation is elevated in women with knee-osteoarthritis and associated with inflammation, BMI and pain.Osteoarthritis Cartilage. 2018 Feb;26(2):255-263. doi: 10.1016/j.joca.2017.10.018. Epub 2017 Nov 8. Osteoarthritis Cartilage. 2018. PMID: 29128509
-
CCL3/CCR1 mediates CD14+CD16- circulating monocyte recruitment in knee osteoarthritis progression.Osteoarthritis Cartilage. 2020 May;28(5):613-625. doi: 10.1016/j.joca.2020.01.009. Epub 2020 Jan 29. Osteoarthritis Cartilage. 2020. PMID: 32006659
-
S100A8/A9 increases the mobilization of pro-inflammatory Ly6Chigh monocytes to the synovium during experimental osteoarthritis.Arthritis Res Ther. 2017 Sep 29;19(1):217. doi: 10.1186/s13075-017-1426-6. Arthritis Res Ther. 2017. PMID: 28969686 Free PMC article.
-
Monocytes in rheumatoid arthritis: Circulating precursors of macrophages and osteoclasts and, their heterogeneity and plasticity role in RA pathogenesis.Int Immunopharmacol. 2018 Dec;65:348-359. doi: 10.1016/j.intimp.2018.10.016. Epub 2018 Oct 23. Int Immunopharmacol. 2018. PMID: 30366278 Review.
-
The role of cytokines in osteoarthritis pathophysiology.Biorheology. 2002;39(1-2):237-46. Biorheology. 2002. PMID: 12082286 Review.
Cited by
-
Synovial fluid monocyte-to-lymphocyte ratio in knee osteoarthritis patients predicts patient response to conservative treatment: a retrospective cohort study.BMC Musculoskelet Disord. 2024 May 14;25(1):379. doi: 10.1186/s12891-024-07475-1. BMC Musculoskelet Disord. 2024. PMID: 38745277 Free PMC article.
-
CD14 and CSF1R as developmental molecular targets for the induction of osteoarthritis.Int J Clin Exp Pathol. 2023 Aug 15;16(8):184-198. eCollection 2023. Int J Clin Exp Pathol. 2023. PMID: 37693684 Free PMC article.
References
-
- Sellam J, Berenbaum F. The role of synovitis in pathophysiology and clinical symptoms of osteoarthritis. Nat Rev Rheumatol. (2010) 6:625. - PubMed
-
- De Lange-Brokaar BJ, Ioan-Facsinay A, Van Osch GJ, Zuurmond A-M, Schoones J, Toes RE, et al. Synovial inflammation, immune cells and their cytokines in osteoarthritis: a review. Osteoarthritis Cartilage. (2012) 20:1484–99. - PubMed
-
- Riis RGC, Gudbergsen H, Simonsen O, Henriksen M, Al-Mashkur N, Eld M, et al. The association between histological, macroscopic and magnetic resonance imaging assessed synovitis in end-stage knee osteoarthritis: a cross-sectional study. Osteoarthritis Cartilage. (2017) 25:272–80. 10.1016/j.joca.2016.10.006 - DOI - PubMed
-
- Meerschaert J, Furie MB. The adhesion molecules used by monocytes for migration across endothelium include CD11a/CD18, CD11b/CD18, and VLA-4 on monocytes and ICAM-1, VCAM-1, and other ligands on endothelium. J Immunol. (1995) 154:4099–112. - PubMed
LinkOut - more resources
Full Text Sources
Research Materials
Miscellaneous

