CENP-A is a potential prognostic biomarker and correlated with immune infiltration levels in glioma patients
- PMID: 36105094
- PMCID: PMC9465177
- DOI: 10.3389/fgene.2022.931222
CENP-A is a potential prognostic biomarker and correlated with immune infiltration levels in glioma patients
Abstract
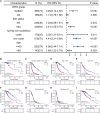
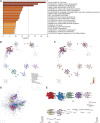
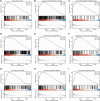
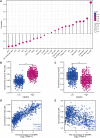
Background: Centromeric protein A (CENP-A), an essential protein involved in chromosomal segregation during cell division, is associated with several cancer types. However, its role in gliomas remains unclear. This study examined the clinical and prognostic significance of CENP-A in gliomas. Methods: Data of patients with glioma were collected from the Cancer Genome Atlas. Logistic regression, the Kruskal-Wallis test, and the Wilcoxon signed-rank test were performed to assess the relationship between CENP-A expression and clinicopathological parameters. The Cox regression model and Kaplan-Meier curve were used to analyze the association between CENP-A and survival outcomes. A prognostic nomogram was constructed based on Cox multivariate analysis. Gene set enrichment analysis (GSEA) was conducted to identify key CENP-A-related pathways and biological processes. Results: CENP-A was upregulated in glioma samples. Increased CENP-A levels were significantly associated with the world health organization (WHO) grade [Odds ratio (OR) = 49.88 (23.52-129.06) for grade 4 vs. grades 2 and 3], primary therapy outcome [OR = 2.44 (1.64-3.68) for progressive disease (PD) and stable disease (SD) vs. partial response (PR) and complete response (CR)], isocitrate dehydrogenase (IDH) status [OR = 13.76 (9.25-20.96) for wild-type vs. mutant], 1p/19q co-deletion [OR = 5.91 (3.95-9.06) for no codeletion vs. co-deletion], and age [OR = 4.02 (2.68-6.18) for > 60 vs. ≤ 60]. Elevated CENP-A expression was correlated with shorter overall survival in both univariate [hazard ratio (HR): 5.422; 95% confidence interval (CI): 4.044-7.271; p < 0.001] and multivariate analyses (HR: 1.967; 95% CI: 1.280-3.025; p < 0.002). GSEA showed enrichment of numerous cell cycle-and tumor-related pathways in the CENP-A high expression phenotype. The calibration plot and C-index indicated the favorable performance of our nomogram for prognostic prediction in patients with glioma. Conclusion: We propose a role for CENP-A in glioma progression and its potential as a biomarker for glioma diagnosis and prognosis.
Keywords: CENP-A; biomarker; glioma; microenvironment; prognosis.
Copyright © 2022 Yang, Duan, Zha and Wu.
Conflict of interest statement
The authors declare that the research was conducted in the absence of any commercial or financial relationships that could be construed as a potential conflict of interest.
Figures


Similar articles
-
MCM10 as a novel prognostic biomarker and its relevance to immune infiltration in gliomas.Technol Health Care. 2023;31(4):1301-1317. doi: 10.3233/THC-220576. Technol Health Care. 2023. PMID: 36872806
-
High IER5 Gene Expression Is Associated With Poor Prognosis in Glioma Patients.Front Cell Dev Biol. 2021 Jun 17;9:679684. doi: 10.3389/fcell.2021.679684. eCollection 2021. Front Cell Dev Biol. 2021. PMID: 34222249 Free PMC article.
-
MCM4 is a novel prognostic biomarker and promotes cancer cell growth in glioma.Front Oncol. 2022 Nov 17;12:1004324. doi: 10.3389/fonc.2022.1004324. eCollection 2022. Front Oncol. 2022. PMID: 36465369 Free PMC article.
-
High TRAF3IP3 Level Predicts Poor Prognosis of Patients with Gliomas.World Neurosurg. 2021 Apr;148:e436-e449. doi: 10.1016/j.wneu.2021.01.006. Epub 2021 Jan 12. World Neurosurg. 2021. PMID: 33444836
-
A nuclear transport-related gene signature combined with IDH mutation and 1p/19q codeletion better predicts the prognosis of glioma patients.BMC Cancer. 2020 Nov 9;20(1):1072. doi: 10.1186/s12885-020-07552-3. BMC Cancer. 2020. PMID: 33167941 Free PMC article.
Cited by
-
Radiomics Features on Magnetic Resonance Images Can Predict C5aR1 Expression Levels and Prognosis in High-Grade Glioma.Cancers (Basel). 2023 Sep 21;15(18):4661. doi: 10.3390/cancers15184661. Cancers (Basel). 2023. PMID: 37760630 Free PMC article.
-
Roles of Histone H2B, H3 and H4 Variants in Cancer Development and Prognosis.Int J Mol Sci. 2024 Sep 7;25(17):9699. doi: 10.3390/ijms25179699. Int J Mol Sci. 2024. PMID: 39273649 Free PMC article. Review.
-
β-TrCP-Mediated Proteolysis of Mis18β Prevents Mislocalization of CENP-A and Chromosomal Instability.Mol Cell Biol. 2024;44(10):429-442. doi: 10.1080/10985549.2024.2382445. Epub 2024 Aug 13. Mol Cell Biol. 2024. PMID: 39135477 Free PMC article.
-
The Impact of DAXX, HJURP and CENPA Expression in Uveal Melanoma Carcinogenesis and Associations with Clinicopathological Parameters.Biomedicines. 2024 Aug 6;12(8):1772. doi: 10.3390/biomedicines12081772. Biomedicines. 2024. PMID: 39200236 Free PMC article.
References
LinkOut - more resources
Full Text Sources
Research Materials

