. 2022 Sep 6:13:20417314221122130.
doi: 10.1177/20417314221122130. eCollection 2022 Jan-Dec.

Hamster organotypic kidney culture model of early-stage SARS-CoV-2 infection highlights a two-step renal susceptibility

Affiliations

Hamster organotypic kidney culture model of early-stage SARS-CoV-2 infection highlights a two-step renal susceptibility

Sophie R Shyfrin et al. J Tissue Eng. .

Abstract

Kidney pathology is frequently reported in patients hospitalized with COVID-19, the pandemic disease caused by the Severe acute respiratory coronavirus 2 (SARS-CoV-2). However, due to a lack of suitable study models, the events occurring in the kidney during the earliest stages of infection remain unknown. We have developed hamster organotypic kidney cultures (OKCs) to study the early stages of direct renal infection. OKCs maintained key renal structures in their native three-dimensional arrangement. SARS-CoV-2 productively replicated in hamster OKCs, initially targeting endothelial cells and later disseminating into proximal tubules. We observed a delayed interferon response, markers of necroptosis and pyroptosis, and an early repression of pro-inflammatory cytokines transcription followed by a strong later upregulation. While it remains an open question whether an active replication of SARS-CoV-2 takes place in the kidneys of COVID-19 patients with AKI, our model provides new insights into the kinetics of SARS-CoV-2 kidney infection and can serve as a powerful tool for studying kidney infection by other pathogens and testing the renal toxicity of drugs.

Keywords: SARS-CoV-2; kidney; organotypic cultures.


Conflict of interest statement

Declaration of conflicting interests: The author(s) declared no potential conflicts of interest with respect to the research, authorship, and/or publication of this article.

Figures
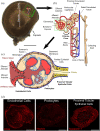
Figure 1.
Figure 1.
Schematic representation of the anatomy of hamster organotypic kidney cultures. (a) A 500-µm thick organotypic kidney slice maintained on an air-liquid interface provided by a PTFE membrane was photographed in brightfield using a Nikon Eclipse Ts2R epifluorescence microscope. Scalebar = 1 mm. The renal capsule, cortex and medulla are identified and labeled. A nephron schematic is positioned in its physiological location and highlighted with a green rectangle. (b) The structure of a nephron, a functional unit of the kidney, showing the flow of the filtrate. (c) The structure of a renal corpuscle. The schematic was rendered in-house using Procreate® and Inkscape 1.1. (d) Organotypic kidney cultures were fixed in 4% paraformaldehyde, embedded in OCT solution and cryosectioned at 10 µm thickness. Sections were immunostained to visualize endothelial cells, podocytes and proximal tubular epithelial cells with anti-CD34 (endothelial cells; left panel), anti-nephrin (podocytecs; middle panel) and anti-aquaporin1 (proximal tubular epithelial cells) primary antibodies (right panel). Scalebar = 1 mm. Images were reconstructed using the Stitching plugin in ImageJ.
Figure 2.
Figure 2.
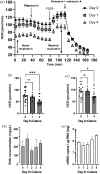
Viability of hamster organotypic slices in culture. The Seahorse XF Analyzer was used to analyze the metabolic activity of OKCs. Briefly, 400-µm thick OKCs were maintained at an air-liquid interface in the OKC medium for 0, 1 or 4 days prior to measurement. One punch per slice was cut in the cortical zone and basal and maximal respiration of each punch was determined using the MitoStress test. The oxygen consumption rate (OCR) was measured according to time. Punches received successive additions of respiratory modulators indicated by arrows, ATP synthase inhibitor oligomycin (3 µM), uncoupling agent FCCP (3 µM) with pyruvate supplement (0.7 mM), and then rotenone + antimycin A (6 µM) to completely inhibited mitochondrial respiration. (a) For each experiment, mean OCR +/− SEM is plotted. Determination of the basal and maximal respiration is indicated with green arrows on the mean OCR curve obtained at day 4. (b) Basal and (c) maximal respiration rates of OKCs. Mean respiration rates obtained at day 1 and 4 were compared to that of day 0 using ordinary one-way ANOVA. *, p < 0.05; **, p < 0.01; ***, p < 0.001. (d) Concentration of RNA extracted from non-infected OKCs collected after 0 to 4 days of culture. (e) Expression of GAPDH in non-infected OKCs collected after 0 to 4 days of culture.
Figure 3.
Figure 3.
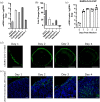
SARS-CoV-2 permissiveness of and progression in hamster organotypic kidney cultures. (a and b) Gene expression was quantified in non-infected organotypic kidney cultures (OKCs) and hamster organotypic lung cultures collected on the day of dissection via RT-qPCR as the number of mRNA copies per μg of total RNA and normalized by the standard deviation in GAPDH expression. (a) mRNA copy numbers of candidate SARS-CoV-2 entry factors per µg of total RNA. (b) Fold change of SARS-CoV-2 entry factor mRNA copy numbers per µg of total RNA in OKCs compared to organotypic lung cultures. (c) Hamster organotypic cultures were infected with 1000 pfu of wild-type SARS-CoV-2 (2019-nCoV/USA_WA1/2020) and collected every day from day 0 (90 min post-infection) to day 4 post-infection. SARS-CoV-2 replication was measured by quantifying the amount of SARS-CoV-2 nucleocapsid (NP) mRNA per μg of total mRNA via RT-qPCR and normalizing it by the expression of a housekeeping gene (GAPDH). (d) Hamster OKCs infected with 10,000 pfu of SARS-CoV-2_mNeon Green (icSARS-CoV-2-mNG) were imaged from day 0 to day 4 post-infection using a Nikon Eclipse Ts2R epifluorescence microscope. Scalebar = 1 mm. (e) Hamster OKCs were infected with 1000 pfu of wild-type SARS-CoV-2 and fixed in 4% paraformaldehyde every day from 1 to 4 days post infection. OKC sections were stained against SARS-CoV-2 nucleoprotein (NP). Cell nuclei were stained with 4′,6-diamidino-s-phenylindole (DAPI). Pictures were obtained by confocal microscopy. Scalebar = 100 µm.
Figure 4.
Figure 4.
Tropism and dissemination of SARS-CoV-2 in hamster organotypic kidney cultures. Organotypic kidney cultures (OKC) were infected with 1000 pfu of wild-type SARS-CoV-2 and fixed in 4% paraformaldehyde at 1 or 4 days post infection (dpi). (a and b) OKC sections stained against SARS-CoV-2 nucleoprotein (NP) and CD34 (marker of endothelial cells) at day 1 and 4 post infection ((a and b), respectively). (a) is showing the edge of the slice. (b) is showing both the edge and the center of the slice, demonstrating the spread of infection toward the center. (c) OKC sections stained against SARS-CoV-2 NP and (c) aquaporin-1 (marker of proximal tubular epithelial cells). Immunofluorescence images were acquired using confocal microscopy and is representative of three independent experiments. Colocalization of cell type markers (red) with SARS-CoV-2 NP (green) is denoted with arrows. Scalebar = 100 µm.
Figure 5.
Figure 5.
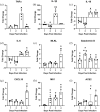
Gene expression analysis of hamster organotypic kidney cultures challenged with SARS-CoV-2. Hamster organotypic kidney cultures were cultured uninfected or infected with 1000 pfu of wild-type SARS-CoV-2 (2019-nCoV/USA_WA/2020) and collected every day from day 1 to day 4 post-infection. In both infected and non-infected slices, gene expression was measured via RT-qPCR as the number of mRNA copies per μg of total RNA and normalized by the standard deviation of GAPDH expression from its average across all days. To calculate the fold changes, values from infected slices were divided by the average values of non-infected slices from the corresponding day. (a–i) Fold change in the expression of (a) TNFα, (b) IL-1β, (c) IL18, (d) IL-6, (e) MLKL, (f) gasdermin D, (g) CXCL10, (h) MX1, (i) ACE2 from day 1 to day 4 post-infection. For each day, mRNA copy numbers per 1 µg of RNA of infected and non-infected samples were compared using the Mann-Whitney U-test. * = p < 0.05; ** = p < 0.01.

Similar articles

Cited by

References

    1. Zhou P, Yang X, Lou, et al.. A pneumonia outbreak associated with a new coronavirus of probable bat origin. Nature 2020; 579: 270–273. - PMC - PubMed
    1. Worldometer. Coronavirus cases, https://www.worldometers.info/coronavirus/ (2022, accessed 11 March 2022).
    1. Xie J, Wu W, Li S, et al.. Clinical characteristics and outcomes of critically ill patients with novel coronavirus infectious disease (COVID-19) in China: a retrospective multicenter study. Intensive Care Med 2020; 46: 1863–1872. - PMC - PubMed
    1. Chan L, Chaudhary K, Saha A, et al.. AKI in hospitalized patients with COVID-19. J Am Soc Nephrol 2021; 32: 151–160. - PMC - PubMed
    1. George JA, Khoza S. SARS-CoV-2 infection and the kidneys: an evolving picture. Adv Exp Med Biol 2021; 1327: 107–118. - PubMed

LinkOut - more resources