. 2022 Aug 24:10:896893.
doi: 10.3389/fcell.2022.896893. eCollection 2022.

Autophagy regulated by the HIF/REDD1/mTORC1 signaling is progressively increased during erythroid differentiation under hypoxia

Affiliations

Autophagy regulated by the HIF/REDD1/mTORC1 signaling is progressively increased during erythroid differentiation under hypoxia

Jian Li et al. Front Cell Dev Biol. .

Abstract

For hematopoietic stem and progenitor cells (HSPCs), hypoxia is a specific microenvironment known as the hypoxic niche. How hypoxia regulates erythroid differentiation of HSPCs remains unclear. In this study, we show that hypoxia evidently accelerates erythroid differentiation, and autophagy plays a pivotal role in this process. We further determine that mTORC1 signaling is suppressed by hypoxia to relieve its inhibition of autophagy, and with the process of erythroid differentiation, mTORC1 activity gradually decreases and autophagy activity increases accordingly. Moreover, we provide evidence that the HIF-1 target gene REDD1 is upregulated to suppress mTORC1 signaling and enhance autophagy, thereby promoting erythroid differentiation under hypoxia. Together, our study identifies that the enhanced autophagy by hypoxia favors erythroid maturation and elucidates a new regulatory pattern whereby autophagy is progressively increased during erythroid differentiation, which is driven by the HIF-1/REDD1/mTORC1 signaling in a hypoxic niche.

Keywords: HIF-1; HSPCs; K562; REDD1; autophagy; erythroid differentiation; hypoxia.


Conflict of interest statement

The authors declare that the research was conducted in the absence of any commercial or financial relationships that could be construed as a potential conflict of interest.

Figures
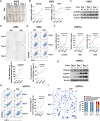
FIGURE 1
FIGURE 1
Hypoxia accelerates erythroid differentiation (A) Reddish pellets of K562 cells in the process of erythroid differentiation under normoxia and hypoxia. Redder pellets indicate more accumulation of hemoglobin (B) qRT-PCR analysis of the relative mRNA levels of specific erythrocyte markers CD235a and HBG. qRT-PCR was performed at the indicated time points after K562 cells were exposed to normoxia or hypoxia during erythroid differentiation. *p < 0.05, **p < 0.01, ***p < 0.001, versus the corresponding normoxia group at different time points (C) Western blot analysis of CD235a and γ-globin protein expression at the indicated time points after K562 cells were exposed to normoxia or hypoxia. N: normoxia; (H) hypoxia (D) Representative images of benzidine staining in K562 cells differentiated into erythrocytes. The line graph below shows the percentage of benzidine-positive cells. Scale Bar = 100 μm ***p < 0.001, versus the corresponding normoxia group. Nor: normoxia; Hyp: hypoxia (E) Flow cytometry plots show the expression of CD235a and CD71 in K562 cells. The line graph below shows the percentage of CD71+/CD235a+ cells. *p < 0.05, **p < 0.01, ***p < 0.001, versus the respective normoxia group (F) qRT-PCR analysis of the relative mRNA levels of CD235a, HBG and HBB in HSPCs. qRT-PCR was performed at the indicated time points after HSPCs were exposed to normoxia or hypoxia during erythroid differentiation. ***p < 0.001, versus the respective normoxia group (G) Western blot analysis of CD235a, γ-globin and β-globin protein expression at the indicated time points after HSPCs were exposed to normoxia or hypoxia during erythroid differentiation. N: normoxia; H: hypoxia (H) Flow cytometry plots show the expression of CD235a and CD71. The line graph on the right shows the percentage of CD71+/CD235a+ cells. ns. not significant, *p < 0.05, **p < 0.01, versus the respective normoxia group (I) May-Grunwald Giemsa staining of HSPCs exposure to normoxia or hypoxia for different periods of time during the process of differentiation into erythrocytes. Representative images were shown for proerythroblasts, basophilic erythroblasts, polychromatic erythroblasts, orthrochromatic erythroblasts and reticulocytes. Scale Bar = 20 μm. The right panel shows the morphologic classification of erythroblasts. Cell types were determined by examining 200 cells per group and expressed as a percentage.
FIGURE 2
FIGURE 2
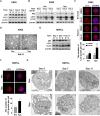
Hypoxia enhances autophagy during erythroid differentiation (A) Western blot analysis of p62 and LC3 protein expression at the indicated time points after K562 cells were exposed to normoxia or hypoxia during erythroid differentiation. N: normoxia; H: hypoxia (B) Western blot analysis of p62 and LC3 protein expression at the indicated time points after K562 cells treated with DMSO (-) as control or Baf A1 (+, 20 nM) were exposed to normoxia or hypoxia. Nor: normoxia; Hyp: hypoxia (C) Immunofluorescence analysis of LC3 puncta in K562 cells differentiated into erythrocytes. K562 cells were treated with DMSO or Baf A1 (20 nM) under normoxia or hypoxia for 48 h. Cell nucleus labeled with hoechst33342 (Hoe) is shown in blue, LC3 staining is shown in red and the merged images display their co-localization. Scale Bar = 5 μm. The graph on the right shows the quantification of LC3 puncta per cell. ns, not significant., ### p < 0.001, versus the respective normoxia group. ** p < 0.01, *** p < 0.001, versus the corresponding DMSO group (D) TEM imaging of K562 cells treated with Baf A1 (20 nM) exposure to normoxia or hypoxia for 72 h. Representative images of autophagosomes are shown at 30000X. Nu: nucleus. Scale Bar = 500 nm (E) Western blot analysis of p62 and LC3 protein expression at the indicated time points after HSPCs differentiated into erythrocytes were exposed to normoxia or hypoxia. N: normoxia; H: hypoxia (F) Immunofluorescence analysis of LC3 puncta in HSPCs-derived erythrocytes. HSPCs were induced into erythrocytes under normoxia or hypoxia conditions for 7 days. Cell nucleus labeled with hoechst33342 (Hoe) is shown in blue, LC3 staining is shown in red and the merged images display their co-localization. Scale Bar = 5 μm. The graph below shows the quantification of LC3 puncta per cell. *** p < 0.001, versus the normoxia group (G) TEM imaging of HSPCs-differentiated erythrocytes cultured under normoxia or hypoxia. Nu: nucleus. Scale Bar = 1 μm.
FIGURE 3
FIGURE 3
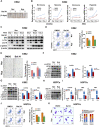
Autophagy mediates erythroid differentiation promoted by hypoxia (A) Reddish pellets of K562 cells differentiated into erythrocytes treated with DMSO or Baf A1 (20 nM) under normoxia and hypoxia. The red color of pellets was lightened by Baf A1 in both normoxia and hypoxia (B) qRT-PCR analysis of the relative mRNA levels of CD235a and HBG at the indicated time points after K562 cells treated with DMSO (-) as control or Baf A1 (+, 20 nM) were induced into erythroid differentiation under normoxia or hypoxia conditions. **p < 0.01; ***p < 0.001. versus the respective normoxia group at different time points (C) Western blot analysis of p62, LC3 and γ-globin protein expression at the indicated time points after K562 cells differentiated into erythrocytes were treated with DMSO (-) as control or Baf A1 (+, 20 nM) under normoxia or hypoxia. Nor: normoxia; Hyp: hypoxia (D) Flow cytometry plots show the expression of CD235a and CD71 in K562 cells differentiated into erythrocytes that were treated with DMSO (-) as control or Baf A1 (+, 20 nM) under normoxia or hypoxia for 3 days. The graph on the right shows the percentage of CD71+/CD235a+ cells. ***p < 0.001, versus the DMSO group under normoxia. ### p < 0.001, versus the respective DMSO group under normoxia or hypoxia (E) Representative images of benzidine staining in K562 cells treated the same as (D). The right graph shows the percentage of benzidine-positive cells. Scale Bar = 100 μm ***p < 0.001, versus the DMSO group under normoxia. ### p < 0.001. versus the respective DMSO group under normoxia or hypoxia. Nor: normoxia; Hyp: hypoxia (F,G) The left panel shows the western blot analysis of the effects of ATG5/ATG7 knockdown on p62, LC3, CD235a and γ-globin protein expression in K562 cells differentiated into erythrocytes that were transfected with scramble siRNA as negative control (NC) or si-ATG5/ATG7 under normoxia or hypoxia for 3 days. The two panels on the right show the qRT-PCR analysis of the relative mRNA levels of CD235a and HBG. ***p < 0.001, versus the NC group under normoxia. ## p < 0.01, ### p < 0.001. versus the respective NC group under normoxia or hypoxia (H) Western blot analysis of the effects of Baf A1 (20 nM) on LC3, γ-globin and β-globin protein expression in HSPCs-differentiated erythrocytes which were treated with DMSO or Baf A1 under normoxia or hypoxia for 7 days (I) qRT-PCR analysis of the effects of Baf A1 on CD235a, γ-globin and β-globin mRNA expression in HSPCs-differentiated erythrocytes treated the same as (H). ***p < 0.001, versus the DMSO group under normoxia. ns: not significant, # p < 0.05, ## p < 0.01, ### p < 0.001. versus the respective DMSO group under normoxia or hypoxia (J) Flow cytometry plots show the expression of CD235a and CD71 in HSPCs-differentiated erythrocytes treated the same as (H) and (I). The graph on the right shows the percentage of CD71+/CD235a+ cells. **p < 0.01, versus the DMSO group under normoxia. ### p < 0.001. versus the respective DMSO group under normoxia or hypoxia (K) May-Grunwald Giemsa staining of HSPCs-differentiated erythrocytes which were treated with DMSO or Baf A1 (20 nM) under normoxia or hypoxia for 11 days. Scale Bar = 20 μm. The right panel shows the morphologic classification. Cell types were determined by examining 200 cells per group and expressed as a percentage.
FIGURE 4
FIGURE 4
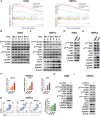
Suppression of mTORC1 is required for inducing autophagy and accelerating erythroid differentiation under hypoxia (A) After K562 cells (left) and HSPCs (right) differentiated erythrocytes were exposed to normoxia or hypoxia for 3 day and 7 days, respectively, RNA-seq was performed, and then GSEA was used to analyze the major pathways related to hypoxia. NES, normalized enrichment score (B,C) Western blot shows the effects of hypoxia on p62, LC3, γ-globin or β-globin protein levels and mTORC1 activity at different time points in the process of erythroid differentiation of K562 cells or HSPCs (D,E) Western blot analysis of the effects of Rapa (100 nM) on p62, LC3, CD235a, γ-globin or β-globin protein levels and mTORC1 activity in K562- or HSPCs-differentiated erythrocytes under normoxia (F) qRT-PCR analysis of the relative mRNA levels of CD235a, HBG and HBB after HSPCs were differentiated into erythrocytes which were treated with DMSO or different concentrations of Rapa for 3 days from the fourth day to the seventh day of differentiation under normoxia. ns, not significant, **p < 0.01, ***p < 0.001, versus the DMSO group (G) Flow cytometry plots show the expression of CD235a and CD71 in HSPCs-differentiated erythrocytes treated the same as (F). The graph on the right shows the percentage of CD71+/CD235a+ cells. **p < 0.01, ***p < 0.001. versus the DMSO group (H,I) Western blot analysis of the effects of TSC2 knockdown on p62, LC3, CD235a, γ-globin or β-globin protein levels and mTORC1 activity in K562 cells- or HSPCs-differentiated erythrocytes under hypoxia.
FIGURE 5
FIGURE 5
REDD1 upregulates autophagy through inhibition of mTORC1 signaling under hypoxia (A) Western blot analysis of HIF-1α and REDD1 protein expression at the indicated time points after K562 cells- and HSPCs-differentiated erythrocytes were exposed to normoxia or hypoxia. N: normoxia; H: hypoxia (B) qRT-PCR analysis of the relative mRNA levels of REDD1 in K562- and HSPCs-differentiated erythrocytes under normoxia or hypoxia. **p < 0.01, ***p < 0.001, versus the respective normoxia group at different time points (C,D) Western blot analysis of the effects of REDD1 knockdown on p62, LC3, CD235a, γ-globin or β-globin protein levels and mTORC1 activity in K562 cells- or HSPCs-differentiated erythrocytes cultured under hypoxia (E) Flow cytometry plots show the effects of REDD1 knockdown on CD71 and CD235a expression in K562 cells- and HSPCs-differentiated erythrocytes under hypoxia, respectively. The respective graph on the right shows the percentage of CD71+/CD235a+ cells. *p < 0.05, **p < 0.01, versus the NC group (F) Representative images of benzidine staining on the 3rd day of differentiation of K562 cells with or without REDD1 knockdown under hypoxia. Scale Bar = 100 μm. The graph on the right shows the percentage of benzidine-positive cells. **p < 0.01, versus the NC group (G) May-Grunwald Giemsa staining on the seventh day of differentiation of HSPCs shows the effect of REDD1 knockdown in hypoxia conditions on morphologic changes of erythrocytes. Scale Bar = 20 μm. The graph shows the percentage of different types of erythroblasts.
FIGURE 6
FIGURE 6
Schematic diagram of hypoxia accelerating erythroid differentiation in HSPCs. The left panel shows the underlying mechanism of hypoxia accelerating erythroid differentiation. Under hypoxia, HIF-1 as a master transcription factor transcriptionally activates its target gene REDD1, which in turn inhibits mTORC1 activity, thereby promoting autophagy activity and hence accelerating erythroid differentiation. The central panel shows the pattern of erythroid differentiation under the control of mTORC1 and autophagy in normoxia and hypoxia conditions. Under normoxia, with the process of erythroid differentiation, the activity of mTORC1 gradually decreases and the autophagy activity increases concomitantly; under hypoxia, these trends are enhanced, thus accelerating the erythroid differentiation. The right panel shows the icons.

Similar articles

Cited by

References

    1. Allen E. A., Baehrecke E. H. (2020). Autophagy in animal development. Cell Death Differ. 27 (3), 903–918. 10.1038/s41418-020-0497-0 - DOI - PMC - PubMed
    1. Arai F., Suda T. (2008). Quiescent stem cells in the niche. Cambridge (MA): StemBook. - PubMed
    1. Balise V. D., Saito-Reis C. A., Gillette J. M. (2020). Tetraspanin scaffold proteins function as key regulators of hematopoietic stem cells. Front. Cell Dev. Biol. 8, 598. 10.3389/fcell.2020.00598 - DOI - PMC - PubMed
    1. Bapat A., Schippel N., Shi X., Jasbi P., Gu H., Kala M., et al. (2021). Hypoxia promotes erythroid differentiation through the development of progenitors and proerythroblasts. Exp. Hematol. 97, 32–46 e35. 10.1016/j.exphem.2021.02.012 - DOI - PMC - PubMed
    1. Blagosklonny M. V. (2013). Hypoxia, MTOR and autophagy: converging on senescence or quiescence. Autophagy 9 (2), 260–262. 10.4161/auto.22783 - DOI - PMC - PubMed

LinkOut - more resources