. 2022 Sep 9;5(1):944.
doi: 10.1038/s42003-022-03867-y.

Peroxisomal very long-chain fatty acid transport is targeted by herpesviruses and the antiviral host response

Affiliations

Peroxisomal very long-chain fatty acid transport is targeted by herpesviruses and the antiviral host response

Isabelle Weinhofer et al. Commun Biol. .

Abstract

Very long-chain fatty acids (VLCFA) are critical for human cytomegalovirus replication and accumulate upon infection. Here, we used Epstein-Barr virus (EBV) infection of human B cells to elucidate how herpesviruses target VLCFA metabolism. Gene expression profiling revealed that, despite a general induction of peroxisome-related genes, EBV early infection decreased expression of the peroxisomal VLCFA transporters ABCD1 and ABCD2, thus impairing VLCFA degradation. The mechanism underlying ABCD1 and ABCD2 repression involved RNA interference by the EBV-induced microRNAs miR-9-5p and miR-155, respectively, causing significantly increased VLCFA levels. Treatment with 25-hydroxycholesterol, an antiviral innate immune modulator produced by macrophages, restored ABCD1 expression and reduced VLCFA accumulation in EBV-infected B-lymphocytes, and, upon lytic reactivation, reduced virus production in control but not ABCD1-deficient cells. Finally, also other herpesviruses and coronaviruses target ABCD1 expression. Because viral infection might trigger neuroinflammation in X-linked adrenoleukodystrophy (X-ALD, inherited ABCD1 deficiency), we explored a possible link between EBV infection and cerebral X-ALD. However, neither immunohistochemistry of post-mortem brains nor analysis of EBV seropositivity in 35 X-ALD children supported involvement of EBV in the onset of neuroinflammation. Collectively, our findings indicate a previously unrecognized, pivotal role of ABCD1 in viral infection and host defence, prompting consideration of other viral triggers in cerebral X-ALD.


Conflict of interest statement

The authors declare no competing interests.

Figures

Fig. 1
Fig. 1. EBV infection increases VLCFA levels in B cells.
a, b The fatty acid concentrations of C26:0, C24:0, C22:0, and C16:0 were determined by GC-MS in primary B cells isolated from the blood of healthy controls (n = 5) and X-ALD patients (n = 5) as well as in in vitro EBV infected and immortalized B lymphocytes from controls (n = 10) or X-ALD patients (n = 22). The relative amounts of C24:0 (a) and C26:0 (b) displayed either as ratio to C22:0 or C16:0 are shown. The bar graphs show mean ± S.D. of the indicated values; *P ≤ 0.05, **P ≤ 0.01, ***P ≤ 0.001 (two-tailed unpaired Student’s t-test, correction for multiple testing by Bonferroni adjustment). c The levels of saturated long-chain and very long-chain (≥C22) fatty acids (FA) were determined by ESI-MS 5 days post infection of primary B cells from 7 healthy donors with EBV in vitro (MOI = 10). For C20:0, C24:0, and C26:0, the quantification was limited to n = 3, n = 4, and n = 6, respectively, due to low abundance and associated detection limits of these fatty acids. The data are depicted as boxplots (median ± interquartile range). *P ≤ 0.05, two-tailed nested Student’s t-test.
Fig. 2
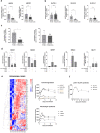
Fig. 2. Expression dynamics of genes related to peroxisomes and VLCFA synthesis during EBV infection.
a, b Comparison of primary B cells and EBV-immortalized B lymphocytes. RNA was isolated from primary B cells (healthy controls, n = 4–7, black circles; X-ALD patients, n = 4–5, black rhombs) and EBV-infected and immortalized B lymphocytes (healthy controls, n = 10–11, black squares; X-ALD patients, n = 20–22, black inverted triangles) and RT-qPCR was carried out for ABCD1, ABCD2, ELOVL1, ELOVL3, and ELOVL7. Data were normalized to HPRT. The bar graphs show mean ± S.D. of the indicated values. For statistical analysis, two-tailed unpaired Student´s t-test was used (***P ≤ 0.001; n.s. = non significant). c Degradation rates of C26:0 (left) and C16:0 (right) by peroxisomal and mitochondrial β-oxidation, respectively, were determined in primary B cells (n = 3) and EBV-infected and immortalized B lymphocytes (n = 3) from healthy controls. The bar graphs show mean ± S.D. of the indicated values. For statistical analysis, two-tailed unpaired Student´s t-test was used (*P ≤ 0.05). d Expression profile of primary B cells before and after EBV infection. RNA was isolated from primary B cells of healthy donors (n = 3–5) before and at one or two days post infection (dpi) with EBV in vitro. RT-qPCR was carried out for the ABCD1 and ABCD2 genes with viral EBNA1, BHRF1, and BZLF1 serving as controls for successful infection. HPRT was used for normalization purposes. The bar graphs show mean ± S.D. of the indicated values. For statistical analysis, two-tailed ratio paired Student´s t-test was used (*P ≤ 0.05, **P ≤ 0.01). e, f Time-resolved RNA-Seq data from B cells, isolated from three healthy donors and infected in vitro with EBV, was retrieved from Mrozek-Gorska et al.. Data normalized by Mrozek-Gorska and colleagues for sequencing depth using size factors were imported into the Qlucore Omics Explorer, where log-transformation and scaling with Z-score was carried out. Heatmap and graphs of peroxisome-related genes (e) and elongase encoding genes involved in saturated LCFA and VLCFA synthesis (f) at different time points following infection. Depicted data points are means of three donors ± S.D.
Fig. 3
Fig. 3. The peroxisomal VLCFA transporters ABCD1 and ABCD2 are targets of EBV-induced miRNAs.
a, e Schematic diagrams of the 3′-UTR of the human ABCD1 (1044 bp) and ABCD2 (1496 bp) cDNAs. The relative locations of the putative miR-9-5p (TS1: nt 533–538, TS2: nt 862–868) and miR-155 (TS1: nt 128–134, TS2: nt 177–182, and TS3:195–199) target sites are shown as grey boxes. b, f RT-qPCR analysis of miR-9-5p and miR-155 expression in primary B cells (n = 7–8) and EBV-immortalized B lymphocytes (n = 33). The miRNA levels were normalized to the small non-coding RNA, RNU6B, as unregulated reference. The mean is indicated by a horizontal line. c, d, g, h Luciferase reporter assays in HEK-293 cells harbouring ABCD1- (c) or ABCD2- (g) 3′-UTR constructs and a β-actin-3′-UTR (negative control) construct co-transfected with either miR-9-5p, miR-155 or non-targeting negative control mimics as indicated. The data is displayed as percentage of Renilla/Firefly luciferase activity ratio (mean ± S.D.) relative to that of cells transfected with negative control mimics. Each data point represents an independent transfection experiment. In the mutated ABCD1-3′-UTR constructs M-TS1, MT-S2, M-TS1/TS2, and M∆-TS1/TS2 (d) or ABCD2-3′-UTR constructs M-TS1, M-TS2, M-TS3, M-TS1/TS2/TS3 and M∆-TS1/TS2/TS3 (h), the putative miR-9-5p or miR-155 binding sites were either in vitro mutagenized (M) or deleted (MΔ). *p ≤ 0.05, **p ≤ 0.01, ***p ≤ 0.001 (two-tailed unpaired Student’s t-test, correction for multiple testing by Bonferroni adjustment).
Fig. 4
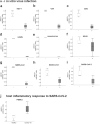
Fig. 4. ABCD1 expression is targeted by herpes- and coronaviruses.
Transcriptomics datasets from herpes- or coronavirus in vitro-infected human cells (−, mock-infected; +, virus infected) or from peripheral blood mononuclear cells (PBMCs) derived from COVID-19 patients were retrieved from Gene Expression Omnibus database files. The data are depicted as boxplots (median ± interquartile range). a HSV-1 infected primary fibroblasts 9 h post infection (pi) (MOI = 10, two biological replicates, GSE129582); b VZV infected melanoma cells, 36 h pi (two biological replicates, GSE85493); c EBV infected gastric cancer cells, 48 h pi (5 replicates, GSE135644); d HCMV infected lung fibroblasts, 72 h pi (MOI = 10, two biological replicates, GSE99454); e roseolovirus infected T lymphoblastoid cells, 72 h pi (MOI = 20, one biological replicate, GSE149808); f KSHV infected Tert-immortalized microvascular endothelial cells, 48 h pi (three replicates, GSE27136); g MERS-CoV infected bronchial epithelial cells, 24 h pi (MOI = 5, three replicates, GSE45042); h SARS-CoV-1 infected bronchial epithelial cells, 3 h pi (MOI = 5, three replicates, GSE33267); i SARS-CoV-2 infected iPSC-cardiomyocytes, 72 h pi (MOI = 0.1, three replicates, GSE150392); j PBMCs derived from three COVID-19 patients and three controls (CRA002390, https://bigd.big.ac.cn/). Arbitrary units on the y-axis represent normalized variable values that were obtained using the default settings to Z-score normalization in the Qlucore Software 3.5 (mean zero and standard deviation 1). For data sets including longitudinal sampling, time courses are shown in Supplementary Fig. 5. Log2 fold changes and P-values are shown in Supplementary Table 3.
Fig. 5
Fig. 5. The antiviral mediator 25-hydroxycholesterol lowers cellular VLCFA levels and interferes with EBV reproduction.
In vitro EBV-infected and immortalized B lymphocytes from healthy controls were supplemented with either 25-HC (2 µM) or vehicle (ethanol, EtOH). a After 48 h, the degradation of C26:0 was determined and displayed as the C26:0 β-oxidation rate normalized to protein content (n = 9). The bar graphs show mean ± S.D. of the indicated values. b The cellular amounts of C22:0, C24:0 and C26:0 were determined by GC-MS after 3 weeks of treatment. The levels of C24:0 and C26:0 are displayed as ratio to C22:0 (n = 9). The mean is indicated by a horizontal line ± S.D. c RNA was isolated after 24 h and RT-qPCR was carried out for ABCD1 and ELOVL1 (n = 6). The mean is indicated by a horizontal line ± S.D. Data were normalized to HPRT mRNA levels and displayed as fold change compared to vehicle-treated cells. d Protein extracts for Western blot analysis were prepared after 48 h of supplementation with 25-HC or EtOH. The relative amount of ABCD1 protein was normalized to the β-actin level. One representative immunoblot from one B lymphocyte line with 3 (untreated) and 4 (25-HC treated) technical replicates is shown; quantification was conducted using three different B lymphocyte lines. The bar graphs show mean ± S.D. of the indicated values. Uncropped western blot images are shown in Supplementary Fig. 8. e EBV-immortalized B lymphocytes derived from X-ALD patients (n = 18–20) or healthy controls (n = 6–10) were treated with either 25-HC (2 µM) or EtOH for either 1 or 3 weeks before lytic virus replication was induced by PMA/sodium butyrate. EBV particle number was determined in the cell free supernatant by qPCR for BALF5 in the EBV genome. The data are depicted as boxplots (median ± interquartile range). For statistical analysis, two-tailed paired Student’s t-test was used (*P ≤ 0.05, **P ≤ 0.01). In (c) and (e), the raw values used to generate the fold-change display were used for statistical analysis. f Model of EBV targeting VLCFA metabolism and peroxisomes (left panel) and how 25-HC impedes viral reproduction (right panel). EBV infection of B cells results in rapid miRNA-mediated downregulation of the peroxisomal VLCFA importers ABCD1 and ABCD2. This occurs despite a general induction of peroxisome-related genes such as those encoding proteins involved in peroxisome proliferation and biogenesis (c.f. Fig. 2e), possibly indicating increased peroxisome numbers. The impaired peroxisomal degradation of VLCFAs but concurrent upregulation of VLCFA synthesis via the fatty acid elongase ELOVL1 leads to increased cellular VLCFA levels, possibly necessary to establish latency. Upon stimulation of EBV lytic replication, the antiviral metabolite 25-hydroxycholesterol interferes with EBV reproduction, among other, by opposite regulation of ABCD1 (up) and ELOVL1 (down), thus resulting in net VLCFA catabolism and preventing cellular accumulation of VLCFAs.

Similar articles

Cited by

References

    1. Bjornevik, K. et al. Longitudinal analysis reveals high prevalence of Epstein-Barr virus associated with multiple sclerosis. Science10.1126/science.abj8222 (2022). - PubMed
    1. Houen G, Trier NH, Frederiksen JL. Epstein-Barr virus and multiple sclerosis. Front. Immunol. 2020;11:587078. doi: 10.3389/fimmu.2020.587078. - DOI - PMC - PubMed
    1. Lange, P. T., Lagunoff, M. & Tarakanova, V. L. Chewing the fat: The conserved ability of DNA viruses to Hijack cellular lipid metabolism. Viruses10.3390/v11020119 (2019). - PMC - PubMed
    1. Jean Beltran PM, et al. Infection-induced peroxisome biogenesis is a metabolic strategy for herpesvirus replication. Cell Host Microbe. 2018;24:526–541.e527. doi: 10.1016/j.chom.2018.09.002. - DOI - PMC - PubMed
    1. Koyuncu E, Purdy JG, Rabinowitz JD, Shenk T. Saturated very long chain fatty acids are required for the production of infectious human cytomegalovirus progeny. PLoS Pathog. 2013;9:e1003333. doi: 10.1371/journal.ppat.1003333. - DOI - PMC - PubMed

Publication types