. 2022 Sep 8;12(1):371.
doi: 10.1038/s41398-022-02132-4.

Early impairment of cortical circuit plasticity and connectivity in the 5XFAD Alzheimer's disease mouse model

Affiliations

Early impairment of cortical circuit plasticity and connectivity in the 5XFAD Alzheimer's disease mouse model

Chang Chen et al. Transl Psychiatry. .

Abstract

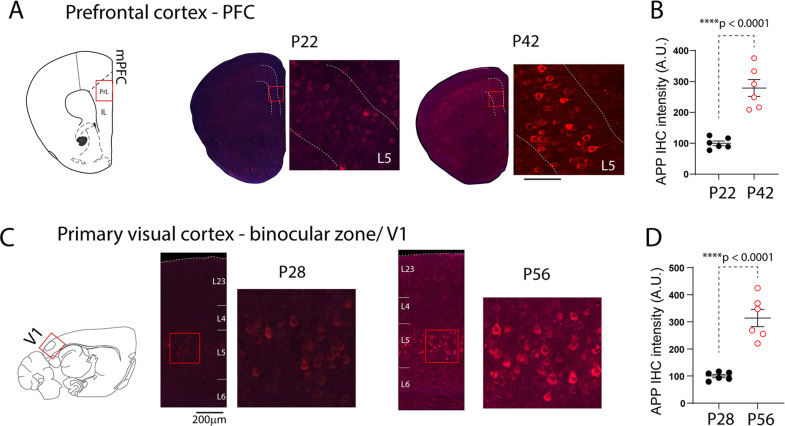
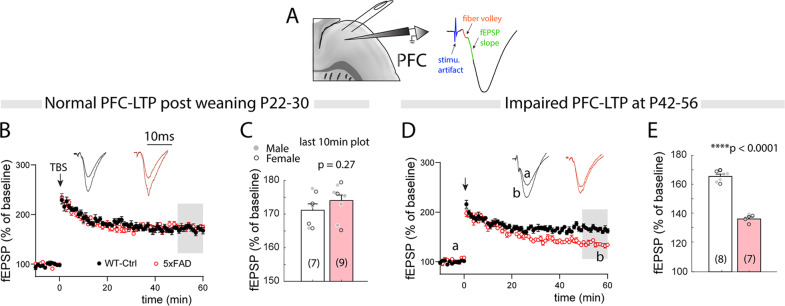
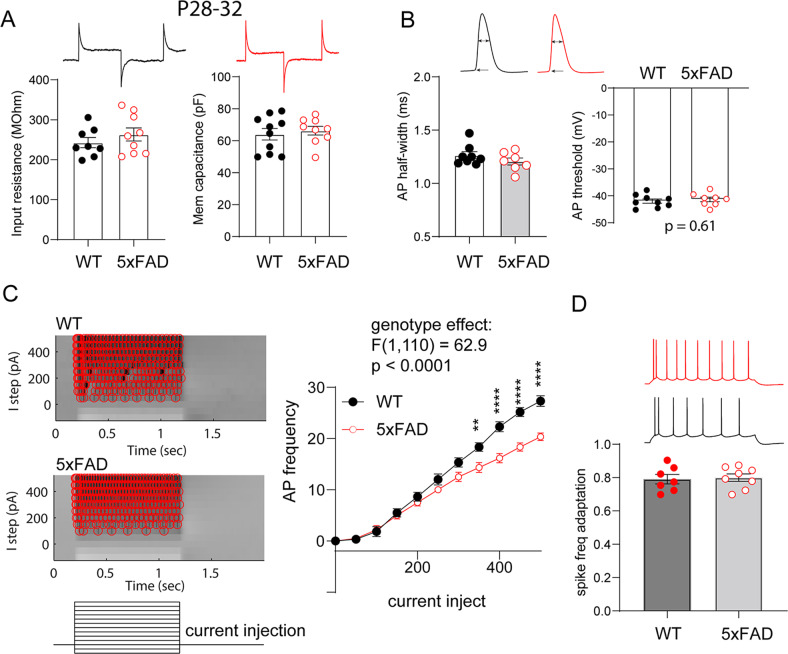
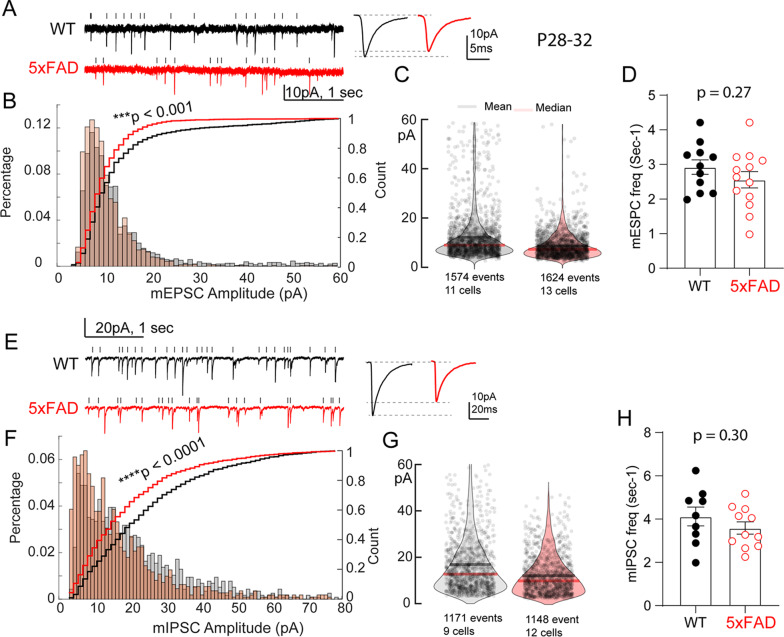
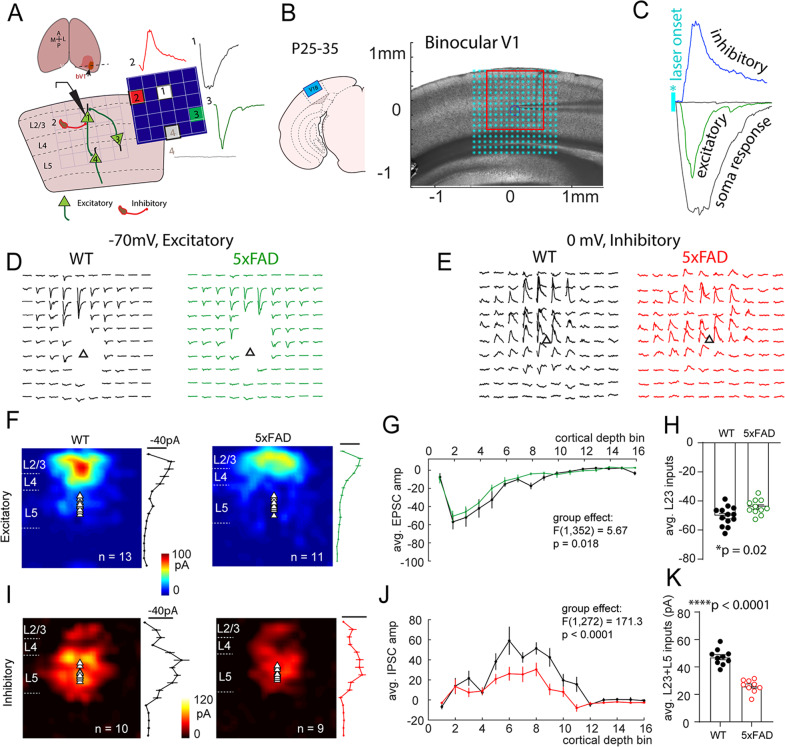
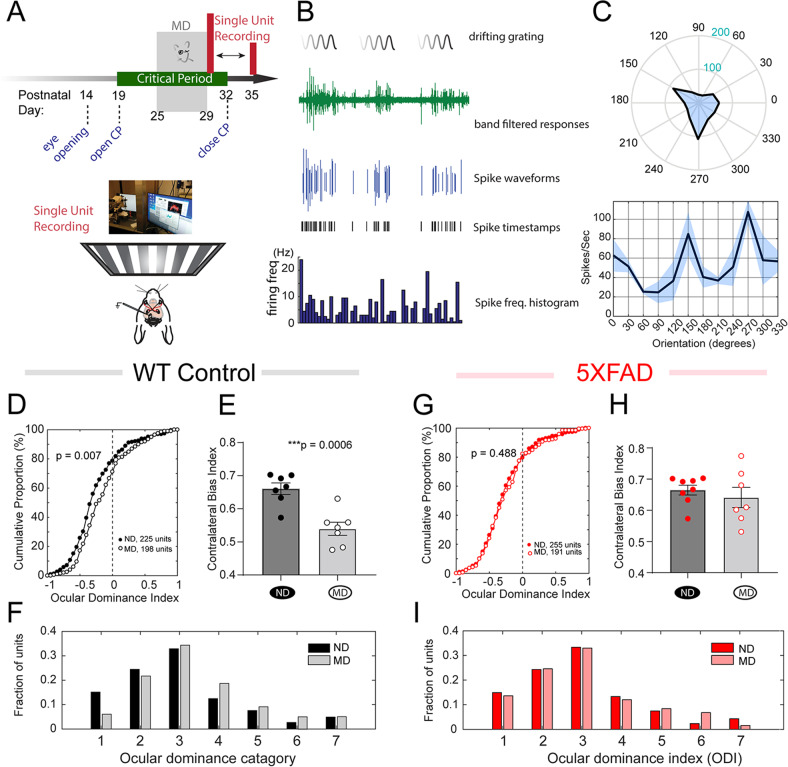
Genetic risk factors for neurodegenerative disorders, such as Alzheimer's disease (AD), are expressed throughout the life span. How these risk factors affect early brain development and function remain largely unclear. Analysis of animal models with high constructive validity for AD, such as the 5xFAD mouse model, may provide insights on potential early neurodevelopmental effects that impinge on adult brain function and age-dependent degeneration. The 5XFAD mouse model over-expresses human amyloid precursor protein (APP) and presenilin 1 (PS1) harboring five familial AD mutations. It is unclear how the expression of these mutant proteins affects early developing brain circuits. We found that the prefrontal cortex (PFC) layer 5 (L5) neurons in 5XFAD mice exhibit transgenic APP overloading at an early post-weaning age. Impaired synaptic plasticity (long-term potentiation, LTP) was seen at 6-8 weeks age in L5 PFC circuit, which was correlated with increased intracellular APP. APP overloading was also seen in L5 pyramidal neurons in the primary visual cortex (V1) during the critical period of plasticity (4-5 weeks age). Whole-cell patch clamp recording in V1 brain slices revealed reduced intrinsic excitability of L5 neurons in 5XFAD mice, along with decreased spontaneous miniature excitatory and inhibitory inputs. Functional circuit mapping using laser scanning photostimulation (LSPS) combined with glutamate uncaging uncovered reduced excitatory synaptic connectivity onto L5 neurons in V1, and a more pronounced reduction in inhibitory connectivity, indicative of altered excitation and inhibition during VC critical period. Lastly, in vivo single-unit recording in V1 confirmed that monocular visual deprivation-induced ocular dominance plasticity during critical period was impaired in 5XFAD mice. Our study reveals plasticity deficits across multiple cortical regions and indicates altered early cortical circuit developmental trajectory as a result of mutant APP/PS1 over-expression.


Conflict of interest statement

The authors declare no competing interests.

Figures

Fig. 1
Fig. 1. Age-dependent transgenic APP/Aβ overloading in L5 neurons in PFC and VC.
A Immunohistochemistry staining for APP/Aβ using the 6E10 antibody. L5 neurons show immunoreactivity of APP/Aβ in prefrontal cortex at P22, with much stronger labeling at P42. B Intraneuronal APP/Aβ immunoreactivity was significantly stronger in P42 compared to that from P22 (t10 = 6.35, n = 6 mice/group, ****p < 0.0001). C APP/Aβ immunolabeling in L5 pyramidal neurons in the primary visual cortex (V1) at P28 and P56. D Quantification of APP/Aβ signals show a significant increase in V1-L5 neurons at P56 (t10 = 6.67, n = 6 mice/group, ****p < 0.0001).
Fig. 2
Fig. 2. 5xFAD mice show impaired PFC-L5 LTP at 6–8 weeks age.
A Schematic illustration of fEPSP recording from L5 in sagittal PFC slices. B 5XFAD slices from P22–30 mice show similar levels of LTP induction and maintenance compared to WT littermates. C Quantification of LTP magnitude of the last 10 min post-induction recordings show no significant change (WT, n = 7 mice; 5XFAD, n = 9 mice. t14 = 1.15, p = 0.27). Open markers for bar graph, female; closed markers, male. D PFC-L5 LTP magnitude in 5XFAD mice was dramatically reduced at age P42–56. E Quantification of the last 10 min LTP recordings show significant reduction in 5XFAD slices (WT, n = 8 mice; 5XFAD, n = 7 mice. t13 = 16.9, ****p < 0.0001).
Fig. 3
Fig. 3. Reduced intrinsic excitability of VC-L5 neurons in P28–32 5XFAD mice.
A VC-L5 neurons from 5XFAD brain slices show similar membrane input resistance (WT, n = 8 cells/5 mice; 5XFAD, n = 9 cells/6 mice. t15 = 0.96, p = 0.35) and membrane capacitance (WT, n = 10 cells/5 mice; 5XFAD, n = 9 cells/6 mice. t17 = 0.48, p = 0.63) compared to WT littermate L5 neurons. Representative current responses to voltage steps are on the top, based on which membrane properties are calculated. B VC-L5 neurons from 5XFAD mice exhibit similar action potential half-width (WT, n = 8 cells/5 mice; 5XFAD, n = 7 cells/6 mice. t13 = 1.22, p = 0.25) and AP threshold (WT, n = 9 cells/5 mice; 5XFAD, n = 8 cells/6 mice. t15 = 0.53, p = 0.61). C Representative action potential density plot from 5XFAD and WT VC-L5 neurons. Intrinsic excitability responses, measured by AP firing in response to current step injections (−100 to 500pA, with 50pA increment), was shown to the right. VC-L5 neurons from 5XFAD slices show reduced AP number in response to current injections (WT, n = 6 cells/5 mice; 5XFAD, n = 6 cells/5 mice. Repeated measures two-way ANOVA, genotypes effects: F(1,10) = 9.6, p = 0.011). A significantly lower AP firing at higher current steps (350–500pA) was observed (Sidak’s post hoc multiple comparison test. **p < 0.01, ****p < 0.0001). D 5XFAD VC-L5 neurons show similar spike frequency adaptation compared to WT neurons (WT, n = 7 cells/5 mice; 5XFAD, n = 8 cells/7 mice. t13 = 0.26, p = 0.80).
Fig. 4
Fig. 4. 5XFAD VC-L5 neurons show reduced spontaneous synaptic mEPSC and mIPSC inputs during critical period (P28–32).
A Representative whole cell patch clamp recording (5-sec traces) of spontaneous mEPSC from 5XFAD and WT neurons. Vertical ticks indicate time stamps for detected mEPSCs. B A larger percentage of mEPSC amplitudes from 5XFAD neurons distributes to the smaller amplitude bins. There was significant difference between the two cumulative distribution curves (K-S test, D = 0.204, ***P < 0.001). C Violin plot of all mEPSC amplitudes from both groups. D 5XFAD VC-L5 neurons did not differ in mEPSC frequency (WT, n = 11 cells/6 mice; 5XFAD, n = 13 cells/7 mice. p = 0.27). E Representative traces of spontaneous mIPSCs (4-sec traces) from 5XFAD and WT neurons. F A larger fraction of mIPSC amplitudes from 5XFAD neurons also distributed to the lower amplitude bin, with a significant difference in the cumulative distribution curves (K-S test, D = 0.124, ****p < 0.0001). G Violin plot of all analyzed mIPSC amplitudes from both groups. H 5XFAD neurons showed similar mIPSC frequency (WT, n = 9 cells/6 mice; 5XFAD, n = 11 cells/7 mice. p = 0.30).
Fig. 5
Fig. 5. VC-L5 neurons from 5XFAD mice show reduced intracortical synaptic connectivity during critical period.
A Schematic illustration of a VC slice preparation, LSPS mapping in which different stimulus (laser uncaging) locations relative to recorded V5 neurons lead to direct soma (1), inhibitory (2), or excitatory synaptic (3) currents. B Illustration and digital image of VC slice with registered LSPS mapping grid. LSPS mapping was performed on the L5 pyramidal neuron. A 16 × 16 stimulus grid was centered on bV1 with top row aligned with pia surface. Cyan asterisks indicate glutamate uncaging locations. C LSPS mapping/glutamate uncaging at different locations can elicit direct soma responses, excitatory synaptic responses (EPSC), inhibitory synaptic response (IPSC), or no response. D Representative 10 × 10 mapping traces (corresponding to red square areas in B) of excitatory responses from 5XFAD and WT neurons. Traces contaminated by direct soma responses were removed from display. Triangle indicates soma location. E Representative 10 × 10 mapping traces of inhibitory responses from 5XFAD and WT neurons. F Averaged excitatory connectivity map from WT (n = 13 cells/8 mice) and 5XFAD (n = 11 cells/8 mice) neurons. Averaged strength of synaptic inputs binned by cortical layers are plotted to the right. G 5XFAD neurons show significantly altered laminar inputs (main effect of group, F(1,352) = 5.67, p = 0.018. Two-way ANOVA). H Combined L2/3 inputs from 5XFAD neurons show a significant reduction in connectivity strength (*p = 0.02). I Averaged inhibitory connectivity map from WT (n = 10 cells/8 mice) and 5XFAD (n = 9 cells/7 mice) neurons. Averaged strength of inhibitory synaptic inputs binned by cortical layers are plotted to the right. J 5XFAD neurons show significantly altered laminar inputs (F(1,272) = 171.3, ****p < 0.0001. Two-way ANOVA). K Combined inhibitory inputs from L2/3 and L5 also show a significant reduction in 5XFAD neurons (t17 = 8.6, ****p < 0.0001).
Fig. 6
Fig. 6. 5XFAD mice show impaired VC critical period plasticity.
A Experimental paradigm. Mice were subjected to a 4-day MD starting at P25. Single unit recording was conducted in response to visual stimulation at P29–35. B Representative single unit responses to visual stimulations. Also plotted are extracted spike waveforms, spike time stamps and frequency histogram. C A representative single unit response to orientation tuning. D Responses of WT control neurons to MD. Cumulative distribution curves for calculated ODI values from all units for both none-deprived/ND (n = 225 units/7 mice) and deprived/MD (n = 198 units/7 mice). MD has a significant effect on ODI value distribution (p = 0.007, K-S test) in WT mice. E Comparison of CBI values between ND and MD mice in WT littermate controls (CBI scores: non-deprived/ND, 0.67 ± 0.017; monocular deprived/MD, 0.54 ± 0.019. t12 = 4.59, ***p = 0.0006). F Distribution of all sorted single units across the seven ODI categories from ND and MD groups in WT littermate control mice (ND, n = 225 units/7 mice; MD, n = 198 units/7 mice. p = 0.007, K-S test). G Responses of 5XFAD bV1 neurons to MD. Cumulative distribution curves for calculated ODI values from all units for both none-deprived/ND (n = 255 units/8 mice) and deprived/MD (n = 191 units/7 mice). MD does not significantly change ODI value distribution (p = 0.49, K-S test) in 5XFAD mice. H Comparison of CBI values between ND and MD mice in 5XFAD mice (CBI scores: ND, 0.66 ± 0.016, n = 8 mice; MD, 0.64 ± 0.032, n = 7 mice. t13 = 0.68, p = 0.51). I Distribution of all sorted single units across the seven ODI categories from ND and MD groups in 5XFAD mice. MD has no significant effect on ODI value distribution (ND, n = 255 units/8 mice; MD, n = 191 units/7 mice. p = 0.85, K-S test).

Similar articles

Cited by

References

    1. Dubois B, Villain N, Frisoni GB, Rabinovici GD, Sabbagh M, Cappa S, et al. Clinical diagnosis of Alzheimer’s disease: recommendations of the International Working Group. Lancet Neurol. 2021;20:484–96. doi: 10.1016/S1474-4422(21)00066-1. - DOI - PMC - PubMed
    1. Panza F, Lozupone M, Logroscino G, Imbimbo BP. A critical appraisal of amyloid-beta-targeting therapies for Alzheimer disease. Nat Rev Neurol. 2019;15:73–88. doi: 10.1038/s41582-018-0116-6. - DOI - PubMed
    1. Yu M, Sporns O, Saykin AJ. The human connectome in Alzheimer disease - relationship to biomarkers and genetics. Nat Rev Neurol. 2021;17:545–63. doi: 10.1038/s41582-021-00529-1. - DOI - PMC - PubMed
    1. Palmqvist S, Scholl M, Strandberg O, Mattsson N, Stomrud E, Zetterberg H, et al. Earliest accumulation of beta-amyloid occurs within the default-mode network and concurrently affects brain connectivity. Nat Commun. 2017;8:1214. doi: 10.1038/s41467-017-01150-x. - DOI - PMC - PubMed
    1. Sperling RA, Laviolette PS, O’Keefe K, O’Brien J, Rentz DM, Pihlajamaki M, et al. Amyloid deposition is associated with impaired default network function in older persons without dementia. Neuron. 2009;63:178–88. doi: 10.1016/j.neuron.2009.07.003. - DOI - PMC - PubMed

Publication types

Substances