. 2022 Sep 7;13(1):5258.
doi: 10.1038/s41467-022-32828-6.

High p16 expression and heterozygous RB1 loss are biomarkers for CDK4/6 inhibitor resistance in ER+ breast cancer

Affiliations

High p16 expression and heterozygous RB1 loss are biomarkers for CDK4/6 inhibitor resistance in ER+ breast cancer

Marta Palafox et al. Nat Commun. .

Erratum in

  • Author Correction: High p16 expression and heterozygous RB1 loss are biomarkers for CDK4/6 inhibitor resistance in ER+ breast cancer.
    Palafox M, Monserrat L, Bellet M, Villacampa G, Gonzalez-Perez A, Oliveira M, Brasó-Maristany F, Ibrahimi N, Kannan S, Mina L, Herrera-Abreu MT, Òdena A, Sánchez-Guixé M, Capelán M, Azaro A, Bruna A, Rodríguez O, Guzmán M, Grueso J, Viaplana C, Hernández J, Su F, Lin K, Clarke RB, Caldas C, Arribas J, Michiels S, García-Sanz A, Turner NC, Prat A, Nuciforo P, Dienstmann R, Verma CS, Lopez-Bigas N, Scaltriti M, Arnedos M, Saura C, Serra V. Palafox M, et al. Nat Commun. 2022 Nov 14;13(1):6928. doi: 10.1038/s41467-022-34580-3. Nat Commun. 2022. PMID: 36376284 Free PMC article. No abstract available.

Abstract

CDK4/6 inhibitors combined with endocrine therapy have demonstrated higher antitumor activity than endocrine therapy alone for the treatment of advanced estrogen receptor-positive breast cancer. Some of these tumors are de novo resistant to CDK4/6 inhibitors and others develop acquired resistance. Here, we show that p16 overexpression is associated with reduced antitumor activity of CDK4/6 inhibitors in patient-derived xenografts (n = 37) and estrogen receptor-positive breast cancer cell lines, as well as reduced response of early and advanced breast cancer patients to CDK4/6 inhibitors (n = 89). We also identified heterozygous RB1 loss as biomarker of acquired resistance and poor clinical outcome. Combination of the CDK4/6 inhibitor ribociclib with the PI3K inhibitor alpelisib showed antitumor activity in estrogen receptor-positive non-basal-like breast cancer patient-derived xenografts, independently of PIK3CA, ESR1 or RB1 mutation, also in drug de-escalation experiments or omitting endocrine therapy. Our results offer insights into predicting primary/acquired resistance to CDK4/6 inhibitors and post-progression therapeutic strategies.


Conflict of interest statement

V.S. received non-commercial research support from Novartis and Genentech. M.B. reported receiving honoraria for speaker activities and advisory role from Pfizer, Novartis and Elli-Lilly and support for travel expenses from Roche and Pfizer. M.O. declares grant/research support (to the Institution) from AstraZeneca, Philips Healthcare, Genentech, Roche, Novartis, Immunomedics, Seattle Genetics, GSK, Boehringer-Ingelheim, PUMA Biotechnology, and Zenith Epigenetics; consultant role for Roche, GSK, PUMA Biotechnology, AstraZeneca, and Seattle Genetics; and has received honoraria from Roche, Seattle Genetics, and Novartis. G.V. reported receiving honoraria for speaker activities from MDS and advisory role from Astrazeneca. F.S. is employee of Novartis. K.L. is employee of Genentech. C.C. is a member of AstraZeneca’s External Science Panel, of Illumina’s Scientific Advisory Board, and is a recipient of research grants (administered by the University of Cambridge) from AstraZeneca, Genentech, Roche and Servier. J.A. has received research funds from Roche, Synthon, Menarini, and Molecular Partners and consultancy honoraria from Menarini. A.P. reports that his institution received research funding from Nanostring Technologies, Roche and Novartis and reports consulting and lecture fees from Nanostring Technologies, Roche, Novartis, Pfizer, Oncolytics Biotech, Amgen, Elli-Lilly, MSD and PUMA. P.N. has consulted for Bayer, Novartis, and MSD and received compensation. R.D. is on advisory role of AstraZeneca, Roche and Boehringer-Ingelheim and has received speaker’s fees from Roche, Symphogen, IPSEN, Amgen, Servier, Sanofi, MSD, and research support from Merck. M.S. is on the scientific advisory board of Menarini Ricerche and the Bioscience Institute, has received research funds from Puma Biotechnology, Daiichi-Sankio, AstraZeneca, Targimmune, Immunomedics and Menarini Ricerche, and is a cofounder of Medendi.org. M.A. received a research grant from Eli-Lilly, honoraria from Novartis, Astrazeneca, Seattle Genetics, Abbvie and Pfizer and travel grants from Novartis, Roche, Pfizer. S.M. has provide punctual statistical advice to IDDI and Janssen Cilag and participated to data and safety monitoring committees of clinical trials (Hexal, Steba, IQVIA, Roche, Sensorion, Biophytis, Servier, Yuhan), outside the submitted work. C.S. has served as consultant, participated in advisory boards or received travel grants from AstraZeneca, Celgene, Daiichi Sankyo, Roche, Genomic Health, Merck, Sharp and Dhome España S.A., Novartis Odonate Therapeutics, Pfizer, Philips He. C.Ve. & S.K. are founders of Sinopsee Therapeutics and Aplomex; neither company has any conflict with the current work. VHIO has had funding (paid directly to the Institution) from AstraZeneca, Daiichi Sankyo, Eli Lilly and Company, Genentech, Immunomedics, Macrogenics, Merck, Sharp and Dhome España S.A., Novartis, Pfizer, Piqur Therapeutics, Puma, Roche, Synthon and Zenith Pharma. The remaining authors declare no competing interests.

Figures
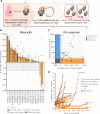
Fig. 1
Fig. 1. Ribociclib monotherapy has higher antitumor activity than other targeted agents in ER+ and HER2+ BC PDXs.
A Workflow depicting the generation of BC PDX models from BC patient samples and its subsequent expansion for targeted treatment screening. B Waterfall plot representing the growth of n = 23 PDX treated with ribociclib 75 mg/kg (bars and black dots) and vehicle (white circles). The percentage change from the initial volume is shown at day 35 of treatment. Dashed lines indicate the range of PD (>20%), SD (20% to −30%) and PR/CR (<−30%). The number of tumors treated per model is indicated in brackets (n). Data represent mean values and error bars ± SEM. C Antitumor response of ribociclib (y-axis) vs. other targeted agents (x-axis; endocrine therapy (ET) or trastuzumab) in PDXs represented as the percentage of tumor volume change compared to the initial tumor volume. Symbols represent the different targeted therapies. D Spaghetti plot showing the relative tumor volume change along time in 23 BC PDX treated with ribociclib 75 mg/kg. Ribociclib-sensitive models are represented with filled symbols and ribociclib-resistant with open symbols. Symbols represent the PDX’s molecular subtype. Dashed lines indicate the range of PD (>1.2), SD (1.2 to –0.7) and PR/CR (<−0.7). Acquisition of ribociclib resistance in PDX244 (PDX244LR) is shown. Source data are provided as a Source Data file.
Fig. 2
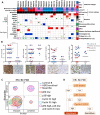
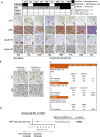
Fig. 2. PDXs expressing high p16 are resistant to ribociclib.
A Summary of genetic alterations in the PDX panel from Fig. 1B, including the PDX subtype classification, based on IHC (molecular subtype) or PAM50 analysis (intrinsic subtype), and the response to CDK4/6 inhibitors. Genes with similar function such as TSC1/TSC2 or CDKN2A/CDKN2B were considered as one single feature. B Quantification of IHC staining for p16, pRb, cyclin E1 and cyclin D1 in n = 23 untreated PDX ribociclib-response analyzed in two independent experiments. Semiquantitative analysis was performed for pRb, p16, according to cyclin E1 and cyclin D1. Different colors indicate the PDX intrinsic subtype and $ indicates the models harboring gene amplification. Mean values ± SEM and the unpaired parametric t-test two-tailed p-value are indicated. The pictures underneath are representative bright-field images of high/low staining for each protein. Scale bar = 100 µm. R: resistant; S: sensitive. C Concordance analysis of the PDXs responses to ribociclib based on the analyzed biomarkers (y-axis) vs. the in vivo response (x-axis). Singleplex or multiplex biomarkers are represented by circles of different colors and the number of PDX within each category is indicated. The intrinsic subtype of each PDX is represented by different font colors. D Consort flow diagram for classifying the PDX responses to ribociclib based on the molecular subtype, p16, pRb and cyclin E1/D1 scores. Source data are provided as a Source Data file.
Fig. 3
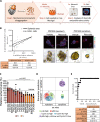
Fig. 3. Biomarker validation in short-term patient-derived tumor cells (PDCs).
A Workflow depicting the generation of BC PDCs short-term ex vivo cultures from PDXs and the subsequent analysis of ribociclib response using two different read-outs. B Correlation analysis of the ex vivo response of PDCs (y-axis) vs. the in vivo response of the corresponding PDXs (x-axis), measured as change in spheroid area (open dots) or the change in EdU incorporation (filled dots) after ribociclib treatment. The Spearman’s coefficient (r), two-tailed p-value and 95% of confidence interval (95% CI) for each read-out are summarized below the graph. Representative images of one ribociclib-resistant (PDC039) and one ribociclib-sensitive (PDC244) model treated with vehicle or ribociclib are shown on the right panel, namely EdU/K18 staining by confocal microscopy and organoid size by bright field microscopy. EdU is shown in green, cytokeratin 18 (K18) in red and DAPI in blue. Scale bar = 100 µm. C Relative spheroid area in n = 14 PDC models classified as resistant (maroon) or sensitive (orange) according to the composite biomarker after treatment with 1 µM ribociclib for 7 days. Relative data to the vehicle control (100%) is represented as mean values of three independent experiments ± SEM; unpaired parametric t-test two-tailed p-value are indicated. D Concordance analysis of PDXs responses to ribociclib based on biomarker prediction (y-axis) vs. the ex vivo response (x-axis). Biomarkers are represented by circles with different colors and the number of PDX within each category is indicated. E ROC curve of the spheroid area increment for ribociclib response prediction in n = 37 BC PDCs. Unpaired t-test two-tailed p-value (<0.0001), the sensitivity, 95% confidence interval (95% CI) and specificity are summarized below the graph. Source data are provided as a Source Data file.
Fig. 4
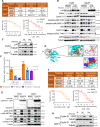
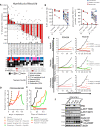
Fig. 4. p16 and cyclin D1 overexpression attenuate the response to ribociclib in ER+ BC cell lines.
A Half-maximal inhibitory concentration (IC50) and IC50 fold-change (fc) values for ribociclib, fulvestrant and the combination of drugs in T47D and MCF7 cells overexpressing p16 compared to control cells (MOCK), treated for 6 days and evaluated as shown underneath. Data are presented as mean values ± SEM of at least three independent experiments. B Immunoblot of the indicated proteins in MOCK and p16 overexpressing T47D and MCF7 cells untreated or treated with ribociclib for 5 days at the indicated concentrations. C Immunoblot of the indicated proteins in a cell competition assay. Cells were treated with vehicle or ribociclib 1 µM for the indicated days. D Comparison of structural models for the complexes of p16 bound to P18IN003 and p16 bound to CDK4. Gray cartoon is p16, orange spheres represent P18IN003, cyan cartoon is CDK4; zoomed view are the binding pocket with p16 shown as gray surface and highlighting the residues in the binding pocket of p16 as sticks and the hydrogen bonds made between P18IN003 and p16 shown as black dashed lines. E Relative spheroid area of PDC191 and PDC313 after treatment with 1 µM ribociclib, 20 nM P18IN003 and the combination for 7 days. Data are presented as mean values of three independent experiments ± SEM. Two-tailed p-values are based on the one-way ANOVA test with Tukey’s method correction compared with the vehicle (black line). Dashed line indicates the optimal cut-off established in Fig. 3E. p16 and pRb scores of each PDC are indicated. F IC50 and IC50 fc values for ribociclib, fulvestrant and the combination of drugs in T47D and MCF7 cells overexpressing cyclin D1, compared to control cells (MOCK), treated for 6 days and evaluated as shown underneath. Data are presented as mean values ± SEM from at least three independent experiments. G Immunoblot of indicated proteins in control (MOCK) and cyclin D1-overexpressing T47D and MCF7 cells untreated or treated with 0.5 µM ribociclib for 48 h. H Immunoblot as indicated for panel (C). Source data are provided as a Source Data file.
Fig. 5
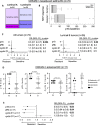
Fig. 5. High p16 levels associated with lack of response to CDK4/6i in ER+ BC patients.
A Percentage distribution of sensitivity to abemaciclib after 15 days of treatment in the neoadjuvant setting in the ABC-POP trial (n = 72). Tumors were classified as Luminal A if %KI67 < 15 or as Luminal B if %KI67 ≥ 15. Tumors showing ln KI67 < 1 at day 15 were considered sensitive and those with ln KI67 ≥ 1 were resistant to the studied drug. B Box and whiskers plot showing a logistic model to evaluate the effect of p16 on the response to abemaciclib (n = 39 Luminal B tumors). Box represents the median and the 25th and 75th percentiles, whiskers show the largest and smallest value. The mean value of each subgroup is indicated. C Forest plots displaying the odds ratios (OR; black squares) ±95% confidence intervals (CI; horizontal lines) of the association between the indicated biomarkers and the percentage of KI67 after treatment with abemaciclib for all tumors (n = 72; left panel) or Luminal B tumors (n = 39; right panel). Two-sided p-values from Wald tests in logistic models are provided. D Quantification of p16, pRb, cyclin E1 and cyclin D1 in a cohort of n = 10 advanced BC tumors detected by IHC semiquantitatively (pRb p16 cyclin E1 and cyclin D1) displayed according to the patient’s response to abemaciclib. Symbols indicate different CDK4/6i treatments. Mean values ± SEM and unpaired parametric t-test two-tailed p-value are indicated R: resistant; S: sensitive. E Forest plot displaying the odds ratios (OR; black squares) ± 95% confidence intervals (CI; horizontal lines) of the association between the indicated biomarkers and the patient’s response to the study treatments (n = 10 tumors). Fisher’s exact test two-tailed p-values are indicated. Source data are provided as a Source Data file.
Fig. 6
Fig. 6. Acquisition of subclonal RB1 mutations as mechanism of acquired resistance to ribociclib in tumors with RB1 heterozygous loss.
A On the top, copy number and mutation status of CDKN2A, RB1, CCNE1 and CCND1 in tumors derived from PDX244, including an untreated sensitive tumor (2R) or tumors with acquired resistance to ribociclib (15L to 19R). Deep-Del (homozygous loss), CN < −1; Shallow-Del (heterozygous loss), −1 ≤ CN < −0.4; Unaltered, CN ≥ −0.4. Hashtags indicate tumors that acquired deleterious mutations in RB1. On the bottom, representative pictures showing IHC staining of p16, pRb, cyclin E1 and cyclin D1 from the indicated tumors (bottom). Dashed-red lines mark off areas with different protein staining intensity and protein score is indicated. For 19R there was no FFPE tumor available. Scale bar = 100 µm. B IHC staining of p16 and pRb in representative FFPE sections from PDX476.1 and PDX476.2. Protein score is provided. Scale bar = 100 µm. C Clinical outcome expressed in months for the indicated clinical endpoint in patients with ER+/HER2-, RB1 unaltered tumors vs. those harboring tumors with RB1 heterozygous loss. Data and statistical analysis were extracted from the cBioportal. HT hormone therapy, WES whole-exome sequencing, TS targeted-sequencing, n number of patients, DFS disease-free survival, OS overall survival, DOT days of treatment. D Association between RB1 double hit alterations (concomitant mutation and deletion) and prior exposure to CDK4/6 inhibitors in metastatic BC patients (n = 582 tumors). Black square represent the logit value. Multivariable logistic regression two-tailed unadjusted p-value and the 95% confidence intervals (CI; horizontal segment represents) for the test are shown. Source data are provided as a Source Data file.
Fig. 7
Fig. 7. PI3K inhibition sensitizes non-basal-like BC PDX to CDK4/6i.
A Waterfall plot showing the growth of n = 23 PDX treated with ribociclib 75 mg/kg plus alpelisib 35 mg/kg (bars and black dots) and vehicle (white circles). The percentage change from the initial volume is shown at day 35 of treatment. Dashed lines indicate the range of PD (>20%), SD (20% to −30%) and PR/CR (<−30%). The number of tumors treated per model is indicated in the brackets (n). Hashtags (#) indicate models harboring mutations in PIK3CA. Data represent mean values and error bars ± SEM. Boxes underneath show the molecular and intrinsic tumor subtype as well as their responses to the indicated treatments. The preclinical benefit to each drug is indicated as percentage in brackets. n.d, not determined. B IHC analysis of KI67 (left graph; p-value < 0.001) and phospho-pRb S807/811 (right graph; p-value < 0.01) in vehicle and alpelisib plus ribociclib-treated PDXs according to the PDX response to alpelisib plus ribociclib. Data are presented as mean values of each PDX. Two-tailed p-values are based on Mann-Whitney U test for all biological replicates. Different colors represent the tumor’s intrinsic subtype. R, resistant; S, sensitive; Alp, alpelisib; Rib, ribociclib. C Relative tumor growth of PDX039 and PDX191 after treatment with the indicated drugs and time. Dashed lines indicate the range of PD (>1.2), SD (1.2 to −0.7) and PR/CR (<−0.7). Two-tailed p-values are based on the two-way ANOVA test with Bonferroni’s method correction. V, vehicle; R, ribociclib; A, alpelisib. D, E Relative tumor growth of the ribociclib-resistant PDX244LR#18R and PDX450 after treatment with the indicated drug(s) for the indicated period of time, respectively. Dashed lines indicate the range of PD (>1.2), SD (1.2 to −0.7) and PR/CR (<−0.7). F Immunoblot of the indicated proteins in PDC476.2 treated with vehicle or 500 nM palbociclib as single-agent or combined with 100 nM fulvestrant and/or 2.5 µM alpelisib in ex vivo cultures for 48 h. At least two independent experiments were conducted. Source data are provided as a Source Data file.

Similar articles

Cited by

References

    1. Hortobagyi GN, et al. Ribociclib as first-line therapy for HR-positive, advanced breast cancer. N. Engl. J. Med. 2016;375:1738–1748. - PubMed
    1. Finn RS, et al. Palbociclib and letrozole in advanced breast cancer. N. Engl. J. Med. 2016;375:1925–1936. - PubMed
    1. Goetz MP, et al. MONARCH 3: abemaciclib as initial therapy for advanced breast cancer. J. Clin. Oncol. 2017;35:3638–3646. - PubMed
    1. Dickler MN, et al. MONARCH 1, a phase II study of abemaciclib, a CDK4 and CDK6 inhibitor, as a single agent, in patients with refractory HR(+)/HER2(−) metastatic breast cancer. Clin. Cancer Res. 2017;23:5218–5224. - PMC - PubMed
    1. Johnston SRD, et al. Abemaciclib combined with endocrine therapy for the adjuvant treatment of HR+, HER2−, node-positive, high-risk, early breast cancer (monarchE) J. Clin. Oncol. 2020;38:3987–3998. - PMC - PubMed

Publication types

MeSH terms