

A NANOG-pERK reciprocal regulatory circuit regulates Nanog autoregulation and ERK signaling dynamics
- PMID: 36066347
- PMCID: PMC9638859
- DOI: 10.15252/embr.202154421
A NANOG-pERK reciprocal regulatory circuit regulates Nanog autoregulation and ERK signaling dynamics
Abstract
The self-renewal and differentiation potential of embryonic stem cells (ESCs) is maintained by the regulated expression of core pluripotency factors. Expression levels of the core pluripotency factor Nanog are tightly regulated by a negative feedback autorepression loop. However, it remains unclear how ESCs perceive NANOG levels and execute autorepression. Here, we show that a dose-dependent induction of Fgfbp1 and Fgfr2 by NANOG activates autocrine-mediated ERK signaling in Nanog-high cells to trigger autorepression. pERK recruits NONO to the Nanog locus to repress transcription by preventing POL2 loading. This Nanog autorepression process establishes a self-perpetuating reciprocal NANOG-pERK regulatory circuit. We further demonstrate that this reciprocal regulatory circuit induces pERK heterogeneity and ERK signaling dynamics in pluripotent stem cells. Collectively our data suggest that NANOG induces Fgfr2 and Fgfbp1 to activate ERK signaling in Nanog-high cells to establish a NANOG-pERK reciprocal regulatory circuit. This circuit regulates ERK signaling dynamics and Nanog autoregulation in pluripotent cells.
Keywords: ERK; ESC; FGFR2; Nanog; autoregulation.
© 2022 The Authors. Published under the terms of the CC BY 4.0 license.
Figures
- A
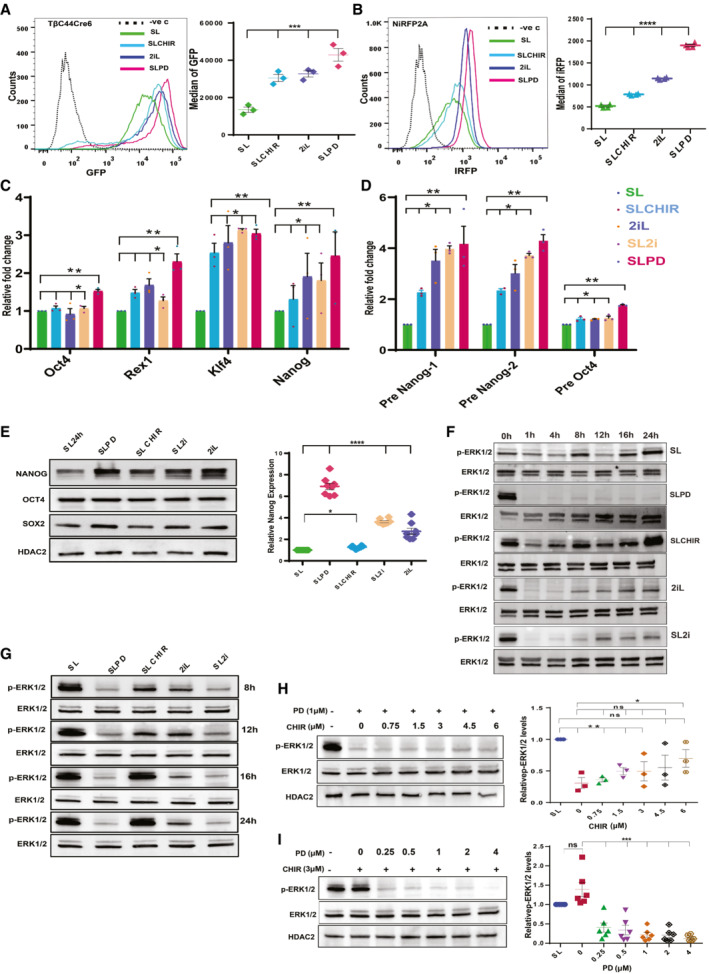
(left) FACS profiles of TβC44Cre6 cultured in indicated conditions for three passages. TβC44Cre6 is a Nanog null cell line, where β‐geo cassette is inserted into one allele and GFP into another allele of the Nanog gene. The cells were cultured in Serum + LIF (SL) in the presence of the 1 μM MEK1/2 inhibitor—PD0325901 (SLPD) or 3 μM GSK3β inhibitor—CHIR99021 (SLCHIR) or in serum‐free media—N2B27 with PD0325901, CHIR99021, and LIF (2iL). The dotted line shows the FACS profile of unstained E14Tg2a cells used as negative control (−ve c). (right) Nanog:GFP population median of TβC44Cre6 (n = 3).
- B
(left) FACS profile of NANOG‐iRFP protein in NiRFP2A cells cultured in indicated conditions for three passages. The dotted line represents the FACS profile of unstained E14Tg2a cells used as negative control (−ve c). (right) NANOG‐iRFP population median of NiRFP2A (n = 4).
- C
RT‐qPCR of pluripotency factors in indicated conditions (SL2i = SL + PD0325901 + CHIR99021) (n = 3).
- D
RT‐qPCR analysis of pre‐ mRNA of Nanog and Oct4 (n = 3).
- E
(left) Western blot of NANOG, OCT4, and SOX2. (right) Relative NANOG levels as estimated by densitometry (n = 8). NANOG was nearly 7‐fold more in PD, which is twice that of 2iL/SL2i.
- F
Western blot of pERK and ERK at 0, 1, 4, 8, 12, 16, and 24 h after media change in indicated treatments (n = 3).
- G
Western blot of pERK and ERK in SLPD, SLCHIR, 2iL, and SL2i after 8, 12, 16, and 24 h of culture relative to SL, where the cells in SL were harvested 24 h after the media change (n > 3).
- H
(left) Western blot of pERK and ERK in 1 μM PD and increasing concentrations of CHIR in serum‐free N2B27 media. (right) Relative pERK levels (n = 3).
- I
(left) Western blot of pERK and ERK in 3 μM CHIR and increasing concentrations of PD in serum‐free N2B27 media. (right) Relative pERK levels (n = 6).
- A
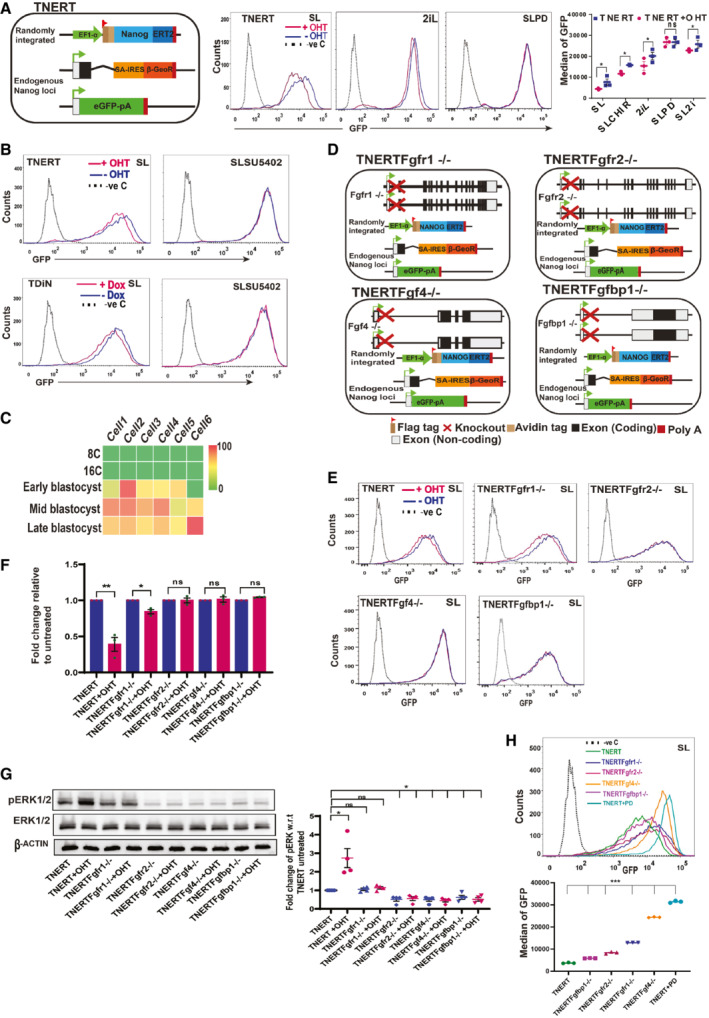
(left) Schematic depiction of Tamoxifen (OHT) inducible TNERT cell line. TNERT and TDiN (Fig EV2A and B) are similar to NERTc3 and 44iN (Navarro et al, 2012), where the NANOG function is reinstated by 4‐Hydroxytamoxifen (OHT) or Doxycycline, respectively, and endogenous Nanog gene activity is reported by GFP. (Middle) FACS profile of TNERT treated with OHT (red) or no OHT (blue). The dotted line represents the FACS profile of unstained E14Tg2a cells used as negative control (−ve c). (Right) Nanog:GFP population median of TNERT (n = 3).
- B
FACS profiles of TNERT, and TDiN treated with 2 μM SU5402, with OHT/Doxycycline (red) or no OHT/Doxycycline (blue) (n = 3). The dotted line represents the FACS profile of unstained E14Tg2a cells used as negative control (−ve c).
- C
Heat map representing transcript levels (FPKM) of Fgfbp1 from 8‐cell to blastocyst stage analyzed from the single‐cell sequencing data.
- D
Schematic depiction of TNERTFgfr1−/−, TNERTFgfr2−/−, TNERTFgf4−/−, and TNERTFgfbp1−/− cell lines, which are derivatives of TNERT where Fgfr1, Fgfr2, Fgf4, and Fgfbp1 are knocked out, respectively.
- E
FACS profiles of TNERT, TNERTFgfr1−/−, TNERTFgfr2−/−, TNERTFgf4−/−, and TNERTFgfbp1−/− cells, cultured in SL treated with OHT (red) or no OHT (blue) (n = 3). The dotted line represents the E14Tg2a FACS profile used as negative control (−ve c).
- F
RT‐qPCR of Nanog:GFP transcript from Nanog locus with primers complementary to 5′UTR of Nanog transcript.
- G
(left) Western blot of pERK in TNERT, TNERTFgfr1−/−, TNERTFgfr2−/−, TNERTFgf4−/−, and TNERTFgfbp1−/− with or no OHT. (Right) relative pERK levels estimated by densitometry (n = 4).
- H
(top) FACS profiles of TNERT, TNERTFgfr1−/−, TNERTFgfr2−/−, TNERTFgf4−/−, TNERTFgfbp1−/− cultured in SL and TNERT + SLPD (n = 3). The dotted line represents the FACS profile of unstained E14Tg2a cells used as negative control (−ve c). (Bottom) Nanog:GFP population median of indicated cell lines.
- A
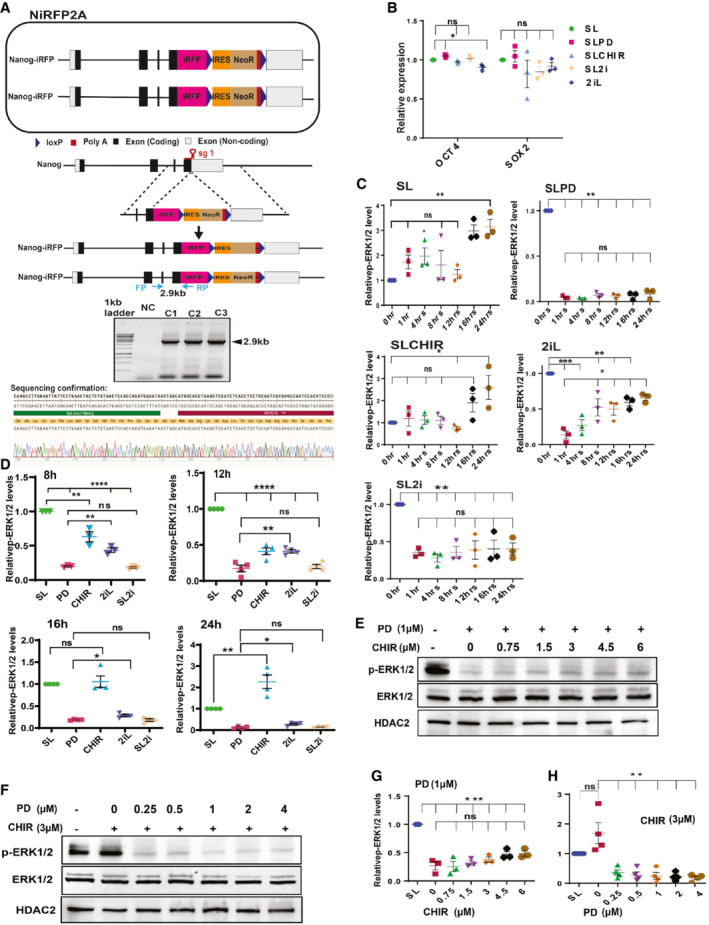
(top) Schematic depiction of NiRFP2A with both alleles of Nanog fused to iRFP coding sequences in frame with last coding sequence. (Middle) CRISPR mediated knock‐in strategy of the iRFP‐loxP‐IRES‐NeoR‐loxP cassette into Nanog locus. The sgRNA includes the stop codon of the Nanog gene. The location of the genotyping primers (FP/RP) for the knock‐in is marked by the arrows. (Bottom) Genotyping of the NiRFP2A clones, a 2.9 kb band is amplified only in the knock‐in clones as one of the primers is complementary to a sequence outside the left homology arm and the other primer is complementary to the iRFP sequence.
- B
Relative quantification of OCT4 and SOX2. The expression is normalized relative to HDAC2 levels and expression levels of OCT4 and SOX2 in SL (n ≥ 3).
- C, D
Relative pERK expression levels in indicated time points and treatments (n = 3).
- E
Western blot of pERK and ERK in 1 μM PD and increasing concentrations of CHIR in SL media.
- F
Western blot of pERK and ERK in 3 μM CHIR and increasing concentrations of PD in SL media. G, H Relative pERK expression levels in indicated concentrations of CHIR and PD, respectively (n ≥ 3).
- G, H
Relative pERK expression levels in indicated concentrations of CHIR and PD, respectively (n ≥ 3).
- A
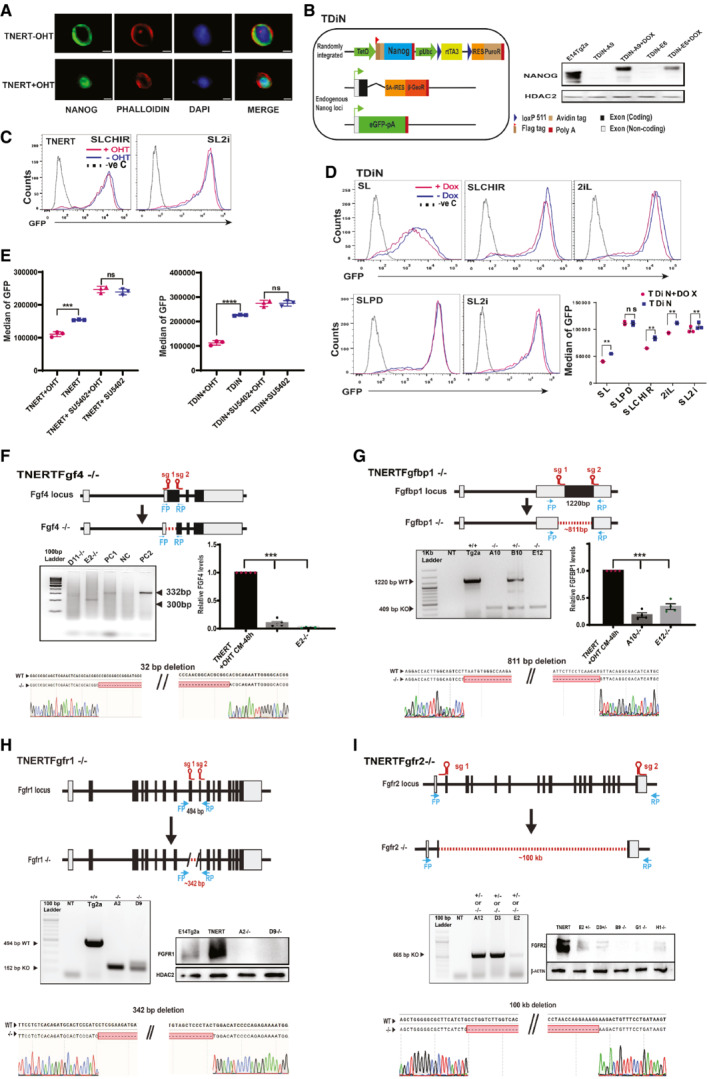
Immunofluorescence of NANOG in TNERT cells after 30 min treatment with or no OHT. Scale bars 5 μM.
- B
(left) Schematic of Doxycycline inducible TDiN cell line, generated by the introduction of a Tetracycline inducible Flag‐Avi‐NANOG transgene in Tβc44Cre6 cell line. (Right) Western blot of NANOG in TDiN cells after 48 h treatment with or no Doxycycline.
- C
FACS profiles of TNERT treatment with or no OHT in SLCHIR and SL2i. The dotted line represents the FACS profile of unstained E14Tg2a cells used as negative control (−ve c).
- D
FACS profiles of TDiN cell line in SL, SLCHIR, 2iL, SL2i, and SLPD. The dotted line represents the FACS profile of unstained E14Tg2a cells used as negative control (−ve c). (Bottom right) Nanog:GFP population median of TDiN in indicated treatments (n = 3).
- E
Nanog:GFP population median of TNERT, and TDiN treated with SU5402, with OHT/Doxycycline or no OHT/Doxycycline.
- F
(top) CRISPR‐based knock‐out strategy using paired sgRNA to knock‐out Fgf4 in TNERT. The sgRNAs are positioned at the beginning and the near end of exon II. The deletion results in the loss of the start codon and a part of the coding region in exon II. The dotted line represents the deleted region of the gene. FP and RP represent the relative positions of the genotyping primers. (Middle left) genotyping PCR of TNERTFgf4−/− clones. The WT allele gives an amplicon of 332 bp and the knock‐out allele has a smaller amplicon by 32 bps or more. (Middle right) The relative abundance of FGF4 in media of TNERT and TNERTFgf4−/− clones 48 h after OHT treatment. (Bottom) Chromatogram of the TNERTFgf4−/− clones showing the sequences at the junction of the deletion.
- G
(top) Schematic of the gene structure of Fgfbp1 and the relative positions of the two sgRNAs used for paired sgRNA knock‐out strategy. One sgRNA is complimentary to 5′UTR and the other to the 3′ end of the coding region of the only exon. (Middle left) Genotyping PCR showing a WT amplicon of 1,220 bps and an amplicon around 400 bps in case of deletion. (Middle right) The relative abundance of FGFBP1 in media of TNERT and TNERTFgfbp1−/− clones 48 h after OHT treatment. (Bottom) Chromatogram of the TNERTFgfbp1−/− clone showing the sequences at the junction of the deletion.
- H
Strategy for knock‐out of Fgfr1 in TNERT cells. The schematic depicts the gene structure of Fgfr1 with the relative positions of the two sgRNAs. One sgRNA targets the 3′end of Intron 8 and the other exon10. (Middle left) Genotyping PCR shows a WT allele amplicon at 494 bp and a knock‐out allele with smaller amplicons around 150 bp. (Middle right) Western blot analysis of FGFR1 in TNERT and TNERTFgfr1−/− clones. (Bottom) chromatogram showing the sequence of the deleted region.
- I
A paired sgRNA strategy to knock‐out Fgfr2 in TNERT. (Top) The schematic represents the Fgfr2 gene structure, with relative positions of the sgRNAs. One sgRNA target exon2 and the other sgRNA targets the coding region of the last exon approximately 100 kb apart. The dotted line represents the region of deletion in the Fgfr2 gene. (Middle left) PCR genotyping shows a 665 bp amplicon when at least one allele of Fgfr2 is deleted. This genotyping strategy cannot distinguish between +/− and −/− genotypes. (Middle right) Western blot analysis of FGFR2 protein in the Fgfr2 targeted clones distinguishing the +/− and −/− clones. (Bottom) chromatogram represents the sequence of the genotyping amplicon indicating the exact sites of deletion.
- A
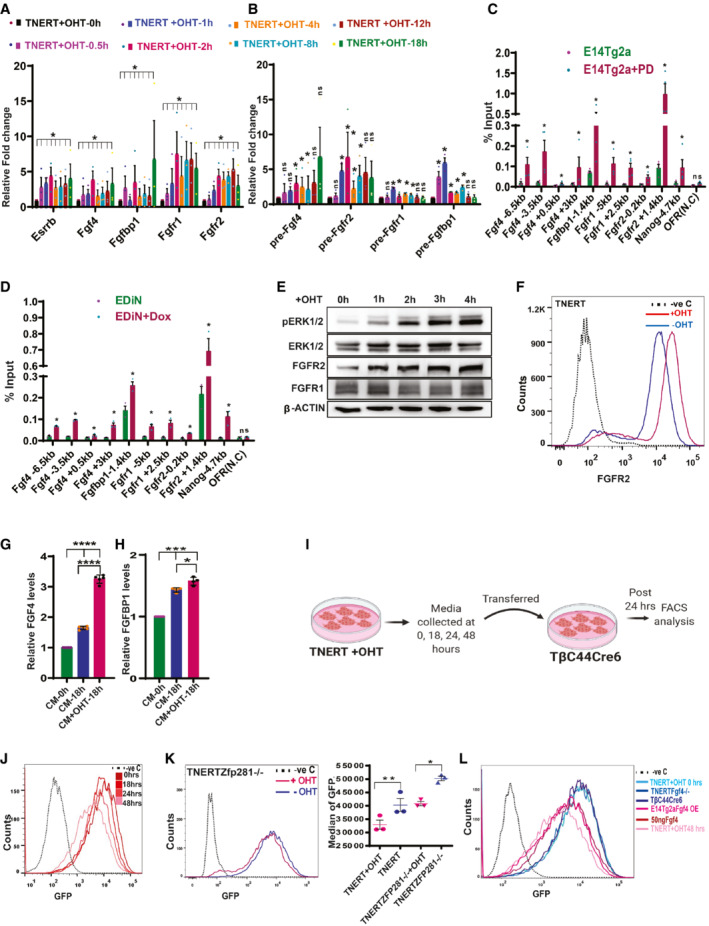
RT‐qPCR showing relative transcript levels after 0, 0.5, 1, 2, 4, 8, 12, and 18 h OHT treatment in TNERT (n = 3). Esrrb, a known direct target of NANOG was used as the positive control.
- B
RT‐qPCR of relative levels of pre‐ mRNA at the above indicated time points after OHT treatment in TNERT (n = 3).
- C
ChIP analysis of NANOG on Fgf4, Fgfbp1, Fgfr1, Fgfr2, Nanog (validated target) and OFR (non‐genic region (negative control)) loci in E14Tg2a cells cultured in SL or SLPD for 48 h (n = 4).
- D
ChIP analysis of NANOG on promoters of above‐indicated loci in EDiN cells cultured in Doxycycline (red) or no Doxycycline (blue) for 48 h (n = 3).
- E
Western blot of FGFR1, FGFR2, and pERK in TNERT at one‐hour intervals at indicated time points after OHT treatment (n > 3).
- F
FACS analysis of FGFR2 on the cell surface of TNERT treated with (red) or no OHT (blue) (n = 3). The dotted line represents the FACS profile of E14Tg2a cells stained with control IgG and secondary antibody used as negative control (−ve c).
- G, H
ELISA‐based relative quantification of FGF4 (G) and FGFBP1 (H) in conditioned media from TNERT treated with or no OHT (n = 3).
- I
Schematic of conditioned media experiment.
- J
FACS analysis of Tβc44Cre6 cell line in conditioned media collected from TNERT treated with OHT after 0, 18, 24, and 48 h. The dotted line represents the FACS profile of unstained E14Tg2a cells used as negative control (−ve c).
- K
(left) FACS analysis of TNERTZfp281−/− cells treated with (red) or with no OHT (blue) treatment. The dotted line represents the FACS profile of unstained E14Tg2a cells used as negative control (−ve c). (right) Nanog:GFP population median of TNERTZfp281−/− (n = 3).
- L
FACS analysis of Tβc44Cre6 cell line in different conditioned media. Media from TNERT + OHT 0 h, TNERTFGF4−/−, Tβc44Cre6 48 h, (shades of blue color) fail to repress Nanog:GFP. Media from E14Tg2a‐ FGF4‐OE (overexpression) 48 h, TNERT + OHT 48 h and 50 ng/ml FGF4 (shades of maroon color) repress Nanog:GFP. The dotted line represents the FACS profile of unstained E14Tg2a cells used as negative control (−ve c).
- A
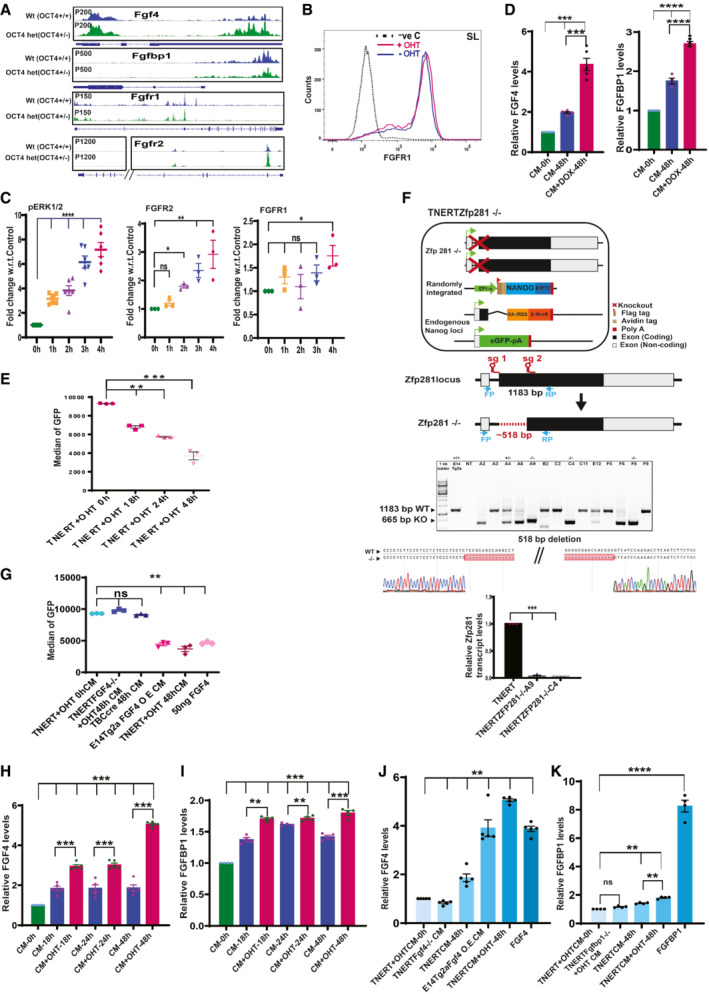
Browser tracks of NANOG enrichment in Fragment Per Kilobase of transcripts per Million (FPKM) in Oct4+/+ cells (normal NANOG levels) and Oct4+/− cells (higher NANOG levels at Fgf4, Fgfbp1, Fgfr1, and Fgfr2 loci) (Data ref: Karwacki‐Neisius et al, 2013b).
- B
Histogram of FGFR1 expression on the cell surface analyzed by immunostaining and FACS of fixed but unpermeabilized TNERT cells treated with (red) or no OHT (blue). The dotted line represents the FACS profile of E14Tg2a cells stained with control IgG and secondary antibody used as negative control (−ve c).
- C
Relative expression levels of pERK, FGFR2, and FGFR1 at indicated time points after OHT treatment in TNERT cells (n > 3).
- D
ELISA‐based relative quantification of FGF4 and FGFBP1in media from EDiN cells cultured with or no Doxycycline (n = 3). EDiN cell was generated by introducing a Doxycycline inducible Flag‐Avi‐NANOG transgene in E14Tg2a cells.
- E
Nanog:GFP population median of Tβc44Cre6 treated with OHT‐induced conditioned media collected after different time points (n = 3).
- F
(top) Schematic of TNERTZfp281−/− cells, (upper‐middle) CRISPR‐based paired guide knock‐out strategy indicating the relative position of the sgRNAs, FP and RP indicate the genotyping primers. (Lower middle) Genotyping PCR indicating +/− and −/− clones. (Bottom) The sequencing chromatogram of the deleted region confirms the exact site of deletion, followed by RT‐qPCR analysis of the Zfp281 transcripts.
- G
Nanog:GFP population median of Tβc44Cre6 treated with conditioned media from TNERT + OHT 0 h, TNERTFGF4−/− + OHT 48 h, Tβc44Cre6 48 h, E14Tg2a‐FGF4‐OE (overexpression) 48 h, TNERT + OHT 48 h and 50 ng/ml FGF4 (n = 3).
- H, I
ELISA‐based relative quantities of FGF4 and FGFBP1 in media from TNERT after 18, 24, and 48 h of OHT treatment (n = 3).
- J
ELISA‐based relative quantities of FGF4 in conditioned media from cell lines—TNERT + OHT 0 h, TNERTFGF4−/− + OHT 48 h, E14Tg2a‐FGF4‐OE 48 h (overexpression), TNERT−/+OHT 48 h, and 50 ng/ml FGF4 (n = 3).
- K
ELISA‐based relative quantities of FGFBP1 in conditioned media from various cell lines—TNERT + OHT 0 h, TNERT‐Fgfbp1−/− 48 h + OHT, TNERT 48 h −/+OHT, and 50 ng/ml FGBP1 (n = 3).
- A
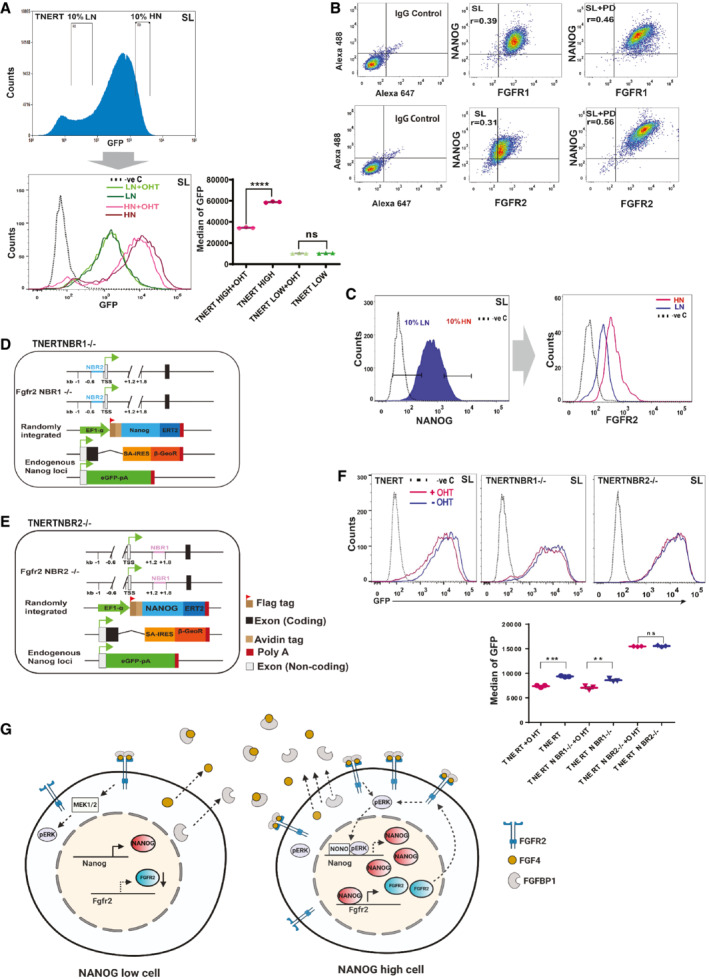
(top) To analyze autoregulation in Nanog‐high and Nanog‐low cells, we sorted the lowest and the highest 10% population of the TNERT expressing GFP and treated them with OHT. FACS profile of TNERT, the position of the gates indicates the 10% low‐Nanog:GFP (LN) and 10% high‐Nanog:GFP (HN) population sorted for culture. (Bottom left) FACS profiles of LN and HN after 18 h culture in SL. LN (dark green), HN (dark maroon) in SL, and LN (light green), HN (light maroon) in SL + OHT. The dotted line represents the FACS profile of unstained E14Tg2a cells used as negative control (−ve c). (Bottom right) Nanog:GFP population median of TNERT (n = 3).
- B
FACS profile of E14Tg2a cultured in SL or SLPD for 48 h and co‐immunostained with anti‐NANOG and anti‐FGFR1 or anti‐FGFR2 antibodies. r‐values represent the average of three independent experiments (n = 3).
- C
(left) FACS profile of E14Tg2a immunostained with anti‐NANOG and anti‐FGFR2 antibody, the gates mark the 10% low‐NANOG (LN) and 10% high‐NANOG (HN) population. The dotted line represents the FACS profile of E14Tg2a cells stained with control IgG and secondary antibody used as negative control (−ve c). (right) Histogram depicting the FGFR2 expression profiles in the gated LN and HN cell population (n = 3).
- D, E
Schematic representation of TNERTNBR1−/− (D) and TNERTNBR2−/− (E) cells, in which NANOG binding sequences at +1.4 kb (NBR1) and −0.2 kb (NBR2) are deleted, respectively.
- F
(top) FACS profiles of TNERT, TNERTNBR1−/−, and TNERTNBR2−/− with (red) or no OHT treatment (blue). The dotted line represents the FACS profile of unstained E14Tg2a cells used as negative control (−ve c). (Bottom) Nanog:GFP population median of TNERT, TNERTNBR1−/− and TNERTNBR2−/− with or no OHT treatment.
- G
A cartoon depicting Nanog autoregulation in Nanog‐high cells. The Nanog‐high cells secrete more FGF4 and FGFBP1. They contain higher levels of FGFR2 on the surface and are hence more sensitive to the FGF ligand triggering a stronger FGF signaling. The increased pERK in these cells recruits NONO to the Nanog locus and represses Nanog transcription. The Nanog‐low cells secrete very little FGF4 and FGFBP1 and present fewer FGFR2 on their surface and are less sensitive to FGF signaling. The pERK levels in Nanog‐low cells are insufficient to execute Nanog autoregulation.
- A
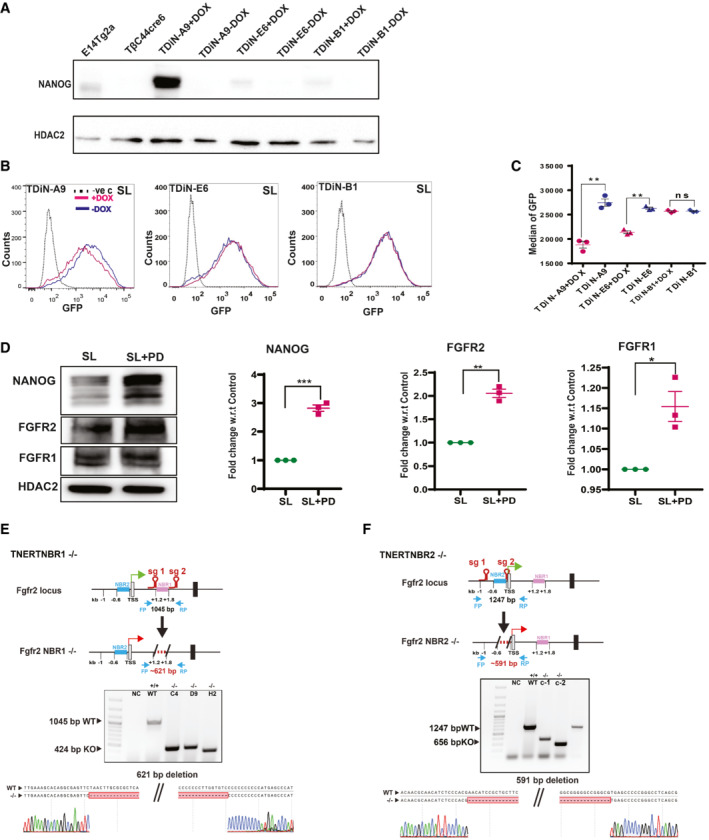
Western blot analysis of Flag‐Avi‐NANOG in different clones of TDiN treated with or no Doxycycline showing different levels of NANOG expression relative to E14Tg2a. The clones show different levels of expression Flag‐ Avi‐NANOG upon Doxycycline treatment.
- B
FACS profiles of Nanog:GFP in TDiN clones treated with or no Doxycycline. The dotted line represents the FACS profile of unstained E14Tg2a cells used as negative control (−ve c).
- C
Nanog:GFP population median of TDiN clones (n = 3).
- D
(left) Western blot of NANOG, FGFR2, and FGFR1 in E14Tg2a cultured in SLPD for 48 h. (Right) Fold change in expression of NANOG, FGFR2, and FGFR1 in E14Tg2a cultured in SLPD relative to SL (n = 3).
- E
(top) Schematic of strategy for deletion of NANOG Binding Region 1 (NBR1) in TNERT indicating the position of the NBR1 and the relative position of the sgRNA pair. The sgRNAs are complementary to sequences around 1.2 kb and 1.8 kb downstream of TSS. FP and RP indicate the relative position of the primers for genotyping. (Middle) Genotyping of TNERT NBR1 knock‐out clones. The WT shows an amplicon of 1,045 bp, upon deletion around 600 bp sequence comprising multiple NANOG binding sites is deleted. (Bottom) Sequence and chromatogram of the genotype PCR amplicon indicating the exact sequence of the junction of deletion in TNERTNBR1−/− clone.
- F
Schematic of strategy for deletion of NANOG Binding Region 2 (NBR2) in TNERT indicating the position of NBR2 and relative position of the sgRNA pair. The sgRNAs are complementary to sequences around TSS and 0.6 kb upstream of TSS of Fgfr2. (Middle) Genotyping of the TNERTNBR2 knock‐out clones. The WT shows an amplicon of 1,247 bp. The knock‐out would lead to deletion of around 690 bps and a smaller amplicon of around 650 bps. (Bottom) Sequence and chromatogram of the PCR amplicon from TNERT knock‐out clones showing the exact site of deletion in TNERT NBR2−/− clone.
- A
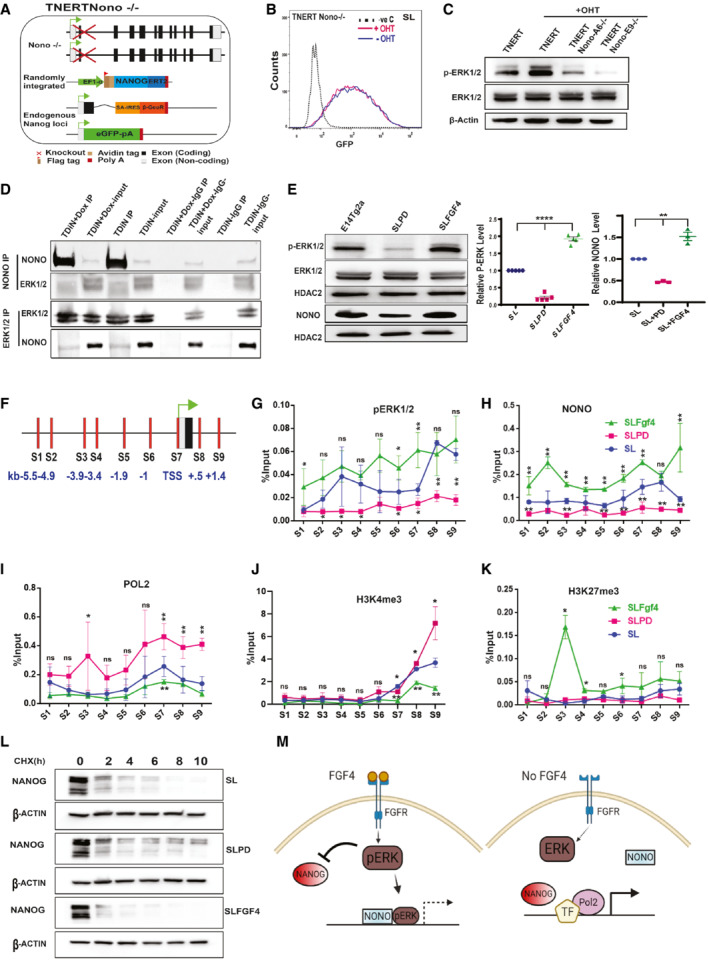
Schematic of TNERTNono−/− cell line; a derivative of TNERT in which Nono is knocked‐out.
- B
FACS profile of TNERTNono−/− treated with or no OHT (n = 3). The dotted line represents the FACS profile of unstained E14Tg2a cells used as negative control (−ve c).
- C
Western blot of pERK and ERK in TNERT and TNERTNono−/− cells treated with or no OHT (n = 3).
- D
Immunoprecipitation analysis showing interactions between ERK and NONO in the presence or absence of Nanog induction by Doxycycline in TDiN cells.
- E
(left) Western blot of pERK and ERK in E14Tg2a cells treated with PD or FGF4. (Middle and right) Relative levels of pERK and NONO in E14Tg2a cells treated with PD or FGF4 (n > 4).
- F
Schematic representation of Nanog locus comprising the −6.0 to +2 kb region. The vertical bars represent the relative positions of primer pairs used for ChiP‐qPCR analysis. S1–S6 are located upstream of the TSS, the S7 primer pair is located around TSS, and S8 and S9 are located downstream in the first intron.
- G–K
ChIP‐qPCR analysis of pERK (G), NONO (H), Pol2 (I), H3K4me3 (J) and H3K27me3 (K) on Nanog 5′ region in E14Tg2a cells (blue), treated with FGF4 (green) and with PD (pink) (n = 3).
- L
Cycloheximide chase assay of NANOG in SL, SLPD, and SLFGF4 in E14Tg2a cells.
- M
A cartoon illustrating the repression of Nanog by FGF signaling and derepression of Nanog in the absence of FGF signaling. The FGF4 activates the FGF signaling cascade, resulting in the phosphorylation of ERK. pERK interacts and recruits NONO to the Nanog promoter and represses transcription of Nanog. pERK also affects the stability of the NANOG. In the absence of FGF4, the pERK levels decrease resulting in enhanced stability of NANOG and transcription of Nanog locus by NANOG and other pluripotency factors resulting in derepression of Nanog locus.
- A
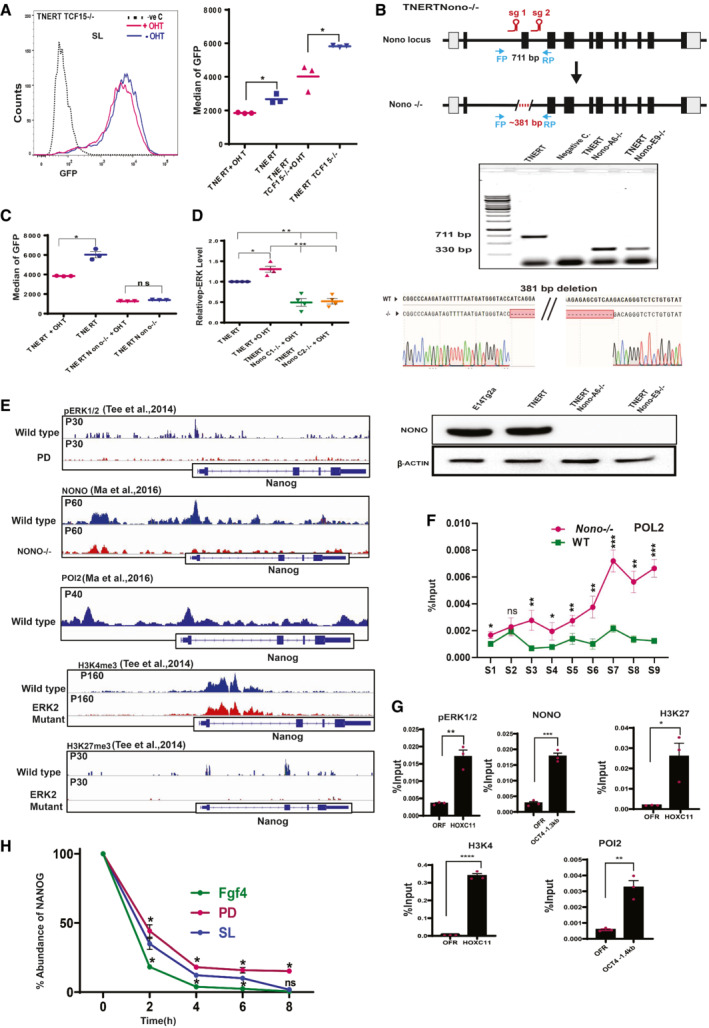
(left) FACS profile of TNERTTcf15−/− treated with or no OHT (n = 3). The dotted line represents the FACS profile of unstained E14Tg2a cells used as negative control (−ve c). (Right) Nanog:GFP population median of TNERT and TNERTTcf15−/− treated with or no OHT (n = 3).
- B
A CRISPR‐based knock‐out strategy using paired sgRNA, to knock‐out of Nono in TNERT cells. (Top) The schematic represents the mouse Nono gene structure with relative positions of the two sgRNAs flanking the second coding exon of Nono. FP and RP indicate the relative position of genotyping primers. The dotted line indicates the region of deletion in the Nono gene. (Middle) Genotyping PCR of the Nono −/− deletion in TNERT. The WT allele gave an amplicon of 711 bp and the deleted allele shows a smaller amplicon of 330 bp; followed by sequence and chromatogram indicating the deletion site (bottom) Western blot analysis of NONO protein in TNERT and TNERTNono−/− clones.
- C
(C)Nanog:GFP population median of TNERT and TNERTNono−/− treated with or no OHT (n = 3).
- D
The relative abundance of pERK in TNERT treated with or no OHT and TNERTNono−/− with OHT (n = 4).
- E
Browser tracks of pERK, NONO, POL2, H3K4me3, H3K27me3 enrichment in Fragment Per Kilobase of transcripts per Million (FPKM) on Nanog gene (Data ref: Ma et al, ; Data ref: Tee et al, 2014b).
- F
ChIP‐qPCR analysis of POL2 enrichment on Nanog locus in E14Tg2a (WT) and Nono−/− cell lines. Refer to the schematic in Fig 5F for the coordinates of S1–S9.
- G
ChIP‐qPCR analysis of pERK, NONO, H3K27, H3K4, and POL2 enrichment on a non‐genic region and a known validated target locus. The non‐genic region named ORF Free Region (OFR) corresponds to Chr6:43023477 + 43023592 (mm10). HoxC11 and Oct4 were used as a known validated target genes for ChIP‐qPCR.
- H
The relative abundance of NANOG after 0, 2, 4, 6, and 8 h of Cycloheximide (CHX) chase cultured in SL, PD, and FGF4 (n = 3).
- A
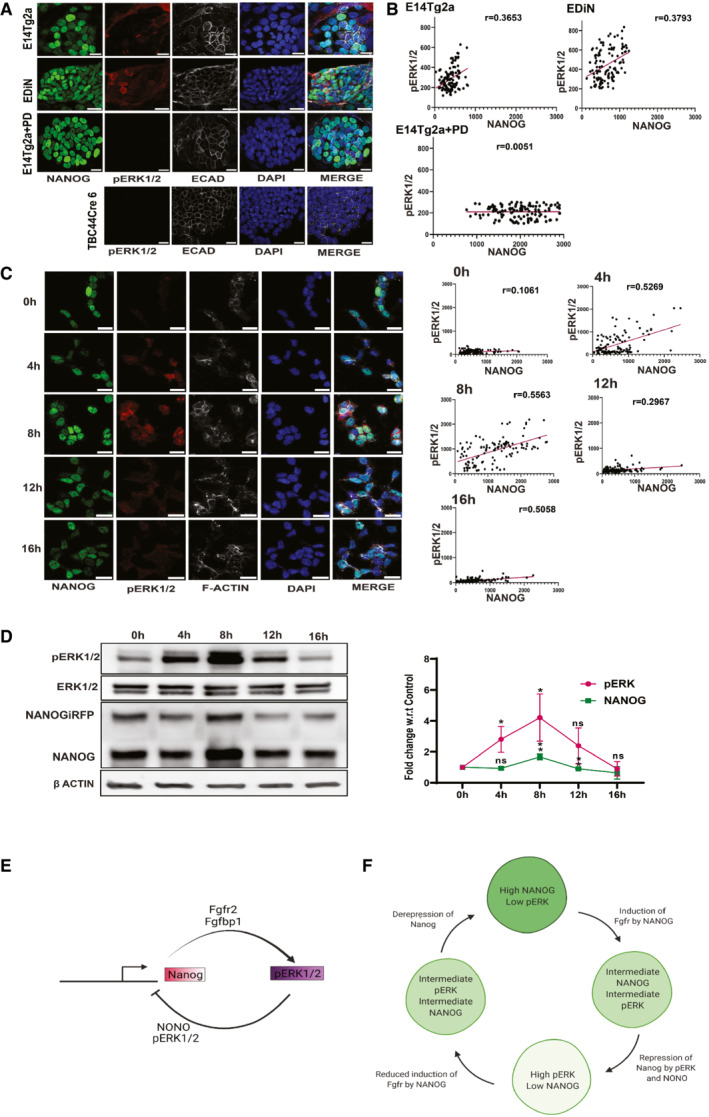
Immunofluorescence of pERK (red) and NANOG (green) in the indicated ESCs. Scale bars 25 μM.
- B
(B)The normalized fluorescence intensity of pERK was plotted against the normalized fluorescent intensity of NANOG.
- C
(left) Immunofluorescence of pERK and NANOG in 10% NANOG‐high NiRFP2A cells at indicated time cultured in the same media collected from cells before FACS. (Right) The normalized fluorescence intensity of pERK was plotted against the normalized fluorescent intensity of NANOG at different time points. Scale bars 25 μM.
- D
(left) Western blot analysis of pERK, and NANOG in 10% NANOG‐high NiRFP2A cells at indicated time cultured in the same media collected from cells before FAC sorting. (Right) Expression levels of NANOG and pERK in 10% NANOG‐high NiRFP2A cells relative to 0 h during the time course of culture. The NANOG and pERK expression oscillate between high and low levels in the cells during culture.
- E
A working model of the NANOG‐pERK reciprocal regulatory loop operating in ESCs. NANOG induces Fgfbp1 and Fgfr2 to enhance ERK signaling in Nanog‐high cells. pERK along with NONO occupy the Nanog promoter to repress its transcription. The transcription repression results in reduced NANOG, which prevents induction of Fgfbp1and Fgfr2. The is reduces ERK activity relieving the repression on the Nanog promoter.
- F
A schematic depicting the progression of cells through different expression states of NANOG and pERK expression in the ESC population. The cells expressing high‐NANOG induce Fgfbp1 and Fgfr2 to activate pERK by autocrine signaling to give rise to a high‐NANOG:high‐pERK state. The repression of Nanog transcription by pERK leads the cells through different intermediate levels of expression of NANOG and pERK resulting in a low‐NANOG:low‐pERK state. The low pERK permits transcription of Nanog and gradual induction of Fgfbp1 and Fgfr2 by NANOG culminating in a high‐NANOG:high‐pERK state. The cells will cycle through different levels of pERK and NANOG levels generating a heterogeneous population with a strong correlation between pERK and NANOG in an ESC cells culture.
Similar articles
-
ERK signalling eliminates Nanog and maintains Oct4 to drive the formative pluripotency transition.Development. 2024 Jul 15;151(14):dev203106. doi: 10.1242/dev.203106. Epub 2024 Jul 26. Development. 2024. PMID: 39069943
-
OCT4/SOX2-independent Nanog autorepression modulates heterogeneous Nanog gene expression in mouse ES cells.EMBO J. 2012 Dec 12;31(24):4547-62. doi: 10.1038/emboj.2012.321. Epub 2012 Nov 23. EMBO J. 2012. PMID: 23178592 Free PMC article.
-
Zfp281 mediates Nanog autorepression through recruitment of the NuRD complex and inhibits somatic cell reprogramming.Proc Natl Acad Sci U S A. 2012 Oct 2;109(40):16202-7. doi: 10.1073/pnas.1208533109. Epub 2012 Sep 17. Proc Natl Acad Sci U S A. 2012. PMID: 22988117 Free PMC article.
-
Concise review: pursuing self-renewal and pluripotency with the stem cell factor Nanog.Stem Cells. 2013 Jul;31(7):1227-36. doi: 10.1002/stem.1384. Stem Cells. 2013. PMID: 23653415 Free PMC article. Review.
-
Regulation of stem cell pluripotency and differentiation involves a mutual regulatory circuit of the NANOG, OCT4, and SOX2 pluripotency transcription factors with polycomb repressive complexes and stem cell microRNAs.Stem Cells Dev. 2009 Sep;18(7):1093-108. doi: 10.1089/scd.2009.0113. Stem Cells Dev. 2009. PMID: 19480567 Free PMC article. Review.
Cited by
-
Embryonic stem cell ERK, AKT, plus STAT3 response dynamics combinatorics are heterogeneous but NANOG state independent.Stem Cell Reports. 2023 Jun 13;18(6):1295-1307. doi: 10.1016/j.stemcr.2023.04.008. Epub 2023 May 18. Stem Cell Reports. 2023. PMID: 37207650 Free PMC article.
References
-
- Bessonnard S, De Mot L, Gonze D, Barriol M, Dennis C, Goldbeter A, Dupont G, Chazaud C (2014) Gata6, Nanog and Erk signaling control cell fate in the inner cell mass through a tristable regulatory network. Development 141: 3637–3648 - PubMed
-
- Chambers I, Colby D, Robertson M, Nichols J, Lee S, Tweedie S, Smith A (2003) Functional expression cloning of Nanog, a pluripotency sustaining factor in embryonic stem cells. Cell 113: 643–655 - PubMed
-
- Chambers I, Silva J, Colby D, Nichols J, Nijmeijer B, Robertson M, Vrana J, Jones K, Grotewold L, Smith A (2007) Nanog safeguards pluripotency and mediates germline development. Nature 450: 1230–1234 - PubMed
Publication types
MeSH terms
Substances
LinkOut - more resources
Full Text Sources
Research Materials
Miscellaneous
