. 2022 Aug 18:16:978641.
doi: 10.3389/fnana.2022.978641. eCollection 2022.

Genetic tagging of the adenosine A2A receptor reveals its heterogeneous expression in brain regions

Affiliations

Genetic tagging of the adenosine A2A receptor reveals its heterogeneous expression in brain regions

Muran Wang et al. Front Neuroanat. .

Abstract

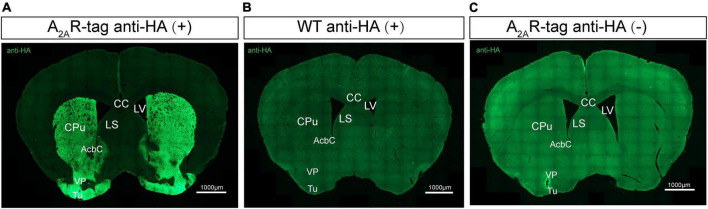
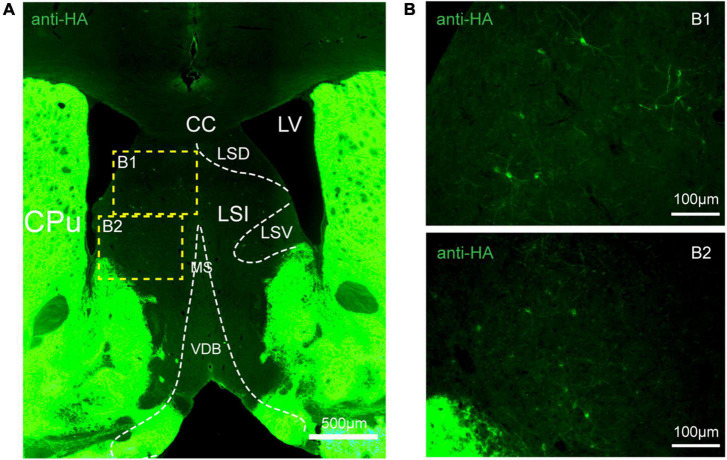
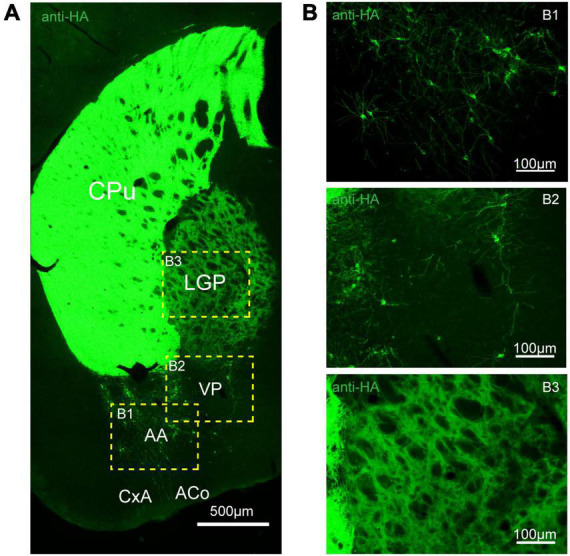
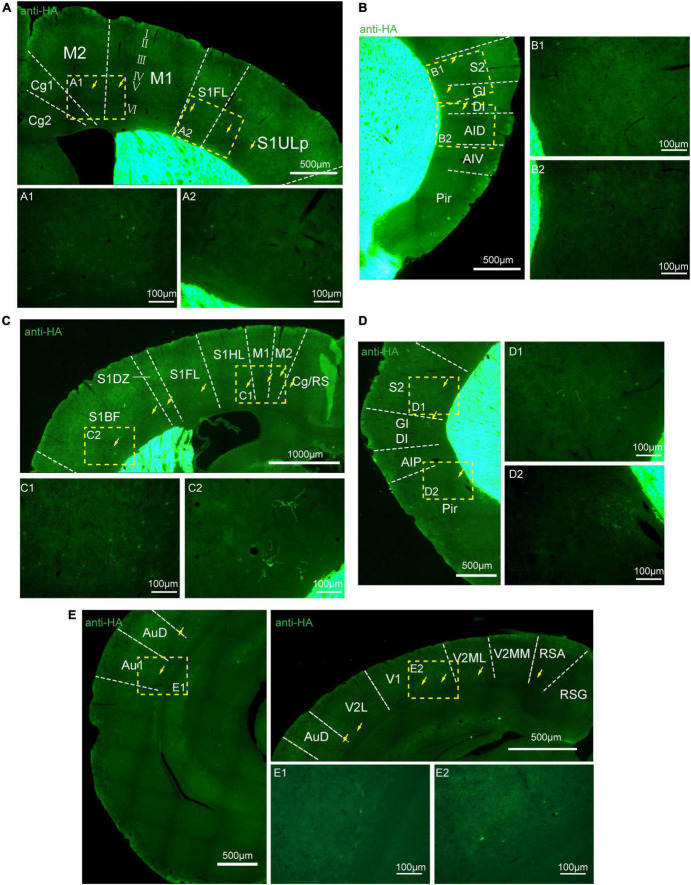
The adenosine A2A receptor (A2AR), a G protein-coupled receptor, is involved in numerous and varied physiological and pathological processes, including inflammation, immune responses, blood flow, and neurotransmission. Accordingly, it has become an important drug target for the treatment of neuropsychiatric disorders. However, the exact brain distribution of A2AR in regions outside the striatum that display relatively low levels of endogenous A2AR expression has hampered the exploration of A2AR functions under both physiological and pathological conditions. To further study the detailed distribution of the A2AR in low-expression regions, we have generated A2AR knock-in mice in which the 3xHA-2xMyc epitope tag sequence was fused to the C-terminus of A2AR (A2AR-tag mice) via CRISPR/Cas9 technology. Here, using CRISPR/Cas9 technology, we have generated A2AR knock-in mice in which the 3xHA-2xMyc epitope tag sequence was fused to the C-terminus of A2AR (A2AR-tag mice). The A2AR-tag mice exhibited normal locomotor activity and emotional state. Consistent with previous studies, A2AR fluorescence was widely detected in the striatum, nucleus accumbens, and olfactory tubercles, with numerous labeled cells being evident in these regions in the A2AR-tag mouse. Importantly, we also identified the presence of a few but clearly labeled cells in heterogeneous brain regions where A2AR expression has not previously been unambiguously detected, including the lateral septum, hippocampus, amygdala, cerebral cortex, and gigantocellular reticular nucleus. The A2AR-tag mouse represents a novel useful genetic tool for monitoring the expression of A2AR and dissecting its functions in brain regions other than the striatum.

Keywords: CRISPR/Cas9; G protein-coupled receptor (GPCR); adenosine A2A receptor (A2AR); knock-in mice; lateral septum (LS); striatum.


Conflict of interest statement

Authors YZ and CQ were employed by Shanghai Pregen Biotechnology Co., Ltd. The remaining authors declare that the research was conducted in the absence of any commercial or financial relationships that could be construed as a potential conflict of interest.

Figures

FIGURE 1
FIGURE 1
Knock-in construct, genotyping scheme, and adenosine A2A receptor (A2AR) mRNA levels in A2AR-tag mice. (A) Targeting strategy. (B) PCR analysis of gene editing in A2AR-tag mice. Using tail genomic DNA, the 857-bp PCR product was only detected in A2AR-tag homozygous mice and the 716-bp product only in wild-type littermates, otherwise, two fragments (716-bp and 857-bp) from A2AR-tag heterozygous mice were detected. (C) The mRNA levels were determined by performing RT-PCR using striatum from A2AR-tag heterozygous mice, as described in “Materials and methods” section. N = 6 mice of each genotype. Data are mean ± SEM (each dot represents one mouse, Mann–Whitney U test).
FIGURE 2
FIGURE 2
Adenosine A2A receptor (A2AR)-tag mice showed no alternation in locomotor and mood tests. (A) After the intraperitoneal administration of KW6002 (5 mg/kg) or vehicle (DMSO + castor oil), mice were subjected to the open field test (OFT) for 90 min. The distances traveled by A2AR-tag mice or their wild-type littermates were significantly increased after KW6002 infusion, however, no difference in locomotor activity was observed between the two groups. Data are mean ± SEM (each dot represents one mouse, two-way ANOVA; interaction P > 0.05, KW6002; P < 0.0001; ***P<0.0001, ###P<0.0001, n.s. no significant). (B) Compared to the wild-type littermates, A2AR-tag mice showed no alternation of time spent in the center of open field. (C,D) Compared to the wild-type littermates, A2AR-tag mice displayed similar locomotion activity in elevated zero maze and spent a similar amount of time in the open arms. (E) A2AR-tag mice exhibited similar immobility time in the tail-suspension test (TST) compared with control animals. Data are mean ± SEM (each dot represents one mouse, unpaired Student’s t-test).
FIGURE 3
FIGURE 3
Evaluation of the specific HA expression in adult adenosine A2A receptor (A2AR)-tag mice. (A) Coronal brain sections of A2AR-tag were incubated with an anti-HA antibody, and the most prominent and intense labeling was observed in the neuropil of the entire striatum and extended into the nucleus accumbens and olfactory tubercles. (B) There was no signal that could be detected in brain slices from wild-type mice after incubating with an anti-HA antibody. (C) Without adding an anti-HA antibody, there is no detectable staining signaling on brain slices from A2AR-tag mice. CPu, caudate putamen (striatum); AcbC, accumbens nucleus, core; VP, ventral pallidum; Tu, olfactory tubercles; LV, lateral ventricle; LS, lateral septal nucleus; CC, central canal. Scale bars as indicated in each picture.
FIGURE 4
FIGURE 4
Distribution of HA immunoreactivity in the forebrain of adenosine A2A receptor (A2AR)-tag mice. (A, Left) Representative confocal image of HA expression in the forebrain (1.18 mm before bregma). Dense labeling of the neuropil can be seen in the striatum, nucleus accumbens, ventral pallidum, and olfactory tubercles. (Right) High magnification of the areas in yellow indicated in panel (A). Numerous labeled cells could be seen within the neuropil. (B) Double-labeling immunofluorescence experiment showed that anti-HA positive cells (green) were neurons (red) in the striatum. Notably, fluorescence seemed to be mostly localized to the plasma membrane (arrows), and the staining signal was denser in some areas at the cell membrane. (C) In fully mature primary neurons (6 days in culture) from A2AR-tag mouse, HA immunoreactivity displayed polarized localization in the cell body and a punctate pattern in the processes (arrows). CPu, caudate putamen (striatum); AcbC, accumbens nucleus, core; Acbsh, accumbens nucleus, shell; VP, ventral pallidum; Tu, olfactory tubercles. Scale bars as indicated in each picture.
FIGURE 5
FIGURE 5
Distribution of HA immunoreactivity in the lateral septum of adenosine A2A receptor (A2AR)-tag mice. (A) Representative confocal image of HA expression in the septum structure (0.86 mm before bregma). Bright labeled cells were observed in the LS and no staining was detected in the medial septum or the horizontal and vertical limbs of the diagonal band. (B) High magnification of the areas (B1,B2) in yellow indicated in panel (A). CPu, caudate putamen (striatum); LV, lateral ventricle; CC, central canal; LSD, lateral septal nucleus, dorsal part; LSI, lateral septal nucleus, intermediate part; LSV, lateral septal nucleus, ventral part; MS, medial septal nucleus; VDB, nucleus of the vertical limb of the diagonal band. Scale bars as indicated in each picture.
FIGURE 6
FIGURE 6
Distribution of HA immunoreactivity in the amygdala and globus pallidus of adenosine A2A receptor (A2AR)-tag mice. (A) Representative confocal image of HA expression in the amygdala and globus pallidus (0.22 mm behind bregma). Discrete and bright labeled cells could be seen in the amygdala, mainly in the basolateral part. Immunoreactivity in the globus pallidus was lighter than in the striatum. (B) High magnification of the areas (B1–B3) in yellow indicated in panel (A). CPu, caudate putamen (striatum); LGP, lateral globus pallidus; AA, anterior amygdaloid area; PV, ventral pallidum; CxA, cortex-amygdala transition zone; ACo, anterior cortical amygdaloid nucleus. Scale bars as indicated in each picture.
FIGURE 7
FIGURE 7
Distribution of HA immunoreactivity in the hippocampus of adenosine A2A receptor (A2AR)-tag mice. (A) Representative confocal image of HA expression in the hippocampus (1.82 mm behind bregma). Very lightly labeled cells (arrows) with evident pyramidal morphology could be seen in the CA1 and CA2 regions, but not in the dentate gyrus. (B) High magnification of the area in yellow indicated in panel (A). CA1, field CA1 of the hippocampus; CA2, field CA2 of hippocampus; CA3, field CA3 of the hippocampus; DG, dentate gyrus. Scale bars as indicated in each picture.
FIGURE 8
FIGURE 8
Distribution of HA immunoreactivity in the cerebral cortex of adenosine A2A receptor (A2AR)-tag mice. (A) Up: representative confocal image of HA expression in the motor and somatosensory cortex (0.5 mm before bregma). Discrete and bright labeled cells (arrows) could be seen in the deep layers (layer V or VI). Down: high magnification of the areas (A1,A2) in yellow indicated in panel (A). (B, Left) Representative confocal image of HA expression in the somatosensory and agranular insular cortex (0.5 mm before bregma). Discrete and bright labeled cells (arrows) could be seen in the deep layers (layer V or VI). (Right) High magnification of the areas (B1,B2) in yellow indicated in panel (B). (C, Up) Representative confocal image of HA expression in the motor and somatosensory cortex (0.7 mm before bregma). Discrete and bright labeled cells (arrows) could be seen in the deep layers (layer V or VI). (Down) High magnification of the areas (C1,C2) in yellow indicated in panel (C). (D, Left) Representative confocal image of HA expression in the somatosensory and agranular insular cortex (0.7 mm before bregma). Discrete and bright labeled cells (arrows) could be seen in the deep layers (layer V or VI). (Right) High magnification of the areas (D1,D2) in yellow indicated in panel (D). (E, Left and Right-up) Representative confocal image of HA expression in the auditory and visual cortex (0.34 mm behind bregma). Discrete and bright labeled cells (arrows) could be seen in the deep layers (layer V or VI). (Right-down) High magnification of the areas (E1,E2) in yellow indicated in panel (E). Cg, cingulate cortex, area 1; M2, secondary motor cortex; M1, primary motor cortex; S1FL, S1 cx, forelimb region; S1ULP, S1 cx, upper lip region; S2, secondary somatosensory cortex; GI, gigantocellular reticular nucleus; DI, dysgranular insular cortex; AID, agranular insular cortex, dorsal part; AIV, agranular insular cortex, ventral part; Pir,; RS, cingulate/retrosplenial; S1HL, S1 cx, hindlimb region; S1DZ, primary somatosensory cortex, dysgranular region; S1BF, S1 cx, barrel field; AIP, agranular insular cortex, posterior part; AuD, secondary auditory cortex, dorsal; Au1, primary auditory cortex; RSG, retrosplenial granular cortex; RSA, retrosplenial agranular cortex; V2MM, secondary vis cx, mediomed; V2ML, secondary visual cortex, mediolat; V1, primary visual cortex; V2L, secondary visual cortex, lateral area. Scale bars as indicated in each picture.
FIGURE 9
FIGURE 9
Distribution of HA immunoreactivity in the gigantocellular reticular nucleus of A2AR-tag mice. (A) Representative confocal image of HA expression in the brain (5.88 mm behind bregma). The labeled cell could be seen in the Gi. (B) High magnification of the area in yellow indicated in panel (A). Discrete labeled cells (arrows) could be seen. CB, cerebellum; 4V, 4th ventricle; MVe, medial vestibular nucleus; Sp5O, spinal trigeminal nucleus, oral part; 7N, facial nucleus; Gi, gigantocellular reticular nucleus; RMg, raphe magnus nucleus. Scale bars as indicated in each picture.

Similar articles

Cited by

References

    1. Alcada-Morais S., Goncalves N., Moreno-Juan V., Andres B., Ferreira S., Marques J. M., et al. (2021). Adenosine A(2A) receptors contribute to the radial migration of cortical projection neurons through the regulation of neuronal polarization and axon formation. Cereb. Cortex 31 5652–5663. 10.1093/cercor/bhab188 - DOI - PubMed
    1. Angulo E., Casadó V., Mallol J., Canela E. I., Viñals F., Ferrer I., et al. (2003). A1 adenosine receptors accumulate in neurodegenerative structures in Alzheimer disease and mediate both amyloid precursor protein processing and tau phosphorylation and translocation. Brain Pathol. 13 440–451. 10.1111/j.1750-3639.2003.tb00475.x - DOI - PMC - PubMed
    1. Baines A. E., Correa S. A., Irving A. J., Frenguelli B. G. (2011). Differential trafficking of adenosine receptors in hippocampal neurons monitored using GFP- and super-ecliptic pHluorin-tagged receptors. Neuropharmacology 61 1–11. 10.1016/j.neuropharm.2011.02.005 - DOI - PubMed
    1. Baraldi S., Baraldi P. G., Oliva P., Toti K. S., Ciancetta A., Jacobson K. A. (2018). “A2A adenosine receptor: Structures, modeling, and medicinal chemistry,” in The Adenosine Receptors, ed. Borea P., Varani K., Gessi S., Merighi S., Vincenzi F. (Totowa, NJ: Humana Press; ), 91–136.
    1. Batalha V. L., Pego J. M., Fontinha B. M., Costenla A. R., Valadas J. S., Baqi Y., et al. (2013). Adenosine A(2A) receptor blockade reverts hippocampal stress-induced deficits and restores corticosterone circadian oscillation. Mol. Psychiatry 18 320–331. 10.1038/mp.2012.8 - DOI - PubMed

LinkOut - more resources