. 2022 Sep 2;12(1):14954.
doi: 10.1038/s41598-022-19256-8.

ICOS is upregulated on T cells following radiation and agonism combined with radiation results in enhanced tumor control

Affiliations

ICOS is upregulated on T cells following radiation and agonism combined with radiation results in enhanced tumor control

Tiffany Blair et al. Sci Rep. .

Abstract

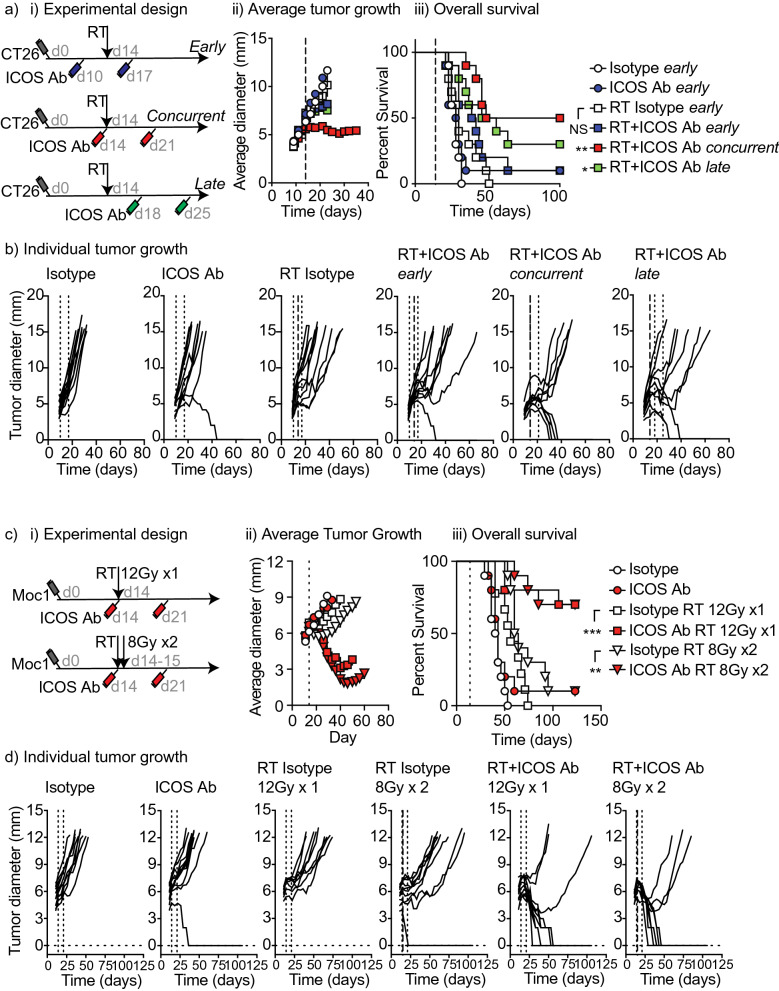
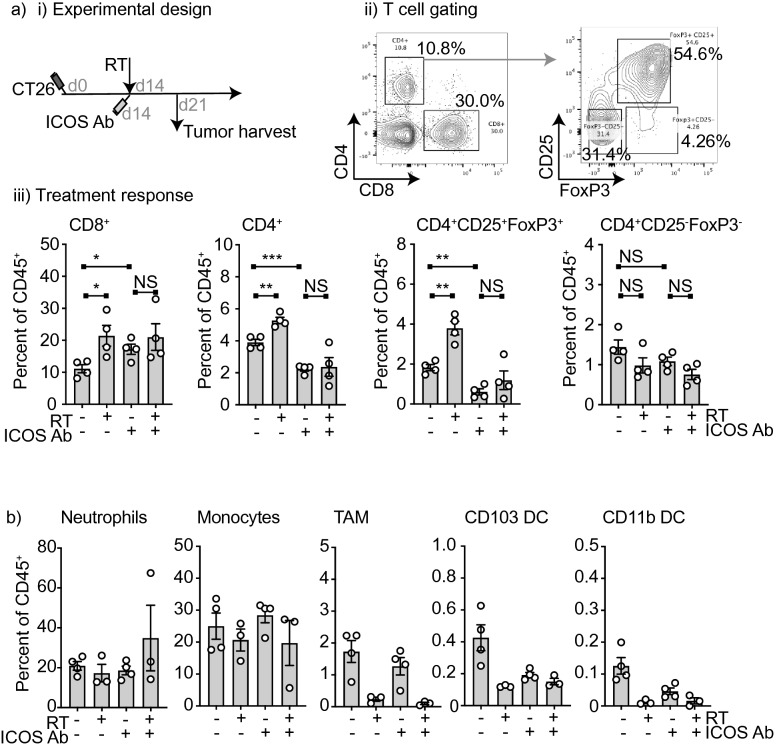
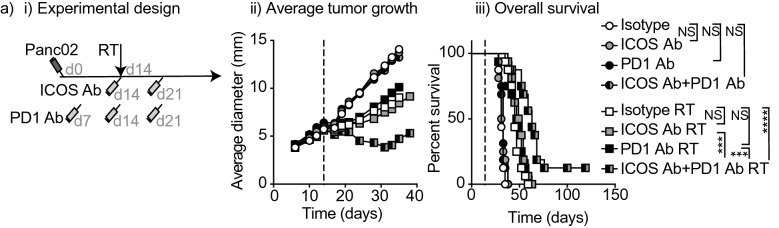
Multiple preclinical studies have shown improved outcomes when radiation therapy is combined with immune modulating antibodies. However, to date, many of these promising results have failed to translate to successful clinical studies. This led us to explore additional checkpoint and co-stimulatory pathways that may be regulated by radiation therapy. Here, we demonstrate that radiation increases the expression of inducible T cell co-stimulator (ICOS) on both CD4 and CD8 T cells in the blood following treatment. Moreover, when we combined a novel ICOS agonist antibody with radiation we observed durable cures across multiple tumor models and mouse strains. Depletion studies revealed that CD8 T cells were ultimately required for treatment efficacy, but CD4 T cells and NK cells also partially contributed to tumor control. Phenotypic analysis showed that the combination therapy diminished the increased infiltration of regulatory T cells into the tumor that typically occurs following radiation alone. Finally, we demonstrate in a poorly immunogenic pancreatic tumor model which is resistant to combined radiation and anti-PD1 checkpoint blockade that the addition of this novel ICOS agonist antibody to the treatment regimen results in tumor control. These findings identify ICOS as part of a T cell pathway that is modulated by radiation and targeting this pathway with a novel ICOS antibody results in durable tumor control in preclinical models.


Conflict of interest statement

MR Crittenden reports research support from Jounce Therapeutics during the course of this study and also receives research funding from Bristol Myers Squibb and VIR that is not related to the subject of this manuscript. MJ Gough reports research support from Jounce Therapeutics during the course of this study and receives funding from Bristol Myers Squibb and VIR that is not related to the subject of this manuscript. M Gostissa is an employee and owns stock of Jounce Therapeutics. CJ. Harvey was an employee of Jounce Therapeutics during the time of study conduct. TB,JB,SB and GK have nothing to disclose and no conflicts of interest.

Figures

Figure 1
Figure 1
Expression of ICOS on T cell subsets in the blood and tumor following radiation. (a) (i) Experimental design. 2 × 105 CT26 cells were implanted subcutaneously into the flanks of Balb/c mice on day 0. Half of the mice received 12 Gy radiation to the tumor using CT guided radiation therapy on day 14. On day 7 (prior to administering radiation), day 15 (24 h post radiation) and day 21 (7 days post radiation) blood was harvested for flow analysis. On day 21 animals were sacrificed and tumors were harvested for flow analysis. (ii) Representative flow plots showing gating strategy for immune cell populations. (b) Quantitative dot plot of percent ICOS expression on CD8+, CD4+CD25+(Treg), and CD4+CD25−, in whole blood over time with and without radiation. (c) Quantitative dot plots of percent ICOS expression on CD8+, CD4+FoxP3+(Treg), CD4+and in tumors on day 21 with and without radiation. In all graphs, bar represents mean, Error bars SEM, ****p < 0.0001, ***p < 0.001, **p < 0.01, *p < 0.05 as determined by unpaired student t test. N = 5 mice per group and experiments were repeated at least 2x.
Figure 2
Figure 2
Expression of ICOS in tumor and TDLN following RT. (a,b) Panc02-SIY tumors were implanted subcutaneously into flanks of C57BL/6 mice. Tumors were treated with 12 Gy radiation on day 15. Tumors and TDLNs were harvested from untreated (NT) or radiation treated (RT) animals for Nanostring analysis. (a) Within the tumor, NT and RT samples were compared to identify differentially expressed genes at (i) day 2 and (ii) day 7 post radiation. Volcano plots were generated using the − log10 p-value (y-axis) and log2 fold change in gene expression (x-axis). Genes were considered significant if the Benjamini–Yekutieli adjusted p-value was < 0.1 and the log2 fold change was >  ± 1.0. Significant genes, either up or down regulated, are represented as red circles. The ICOS gene is identified as a blue circle and genes that are not significant (not sig) are indicated as white circles. (b) The same analysis from (a) was used to identify significantly expressed genes between NT and RT samples collected from the TDLN at (i) day 2 and (ii) day 7 post treatment with radiation.
Figure 3
Figure 3
Optimum schedule of administration of ICOS antibody with radiation for overall survival benefit with single fraction and multi-fraction radiation. (a) (i) Experimental design. 2 × 105 CT26 cells were implanted subcutaneously in to the flanks of Balb/c mice on day 0. On day 14 all mice in radiation groups were treated with 12 Gy radiation to the tumor using CT guidance. Mice were injected i.p. with 0.25 mg/kg ICOS antibody or in Control groups, mice were treated with equivalent dose of isotype control antibody. For early treatment groups mice were treated with antibody on day 10 and day 17. For concurrent treatment groups mice were treated with antibody on day 14 and day 21. For late treatment groups mice were treated with antibody on day 18 and day 25. (ii) Average tumor growth curves for mice treated as in (i). (iii) Overall survival curves for mice treated as in (i). (b) Individual tumor growth curves for mice treated as in (a). (c) Experimental design. 1 × 106 MOC1 cells were implanted subcutaneously into the flanks of C57Bl/6 mice on day 0. On day 14 all mice in single fraction radiation groups were treated with 12 Gy radiation to the tumor using CT guidance. On days 14 and 15 all mice in dual fraction radiation groups were treated with 8 Gy per fraction radiation to the tumor using CT guidance. Mice were injected i.p. with 0.25 mg/kg ICOS antibody or in Control groups, mice were treated with equivalent dose of isotype control antibody on days 14 and day 21. (ii) Average tumor growth curves for mice treated as in (i). (iii) Overall survival curves for mice treated as in (i). (d) Individual tumor growth curves for mice treated as in (c). Statistics key for panel (a) (iii) and (c) (iii): ***p < 0.001, **p < 0.01, *p < 0.05 as determined by Log-rank test. N = 10 mice per group and experiments were repeated at least 2x.
Figure 4
Figure 4
Requirement for ICOS-expressing cell populations to generate survival benefit with RT. (a) (i) Experimental design. 2 × 105 CT26 cells were implanted subcutaneously into the flanks of Balb/c mice on day 0. On day 14 all mice in radiation groups were treated with 12 Gy radiation to the tumor using CT guidance. Mice were injected i.p. with 0.25 mg/kg ICOS antibody or in control groups, mice were treated with equivalent dose of isotype control antibody on days 14 and day 21. For depletion groups mice were treated with 250 µg of anti-CD8β, 200 µg anti-CD4(GK1.5), or 100 µl anti-Asialo GM1 (NK depletion) one day prior to radiation and weekly thereafter for duration of animal survival (Blue box indicates duration of depletion). Mice were followed for survival and blood was analyzed weekly by FACS analysis. (ii) Overall survival curves for mice treated as in (i). (b) Representative flow plots. (c) Flow plots for ICOS expression on relevant cell subsets in ICOS antibody treated or isotype treated groups. ****p < 0.0001, ***p < 0.001, **p < 0.01, *p < 0.05 as determined by Log-rank test. N = 10 mice per group and experiments were repeated at least 2x. For the OS shown in (ii) two experiments were combined for analysis.
Figure 5
Figure 5
Effect of ICOS antibody on the tumor environment following RT. (i) Experimental design. 2 × 105 CT26 cells were implanted subcutaneously into the flanks of Balb/c mice on day 0. On day 14 all mice in radiation groups were treated with 12 Gy radiation to the tumor using CT guidance. Mice were injected i.p. with 0.25 mg/kg ICOS antibody or in Control groups, mice were treated with equivalent dose of isotype control antibody on day 14 and tumors were harvested on day 21 for FACS analysis. (ii) Representative flow plots. (iii) Quantitative bar graphs of T cell populations of interest in the tumor 7 days following treatment. b. Quantitative bar graphs of myeloid populations of interest in the tumor 7 days following radiation treatment. Error bars SEM, ****p < 0.0001, ***p < 0.001, **p < 0.01, *, p < 0.05 as determined by unpaired student t test. N = 4 mice per group.
Figure 6
Figure 6
Addition of ICOS antibody to radiation and anti-PD1 on overall survival in the anti-PD1 immunotherapy resistant Panc02 tumor model. (a) (i) Experimental design. 2 × 105 Panc02 cells were implanted subcutaneously into the flanks of C57Bl/6 mice on day 0. On day 14 all mice in radiation groups were treated with 12 Gy radiation to the tumor using CT guidance. Mice were injected i.p. with 0.25 mg/kg ICOS antibody or in control groups, mice were treated with equivalent dose of isotype control antibody on day 14 and day 21. For mice in groups receiving PD1 antibody, mice were injected i.p. with 250 µg PD1 antibody on day 7, day 14 and day 21. (ii) Average tumor growth curves for mice treated as in (i). (iii) Overall survival curves for mice treated as in (i). Statistics key for panel (a) (iii): ****p < 0.0001, ***p < 0.001, as determined by Log-rank test. N = 10 mice per group and experiments were repeated at least 2x.

Similar articles

Cited by

References

    1. Crittenden MR, Zebertavage L, Kramer G, Bambina S, Friedman D, Troesch V, et al. Tumor cure by radiation therapy and checkpoint inhibitors depends on pre-existing immunity. Sci. Rep. 2018;8(1):7012. doi: 10.1038/s41598-018-25482-w. - DOI - PMC - PubMed
    1. Bursuker I, North RJ. Generation and decay of the immune response to a progressive fibrosarcoma. II. Failure to demonstrate postexcision immunity after the onset of T cell-mediated suppression of immunity. J. Exp. Med. 1984;159(5):1312–21. doi: 10.1084/jem.159.5.1312. - DOI - PMC - PubMed
    1. North RJ, Bursuker I. Generation and decay of the immune response to a progressive fibrosarcoma. I. Ly-1+2- suppressor T cells down-regulate the generation of Ly-1–2+ effector T cells. J. Exp. Med. 1984;159(5):1295–311. doi: 10.1084/jem.159.5.1295. - DOI - PMC - PubMed
    1. Medler TR, Blair TC, Crittenden MR, Gough MJ. Defining immunogenic and radioimmunogenic tumors. Front. Oncol. 2021;11:667075. doi: 10.3389/fonc.2021.667075. - DOI - PMC - PubMed
    1. Zebertavage LK, Alice A, Crittenden MR, Gough MJ. Transcriptional upregulation of NLRC5 by radiation drives STING- and interferon-independent MHC-I expression on cancer cells and T cell cytotoxicity. Sci. Rep. 2020;10(1):7376. doi: 10.1038/s41598-020-64408-3. - DOI - PMC - PubMed

Publication types