. 2022 Sep 2;13(1):5173.
doi: 10.1038/s41467-022-32799-8.

Isoform-specific and ubiquitination dependent recruitment of Tet1 to replicating heterochromatin modulates methylcytosine oxidation

Affiliations

Isoform-specific and ubiquitination dependent recruitment of Tet1 to replicating heterochromatin modulates methylcytosine oxidation

María Arroyo et al. Nat Commun. .

Erratum in

Abstract

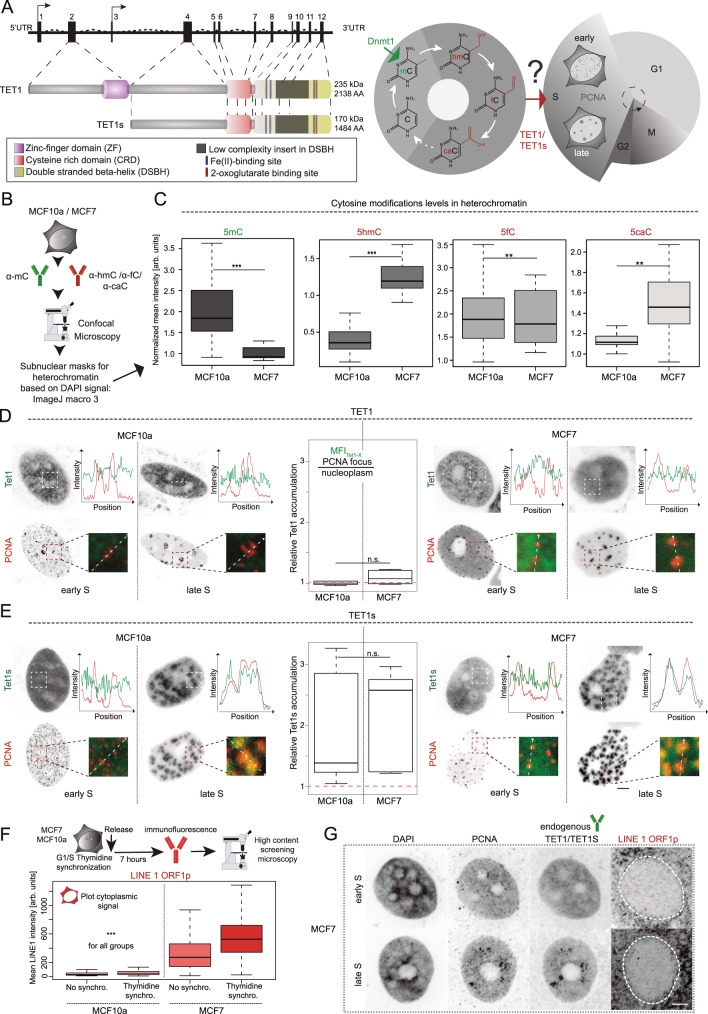
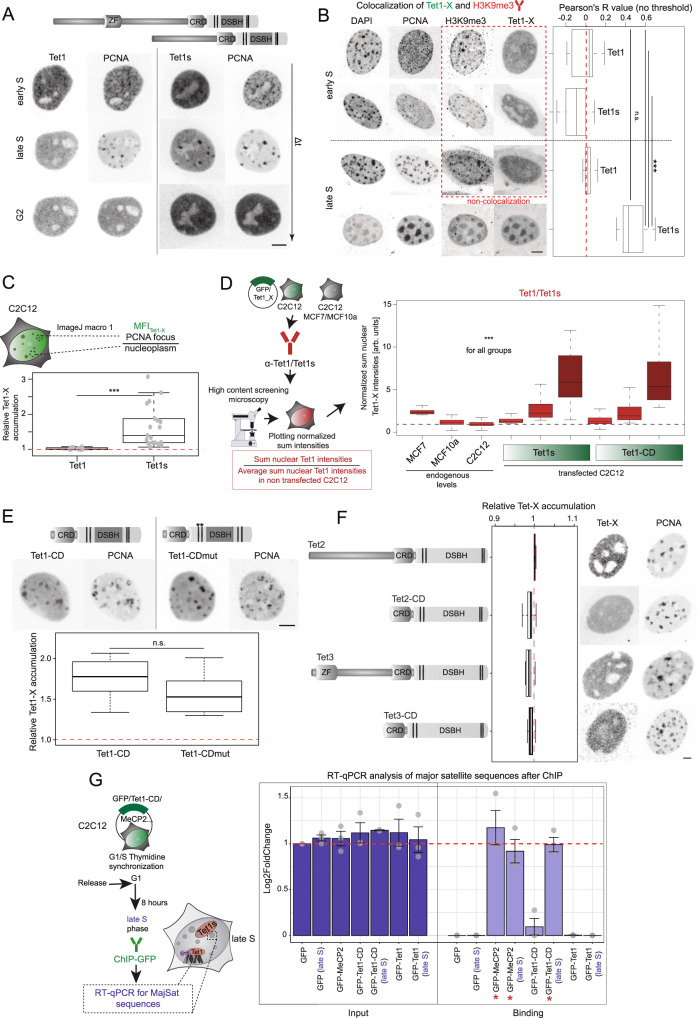
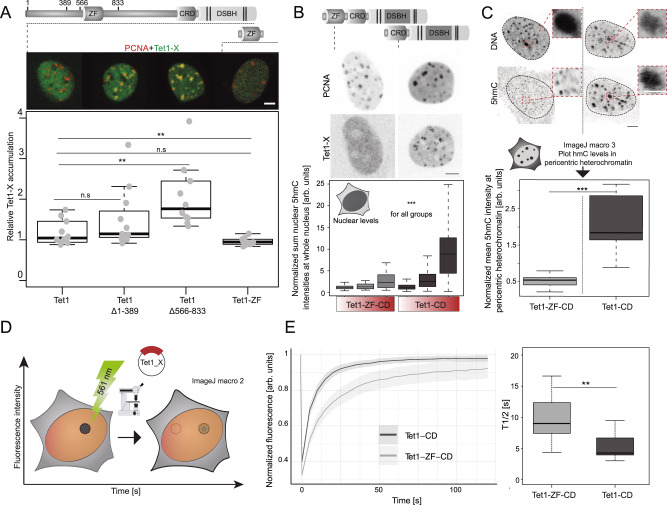
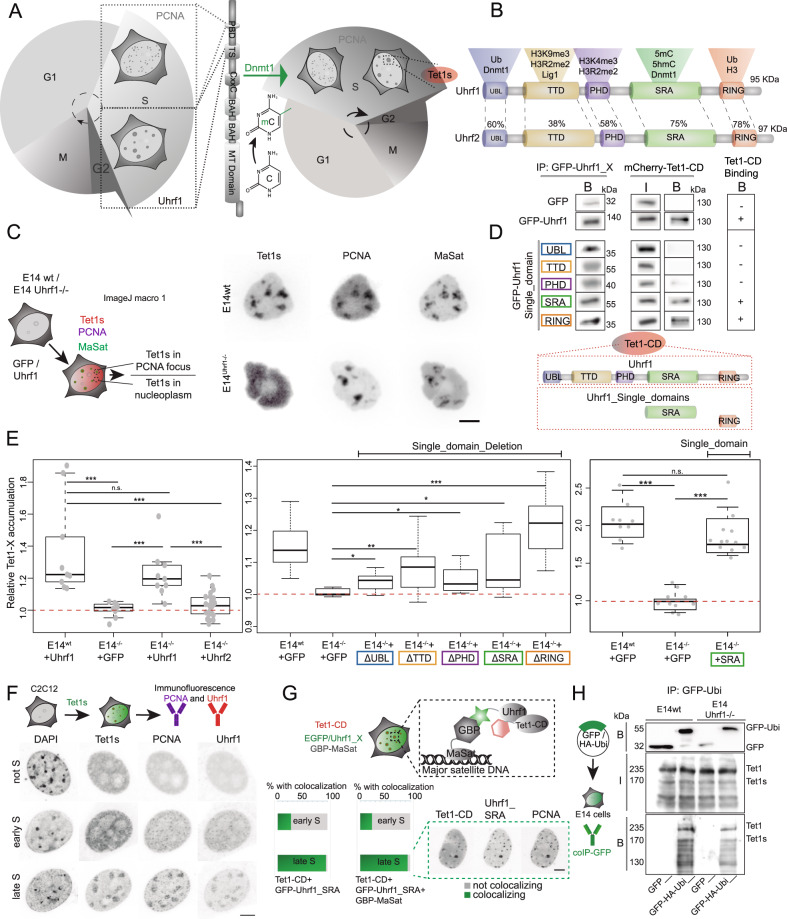
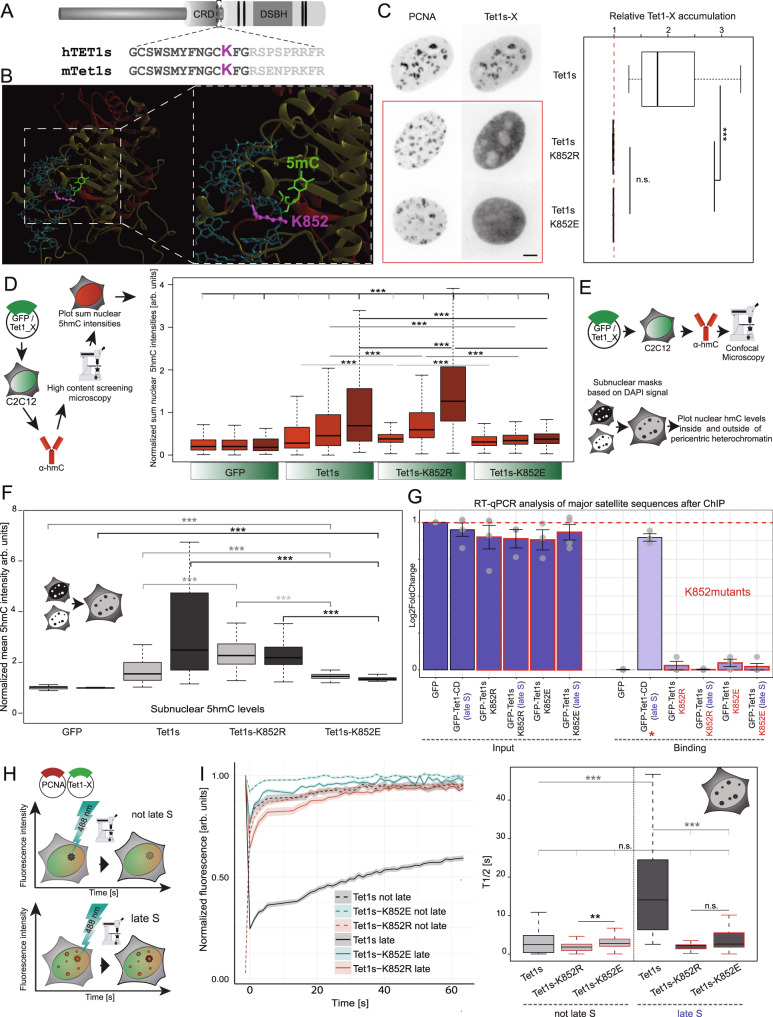
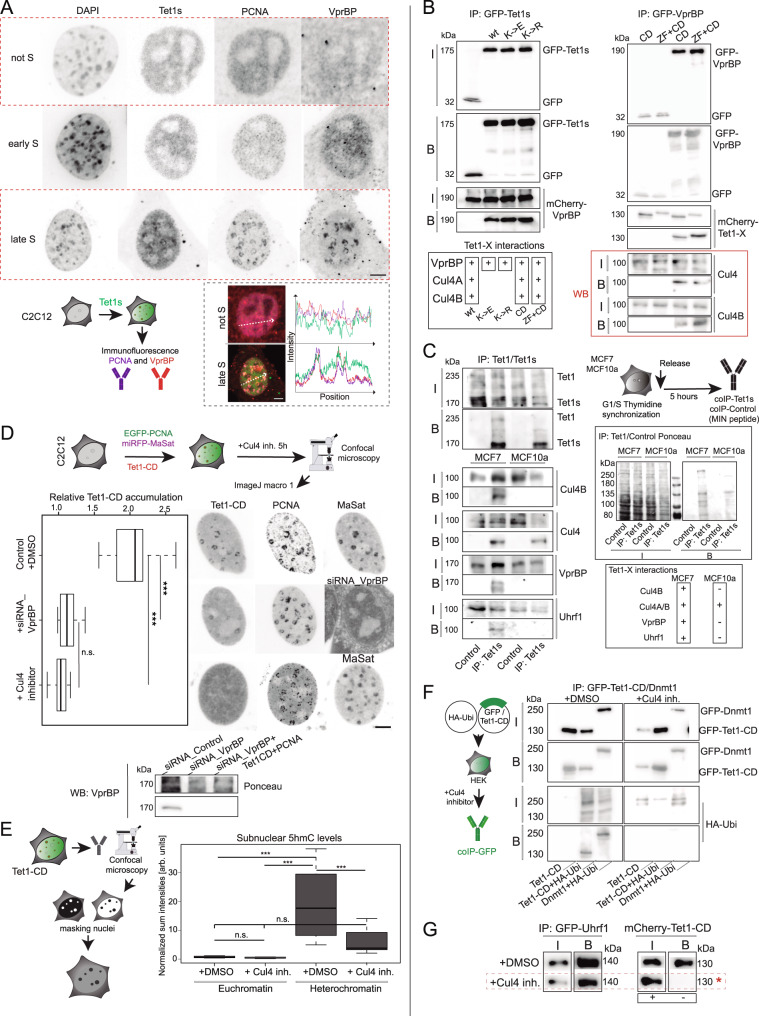
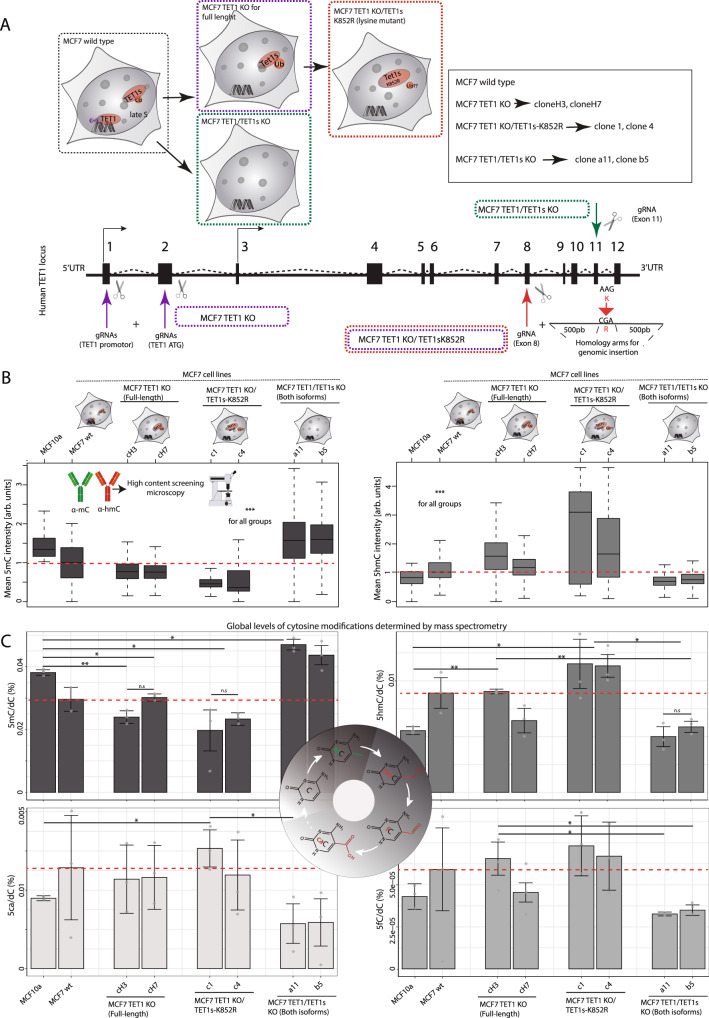
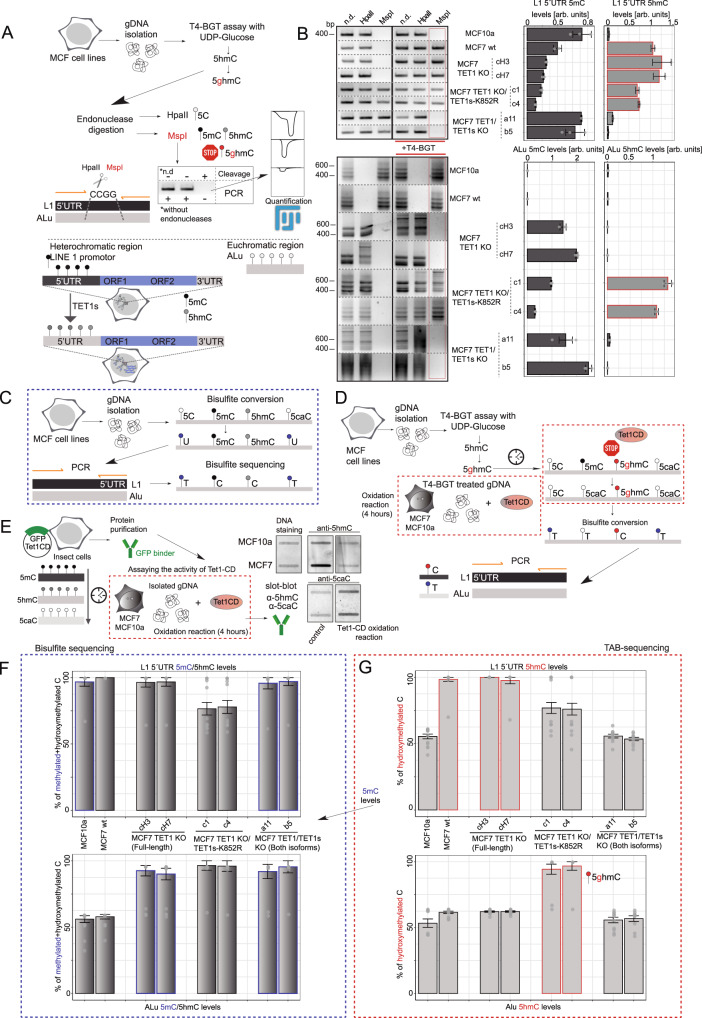
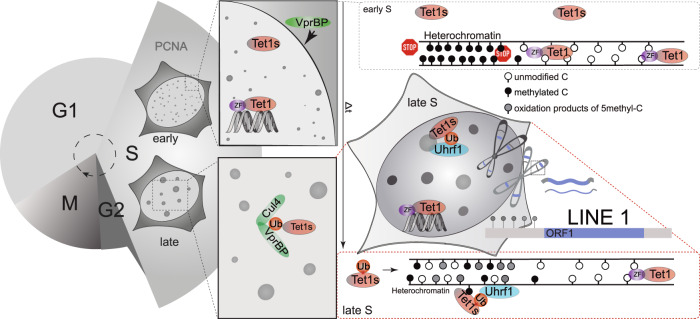
Oxidation of the epigenetic DNA mark 5-methylcytosine by Tet dioxygenases is an established route to diversify the epigenetic information, modulate gene expression and overall cellular (patho-)physiology. Here, we demonstrate that Tet1 and its short isoform Tet1s exhibit distinct nuclear localization during DNA replication resulting in aberrant cytosine modification levels in human and mouse cells. We show that Tet1 is tethered away from heterochromatin via its zinc finger domain, which is missing in Tet1s allowing its targeting to these regions. We find that Tet1s interacts with and is ubiquitinated by CRL4(VprBP). The ubiquitinated Tet1s is then recognized by Uhrf1 and recruited to late replicating heterochromatin. This leads to spreading of 5-methylcytosine oxidation to heterochromatin regions, LINE 1 activation and chromatin decondensation. In summary, we elucidate a dual regulation mechanism of Tet1, contributing to the understanding of how epigenetic information can be diversified by spatio-temporal directed Tet1 catalytic activity.


Conflict of interest statement

The authors declare no competing interests.

Figures

Fig. 1
Fig. 1. Breast cancer cells show aberrant 5mC oxidation and increased LINE 1 ORF1p level.
A Gene structure of the human TET1 locus. Non-coding exons 1 and 3 harbor different transcription start sites, targeted by a different promoter. Translation starts in exon 2 (TET1) and 4 (TET1s). TET1 protein functional domains are indicated. Graphical representation of cytosine modifications and their maintenance during the cell cycle. B Fiji-based in situ cytosine modifications analysis procedure. MCF cells were immunostained and imaged using confocal microscopy. Binary nuclear and heterochromatin masks were generated based on DNA signals (DAPI). Mean fluorescence intensities in the respective areas were measured. C Boxplots showing normalized mean intensity of cytosine modifications at heterochromatin regions. n (5mC) = 23 (MCF10a) - 17 (MCF7), n (5hmC) = 19 (MCF10a) - 20 (MCF7), n (5fC) = 21 (MCF10a) - 17 (MCF7), n (5caC) = 17 (MCF10a) - 16 (MCF7) cells. D, E Live-cell analysis of Tet1 and Tet1s subnuclear localization: confocal images of MCF10a and MCF7 cells expressing EGFP-Tet1s/EGFP-Tet1 and mRFP-PCNA 8 h post-transfection. Colocalization of Tet1-X with PCNA was examined by line-profile analysis and relative protein accumulation in early and late S-phase. n (TET1) = 14 (MCF10a) - 13 (MCF7), n (Tet1s) = 16 (MCF10a) - 17 (MCF7) cells. F Synchronized MCF cells immunostained against LINE 1 ORF1p. Cytoplasmic fluorescence mean intensity levels were plotted. Representative confocal images for these immunostainings, including endogenous TET1/TET1s, are shown in G. For all boxplots, the box represents 50% of the data, starting in the first quartile (25%) and ending in the third (75%). The line inside represents the median. The whiskers represent the upper and lower quartile. Statistical significance was tested with a paired two-samples Wilcoxon test (n.s. not significant, is given for p-values ≥ 0.05; one star (*) for p-values < 0.05 and ≥ 0.005; two stars (**) is given for values < 0.005 and ≥ 0.0005; three stars (***) is given for values < 0.0005). N-numbers and p-values are shown in Supplementary Data 1. Source data are provided as a Source Data file. Scale bars = 5 µm.
Fig. 2
Fig. 2. Tet1s localizes at heterochromatin during DNA replication.
A Live-cell microscopy images of C2C12 cells expressing mRFP-PCNA as DNA replication marker and EGFP-Tet1-X. Cells showing an early S-phase pattern were imaged every 20 min. Time points in early, late S and G2 phases are shown. B Immunostaining against PCNA, H3K9me3 (as heterochromatin marker) and Tet1-X. C2C12 cells were transfected, immunostained, and imaged in S-phase. Pearson coefficient values (colocalization) were plotted for early versus late S-phase cells. C Tet1-X accumulation analysis in late S-phase cells. Mean fluorescence intensities of three nuclear areas inside and outside of DNA replication sites were measured and averaged. Mean fluorescence intensities of Tet1-X in PCNA foci were divided by the mean fluorescence in nucleoplasmic regions. Boxplot depicts the results of quantification. D Immunostaining against Tet1/Tet1s in MCF10a, MCF7 and C2C12 cells. Sum nuclear levels of Tet1/Tet1s and mean nuclear levels of EGFP were measured by wide-field high-content microscopy. Transfected C2C12 cells were grouped by their mean EGFP fluorescence (low, mid, high) (See Supplementary Fig. 2B, C). Boxplot shows Sum nuclear Tet1/Tet1s normalized by the average sum nuclear intensity in non-transfected C2C12. E Representative images of transfected C2C12 cells (mRFP-PCNA and EGFP-Tet1-CD/Tet1-CDmut). Boxplot shows Tet1-X relative accumulation. F Late S-phase C2C12 cells transfected with mRFP-PCNA and EGFP-Tet2/Tet3 proteins or respective catalytic domains. Boxplots show relative accumulation of Tet-X at replicating heterochromatin. G Chromatin immunoprecipitation (ChIP) followed by qPCR for MajSat sequences. C2C12 cells were transfected with Tet1-X and MeCP2 (positive control) and synchronized in G1/late S-phase. Barplots show the average value of amplification levels in input and chromatin binding fractions normalized to the GFP-input (red line). The whiskers represent the standard deviation with a 95% confidence interval. For all boxplots, the box represents 50% of the data, starting in the first quartile (25%) and ending in the third (75%). The line inside represents the median. The whiskers represent the upper and lower quartile. Statistical significance was tested with a paired two-samples Wilcoxon test (n.s., not significant, is given for p-values ≥ 0.05; one star (*) for p-values < 0.05 and ≥ 0.005; two stars (**) is given for values < 0.005 and ≥ 0.0005; three stars (***) is given for values < 0.0005). N-numbers and p-values are shown in Supplementary Data 1. Source data are provided as a Source Data file. Scale bar = 5 μm.
Fig. 3
Fig. 3. C2C12 cells overexpressing Tet1s show aberrant 5mC oxidation and higher levels of LINE 1 ORF1p.
A Cells transfected with EGFP-Tet1, EGFP-Tet1s or EGFP alone, were immunostained against 5hmC. Fluorescence intensity levels of overexpressed proteins and 5hmC were measured, sum nuclear 5hmC levels were normalized to the sum nuclear DAPI intensity and grouped as described in Supplementary Fig. 2B, D. B C2C12 cells non-transfected and transfected with GFP-Tet1s were synchronized and immunostained against LINE 1 ORF1 protein. Fluorescence intensity levels of the protein were measured and mean cytoplasmic levels were plotted. Representative confocal images for LINE 1 ORF1p and TET1/TET1s immunostainings are shown in C. For all boxplots, the box represents 50% of the data, starting in the first quartile (25%) and ending in the third (75%). The line inside represents the median. The whiskers represent the upper and lower quartile. Statistical significance was tested with a paired two-samples Wilcoxon test (n.s. not significant, is given for p-values ≥ 0.05; one star (*) for p-values < 0.05 and ≥ 0.005; two stars (**) is given for values < 0.005 and ≥ 0.0005; three stars (***) is given for values < 0.0005). N-numbers and p-values are shown in Supplementary Data 1. Source data are provided as a Source Data file. Scale bar = 5 μm.
Fig. 4
Fig. 4. The zinc finger domain of Tet1 impedes S-phase dependent heterochromatin association and prevents aberrant 5mC oxidation.
A Domain organization of Tet1 with locations of amino acids corresponding to N-terminal deletion mutants. Representative images of C2C12 cells in late S-phase expressing EGFP-tagged Tet1/Tet1∆1-389/Tet1∆566−833/Tet1-ZF domain and mRFP-PCNA. Boxplot shows quantification of relative accumulation. B C2C12 cells were transfected with mcherry-Tet1CD/Tet1-CD-ZF and EGFP-PCNA. Representative images of cells in late S-phase are shown. In situ 5hmC levels were analyzed 24 h after transfection by wide-field high-content microscopy. Boxplots show sum nuclear 5hmC levels normalized by averaged levels in non-transfected cells and sum nuclear DAPI. Cells were grouped by their mean mcherry fluorescence intensities into low, mid, and high expressing (see Supplementary Fig. 2B, C). C Representative images of C2C12 from 4B. Selected ROIs in pericentric heterochromatic regions were magnified. Fiji-based in situ 5hmC quantification was performed and results are shown in boxplot (5hmC levels in pericentric heterochromatin in dark-gray). D FRAP experiments scheme in cells expressing mcherry-tagged Tet1-CD/Tet1-CD-ZF. The mcherry signal was photobleached with a 561 nm laser and recovery of fluorescence was followed by time lapse microscopy. E Fluorescence recovery curves and T-half times were calculated using easyFRAP. Line plots show normalized averaged fluorescence recovery values, and error bands show the respective standard deviation. 95% confidence intervals are indicated in the plot. Representative images are shown in Supplementary Fig. 3C. For all boxplots, the box represents 50% of the data, starting in the first quartile (25%) and ending in the third (75%). The line inside represents the median. The whiskers represent the upper and lower quartile. Statistical significance was tested with a paired two-samples Wilcoxon test (n.s. not significant, is given for p-values ≥ 0.05; one star (*) for p-values < 0.05 and ≥ 0.005; two stars (**) is given for values < 0.005 and ≥ 0.0005; three stars (***) is given for values < 0.0005). N-numbers and p-values are shown on Supplementary Data 1. Source data are provided as a Source Data file. Scale bar = 5 μm. White scale bar = 2.5 μm.
Fig. 5
Fig. 5. Uhrf1 physically interacts with Tet1 and is required for its S-phase localization.
A DNA methylation maintenance throughout the cell cycle: Dnmt1 is recruited to sites of ongoing DNA replication by Uhrf1 and PCNA, ensuring faithful inheritance of the DNA methylome. Tet1s is recruited to heterochromatin during late S-phase. B Domain organization of Uhrf1 and Uhrf2: ubiquitin-like (UBL) domain, histone modifications binding tandem tudor domain (TTD) and plant homeodomain (PHD), DNA interacting SET and RING associated (SRA) domain and the really interesting new gene (RING) domain. Sequence homology is shown in percentage. C Representative images of wild-type E14 mouse embryonic stem cells or Uhrf1-deficient cells (E14 Uhrf1−/−) expressing mcherry-Tet1s, miRFP-PCNA and EGFP-MaSat. D HEK293-EBNA cells were transfected with EGFP/EGFP-Uhrf1 and mcherry-Tet1CD. Cell extracts were analyzed by immunoprecipitation using a GFP-binding nanobody and western blotting. Cut-outs show the bound GFP-fractions and the input (I) and bound (B) mcherry fractions. E Boxplots depict quantification of Tet1s accumulation in E14 wildtype and E14−/− co-transfected with PCNA, Tet1s and either Uhrf1 (left) or different Uhrf1 mutant constructs (mid/right boxplot). Representative images shown in Supplementary Fig. 4B, C. F Uhrf1 and PCNA immunostaining in C2C12 cells transfected with EGFP-Tet1s. Representative images for 3 independent experiments are shown. G F3H assay in C2C12 transfected with miRFP-PCNA, mcherry-Tet1-CD, EGFP-Uhrf or EGFP, and GBP-MaSat. Percentage of cells with Tet1-CD localized at pericentric heterochromatin. H Ubiquitination of Tet1/Tet1s assayed by immunoprecipitation: E14 wildtype and E14−/− were transfected with EGFP or EGFP-HA-tagged ubiquitin, immobilized using GFP-binding nanobody, and analyzed by western blotting (antibodies against GFP, Tet1/Tet1s and Dnmt1). The cut-outs show the bound GFP-fractions and the input and bound Tet1/Tet1s fractions. Two independent experiments were performed. For all boxplots, the box represents 50% of the data, starting in the first quartile (25%) and ending in the third (75%). The line inside represents the median. The whiskers represent the upper and lower quartile. Statistical significance was tested with a paired two-samples Wilcoxon test (n.s. not significant, is given for p-values ≥ 0.05; one star (*) for p-values < 0.05 and ≥ 0.005; two stars (**) is given for values < 0.005 and ≥ 0.0005; three stars (***) is given for values < 0.0005). N-numbers and p-values are shown in Supplementary Data 1. Source data are provided as a Source Data file. Scale bar = 5 μm.
Fig. 6
Fig. 6. Lysine residue K852 in the CRD domain of Tet1 is crucial for Tet1s S-phase localization and targeted catalytic activity.
A Localization of the conserved lysine residue K852 in Tet1s and sequence alignment between human and mouse Tet1. B Model of mouse Tet1s generated by homology modeling on the refined human Tet2 crystal structure (4NM6). The CRD is shown in red (conserved lysine 852 in pink), and the DSBH in yellow. The bound DNA helix appears in blue with 5mC flipped out of the double helix in green. C Representative images of C2C12 cells expressing mRFP-PCNA and EGFP-Tet1s/Tet1s-K852R/Tet1s-K852E. Boxplots showing heterochromatin accumulation of Tet1-X. D C2C12 cells from C were immunostained against 5hmC 24 h after transfection. Nuclear 5hmC levels were measured by high-content microscopy. Boxplot shows sum nuclear 5hmC levels normalized to the averaged 5hmC levels of background cells and against sum nuclear DAPI intensity. Cells were grouped according to their mean EGFP fluorescence intensities (see Supplementary Fig. 2B, C). E, F Fiji-based in situ 5hmC analysis: Binary nucleoplasm and heterochromatin masks were generated and mean fluorescence intensities in the respective areas were measured. Boxplots in F show 5hmC levels in pericentric heterochromatin (dark-gray) and the surrounding nucleoplasm (light-gray). Representative images and constitutive heterochromatin relative areas are shown in Supplementary Fig. 5E, F. G Chromatin immunoprecipitation experiments followed by qPCR for MajSat sequences. C2C12 cells were transfected with Tet1s-K852R/Tet1s-K852E and Tet1-CD (positive control) and synchronized in G1/late S phase. Barplots show the average value of amplification levels in input and chromatin binding fractions normalized with GFP-input (red line). The error bars represent the standard deviation with a 95% confidence interval. H FRAP experiments in transfected C2C12 cells (EGFP-tagged Tet1s/Tet1s-K852R/Tet1s-K852E). The EGFP signal was photobleached with a 488 nm laser. I For analysis, fluorescence recovery curves and T-half times were calculated using easyFRAP. Line plots show normalized averaged fluorescence recovery values, and error bands show the respective standard deviation. 95% confidence intervals are indicated in the plot. For all boxplots, the box represents 50% of the data, starting in the first quartile (25%) and ending in the third (75%). The line inside represents the median. The whiskers represent the upper and lower quartile. Statistical significance was tested with a paired two-samples Wilcoxon test (n.s. not significant, is given for p-values ≥ 0.05; one star (*) for p-values < 0.05 and ≥ 0.005; two stars (**) is given for values < 0.005 and ≥ 0.0005; three stars (***) is given for values < 0.0005). N-numbers and p-values are shown in Supplementary Data 1. Source data are provided as a Source Data file. Scale bar = 5 µm.
Fig. 7
Fig. 7. The CRL4(VprBP) complex ubiquitinates Tet1s and this is needed for Tet1s recruitment to late-replicating heterochromatin.
A VprBP and PCNA immunostaining in C2C12 cells expressing EGFP-Tet1s: representative images of 3 independent experiments and line-profile analysis are shown. B HEK293-EBNA cells were transfected with EGFP or EGFP-tagged Tet1-X/VprBP, or mcherry fusions (VprBP/Tet1-X). Cell extracts were analyzed by immunoprecipitation with immobilized GFP-binding nanobody, followed by detection with antibodies against GFP, RFP, Cul4 and Cul4B. The cut-outs show input/bound GFP and input/bound mcherry fractions. C Endogenous co-immunoprecipitation: MCF cell extracts were analyzed using immobilized Tet1/Tet1s followed by detection with antibodies against Tet1/Tet1s, Cul4B, Cul4, VprBP and Uhrf1. MIN antigen (attP-peptide) was used as negative control. The cut-outs show the input/bound Tet1/Tet1s fractions. D C2C12 cells were transfected with mcherry-Tet1-CD, EGFP-PCNA and miRFP-MaSat. Additionally, cells were transfected with siRNA_VprBP or treated with pevonedistat to indirectly inhibit Cul4/DMSO for 5 h before live-cell imaging. Representative images are shown. Boxplots depict Tet1-CD accumulation at heterochromatin. Western blotting with antibody against VprBP validates the knockdown in C2C12 cells. E In situ 5hmC analysis after 24 h treatment with Cul4 inhibitor. Boxplots show the quantification of 5hmC levels in C2C12 cells in euchromatin (light-gray) versus heterochromatin (dark-gray). F HEK293-EBNA cells were transfected with EGFP-tagged Tet1-CD/Dnmt1 and HA-ubiquitin, treated with pevonedistat/DMSO for 24 h, and analyzed by immunoprecipitation with immobilized GFP-binding nanobody and detection with antibodies against GFP and HA. The cut-outs show the input/bound GFP-fractions and the input/bound HA-Ubi fractions. G HEK293-EBNA cells were transfected with EGFP-Uhrf1 and mcherry-Tet1-CD and treated with pevonedistat/DMSO for 24 h. Cell extracts were analyzed by immunoprecipitation with immobilized GFP-binding nanobody, and detection with antibodies against GFP and RFP. The cut-outs show the input/bound GFP-fractions, and the input/bound mcherry fractions. In B, C, G, two independent experiments were performed. For boxplots, the box represents 50% of the data, starting in the first quartile (25%) and ending in the third (75%). The line inside represents the median. The whiskers represent the upper and lower quartile. Statistical significance was tested with a paired two-samples Wilcoxon test (n.s. not significant, is given for p-values ≥ 0.05; one star (*) for p-values < 0.05 and ≥ 0.005; two stars (**) is given for values < 0.005 and ≥ 0.0005; three stars (***) is given for values < 0.0005). N-numbers and p-values are shown in Supplementary Data 1. Source data are provided as a Source Data file. Scale bar = 5 µm.
Fig. 8
Fig. 8. Comparison of global levels of cytosine modifications in MCF10a cell line versus MCF7 and TET1-X mutants.
A Scheme illustrating the different MCF7 cell lines generated by CRISPR/Cas9 genome editing, showing positions of gRNA targets in the TET1 locus. MCF7 TET1 KO (full isoform KO), MCF7 TET1 KO/TET1s-K852R (full isoform KO and TET1s lysine mutant) and MCF7 TET1/TET1s KO (both isoforms KO) were generated. Two different clones were selected and used as biological replicates. B Immunofluorescence analysis of 5mC and 5hmC nuclear levels in MCF10a, MCF7 wild-type and MCF7 TET1-X mutants by high-content microscopy. Levels were compared with 5mC/5hmC shown in C. Mean intensity values were normalized to the average for MCF7 wild-type (discontinuous red line). C Barplots showing levels of 5mC, 5hmC, 5fC, and 5caC in genomic DNA measured by ultra-high performance liquid chromatography coupled to tandem mass spectrometry (UHPLC-MS/MS). The abundance of genomic cytosine modifications was plotted as the fraction of total modified cytosines, and DNA modification levels are expressed as percentage (%). Average levels in MCF7 wild-type cells are indicated with a discontinuous red line for all cytosine modifications. The error bars represent the standard deviation with a 95% confidence interval. For all boxplots, the box represents 50% of the data, starting in the first quartile (25%) and ending in the third (75%). The line inside represents the median. The whiskers represent the upper and lower quartile. Statistical significance was tested with a paired two-samples Wilcoxon test and One-Way ANOVA for mass spectrometry data (n.s. not significant, is given for p-values ≥ 0.05; one star (*) for p-values < 0.05 and ≥ 0.005; two stars (**) is given for values < 0.005 and ≥ 0.0005; three stars (***) is given for values < 0.0005). N-numbers and p-values are shown in Supplementary Data 1. Source data are provided as a Source Data file.
Fig. 9
Fig. 9. 5mC and 5hmC levels at heterochromatin (LINE 1 promoter) and euchromatic loci (Alu).
A Scheme of GluMS-PCR experiments: DNA glucosylation, MspI and HpaII digestion and PCR based 5hmC/5mC detection. B Cut-off of agarose gels showing PCR products (LINE 1 protomer and Alu element) after T4-BGT treatment and endonuclease digestion. Barplots showing densitometry measurements (for PCR bands) quantifying 5mC/5hmC levels. Higher levels of 5hmC are indicated with red edges in the barplot. C Bisulfite conversion of genomic DNA followed by PCR for amplification of LINE 1 promoter and Alu element. Unmodified or 5caC is converted to uracil and consequently be read as a T after PCR. 5mC or 5hmC are not converted, and cannot be distinguished by this method. D TAB (Tet-assisted bisulfite) sequencing experiments scheme. 5hmC is protected from further oxidation by incubation with T4-BGT and UDP-glucose. 5mC (but not protected 5ghmC) is oxidized to caC by Tet1-CD incubation followed by bisulfite conversion of C and 5caC and PCR. Only 5ghmC will be read as a C after PCR and sequencing. E Process of GFP-Tet1-CD protein purification and subsequent oxidation reaction test using gDNA. Slot blotting of DNA before and after oxidation reaction shows levels of 5hmC and 5caC. F Barplots showing the percentage of 5mC/5hmC at base resolution level after bisulfite conversion of unmodified cytosines, PCR and sequencing. Bisulfite sequencing experiments were performed for euchromatic versus heterochromatic loci as GluMS-PCR experiments. G Barplots showing the percentage of 5hmC at base resolution level after TAB-sequencing analysis. Experiment was performed with gDNA treated as described in A, followed by Tet1-CD oxidation reaction, bisulfite conversion and PCR. Barplots showing higher percentage of 5hmC are indicated by red outlines, and those with higher percentage of 5mC in F are indicated by blue outlines. For B, F, G, the error bars represent the standard deviation with a 95% confidence interval. Statistical significance was tested with a paired two-samples Wilcoxon test using R-studio. N-numbers and p-values are shown in Supplementary Data 1. Source data are provided as a Source Data file.
Fig. 10
Fig. 10. Model of Tet1s and Tet1 regulation during the cell cycle.
Tet1 via its zinc finger domain is tethered away from heterochromatin, which prevents spreading of hydroxymethylation to these regions. The short isoform Tet1s lacking this domain gets ubiquitinated by the CRL4(VprBP) complex and the modified protein is bound by Uhrf1 and recruited to late-replicating heterochromatin. This targets Tet1s activity to heterochromatin and results in aberrant oxidation of methylcytosine in heterochromatic regions in both human and mouse cells depending on the level of this isoform. This in turn also results in the reactivation of silenced repetitive DNA elements like LINE 1 or major satellite repeats.

Similar articles

Cited by

References

    1. Baylin SB, Jones PA. A decade of exploring the cancer epigenome—biological and translational implications. Nat. Rev. Cancer. 2011;11:726–734. doi: 10.1038/nrc3130. - DOI - PMC - PubMed
    1. Ludwig AK, Zhang P, Cardoso MC. Modifiers and readers of DNA modifications and their impact on genome structure, expression, and stability in disease. Front. Genet. 2016;7:115. doi: 10.3389/fgene.2016.00115. - DOI - PMC - PubMed
    1. Goll MG, Bestor TH. Eukaryotic cytosine methyltransferases. Annu. Rev. Biochem. 2005;74:481–514. doi: 10.1146/annurev.biochem.74.010904.153721. - DOI - PubMed
    1. Chuang LS, et al. Human DNA-(cytosine-5) methyltransferase-PCNA complex as a target for p21WAF1. Science. 1997;277:1996–2000. doi: 10.1126/science.277.5334.1996. - DOI - PubMed
    1. Hashimoto H, Horton JR, Zhang X, Cheng X. UHRF1, a modular multi-domain protein, regulates replication-coupled crosstalk between DNA methylation and histone modifications. Epigenetics. 2009;4:8–14. doi: 10.4161/epi.4.1.7370. - DOI - PMC - PubMed

Publication types

MeSH terms

LinkOut - more resources