Effect of chronic intermittent ethanol vapor exposure on RNA content of brain-derived extracellular vesicles
- PMID: 36055466
- PMCID: PMC10173183
- DOI: 10.1016/j.alcohol.2022.08.006
Effect of chronic intermittent ethanol vapor exposure on RNA content of brain-derived extracellular vesicles
Abstract
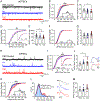
Extracellular vesicles (EVs) are important players in normal biological function and disease pathogenesis. Of the many biomolecules packaged into EVs, coding and noncoding RNA transcripts are of particular interest for their ability to significantly alter cellular and molecular processes. Here we investigate how chronic ethanol exposure impacts EV RNA cargo and the functional outcomes of these changes. Following chronic intermittent ethanol (CIE) vapor exposure, EVs were isolated from male and female C57BL/6J mouse brain. Total RNA from EVs was analyzed by lncRNA/mRNA microarray to survey changes in RNA cargo following vapor exposure. Differential expression analysis of microarray data revealed a number of lncRNA and mRNA types differentially expressed in CIE compared to control EVs. Weighted gene co-expression network analysis identified multiple male and female specific modules related to neuroinflammation, cell death, demyelination, and synapse organization. To functionally test these changes, whole-cell voltage-clamp recordings were used to assess synaptic transmission. Incubation of nucleus accumbens brain slices with EVs led to a reduction in spontaneous excitatory postsynaptic current amplitude, although no changes in synaptic transmission were observed between control and CIE EV administration. These results indicate that CIE vapor exposure significantly changes the RNA cargo of brain-derived EVs, which have the ability to impact neuronal function.
Keywords: alcohol use disorder; extracellular vesicles; lncRNA; synaptic transmission; transcriptome.
Copyright © 2022 Elsevier Inc. All rights reserved.
Conflict of interest statement
Conflicts of interest Authors have no conflicts of interest.
Figures


Similar articles
-
Sex differences in the transcriptome of extracellular vesicles secreted by fetal neural stem cells and effects of chronic alcohol exposure.Biol Sex Differ. 2023 Apr 15;14(1):19. doi: 10.1186/s13293-023-00503-0. Biol Sex Differ. 2023. PMID: 37060018 Free PMC article.
-
Selective alterations of NMDAR function and plasticity in D1 and D2 medium spiny neurons in the nucleus accumbens shell following chronic intermittent ethanol exposure.Neuropharmacology. 2017 Jan;112(Pt A):164-171. doi: 10.1016/j.neuropharm.2016.03.004. Epub 2016 Mar 2. Neuropharmacology. 2017. PMID: 26946430 Free PMC article.
-
Brain regional gene expression network analysis identifies unique interactions between chronic ethanol exposure and consumption.PLoS One. 2020 May 29;15(5):e0233319. doi: 10.1371/journal.pone.0233319. eCollection 2020. PLoS One. 2020. PMID: 32469986 Free PMC article.
-
The allostatic impact of chronic ethanol on gene expression: A genetic analysis of chronic intermittent ethanol treatment in the BXD cohort.Alcohol. 2017 Feb;58:93-106. doi: 10.1016/j.alcohol.2016.07.010. Epub 2016 Nov 1. Alcohol. 2017. PMID: 27838001 Free PMC article.
-
Sorting and packaging of RNA into extracellular vesicles shape intracellular transcript levels.BMC Biol. 2022 Mar 24;20(1):72. doi: 10.1186/s12915-022-01277-4. BMC Biol. 2022. PMID: 35331218 Free PMC article.
Cited by
-
Neuroinflammatory responses and blood-brain barrier injury in chronic alcohol exposure: role of purinergic P2 × 7 Receptor signaling.J Neuroinflammation. 2024 Sep 28;21(1):244. doi: 10.1186/s12974-024-03230-4. J Neuroinflammation. 2024. PMID: 39342243 Free PMC article.
-
Sex differences in the transcriptome of extracellular vesicles secreted by fetal neural stem cells and effects of chronic alcohol exposure.Biol Sex Differ. 2023 Apr 15;14(1):19. doi: 10.1186/s13293-023-00503-0. Biol Sex Differ. 2023. PMID: 37060018 Free PMC article.
References
-
- Akassoglou K, Bauer J, Kassiotis G, Pasparakis M, Lassmann H, Kollias G, et al. (1998). Oligodendrocyte apoptosis and primary demyelination induced by local TNF/p55TNF receptor signaling in the central nervous system of transgenic mice: Models for multiple sclerosis with primary oligodendrogliopathy. American Journal of Pathology, 153(3), 801–813. - PMC - PubMed
-
- Atay S, Gercel-Taylor C, Kesimer M, & Taylor DD (2011). Morphologic and proteomic characterization of exosomes released by cultured extravillous trophoblast cells. Experimental Cell Research, 317(8), 1192–1202. - PubMed
-
- Bahi A, & Dreyer JL (2017). Viral-mediated overexpression of the Myelin Transcription Factor 1 (MyT1) in the dentate gyrus attenuates anxiety- and ethanol-related behaviors in rats. Psychopharmacology (Berl), 234(12), 1829–1840. - PubMed
Publication types
MeSH terms
Substances
Grants and funding
- R37 AA010422/AA/NIAAA NIH HHS/United States
- U24 AA016651/AA/NIAAA NIH HHS/United States
- U24 AA029968/AA/NIAAA NIH HHS/United States
- T32 NS007433/NS/NINDS NIH HHS/United States
- U24 AA020929/AA/NIAAA NIH HHS/United States
- K99 AA024836/AA/NIAAA NIH HHS/United States
- F31 AA029942/AA/NIAAA NIH HHS/United States
- U01 AA020929/AA/NIAAA NIH HHS/United States
- R01 AA010422/AA/NIAAA NIH HHS/United States
- R00 AA024836/AA/NIAAA NIH HHS/United States
- S10 RR019003/RR/NCRR NIH HHS/United States
- U01 AA020889/AA/NIAAA NIH HHS/United States
- U01 AA016651/AA/NIAAA NIH HHS/United States
- P50 AA010761/AA/NIAAA NIH HHS/United States
LinkOut - more resources
Full Text Sources

